Break Points Debugger Subtab
The Break Points subtab isn't used for SuiteScript 2.1 scripts. SuiteScript 2.1 script logging is done on the Chrome DevTools debugger console. For more information about debugging SuiteScript 2.1 scripts, see Chrome DevTools for SuiteScript 2.1 Script Debugging.
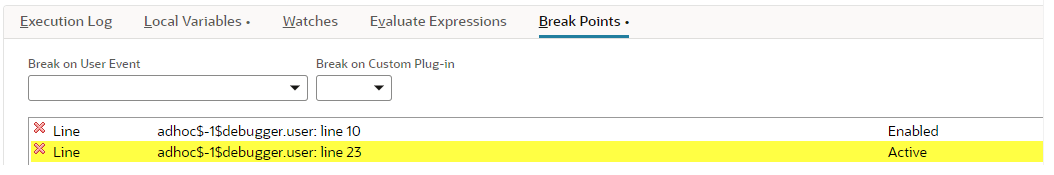
The Break Points subtab shows all your instruction-level (line) break points as well as your user event break points. You can add user event break points by selecting user events from the Break on User Event list.
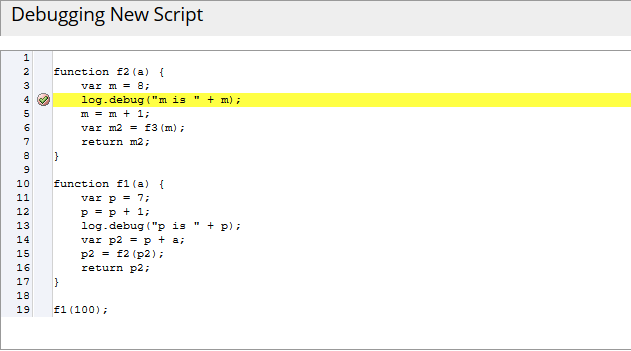
You can set break points in your code using the Script Debugger code window. By setting breakpoints, you can run your code up to a certain point, and then halt the execution at the break point and examine the current state of the execution.
To add or remove break points in your code:
-
Click between the line number and the line of code to add a breakpoint:
-
To remove a break point, click the break point icon as it appears in the code. You can also remove a break point by clicking the red x icon next to the break point, as it appears on the Break Points tab.
When you debug deployed scripts, you can set break points at each user event in your script. User events possibly invokable during script execution where the program halts execution.