Execution Log Debugger Subtab
The Execution Log subtab isn't used for SuiteScript 2.1 scripts. Logging of SuiteScript 2.1 scripts is done on the Chrome DevTools debugger console. For more information about debugging SuiteScript 2.1 scripts, see Chrome DevTools for SuiteScript 2.1 Script Debugging.
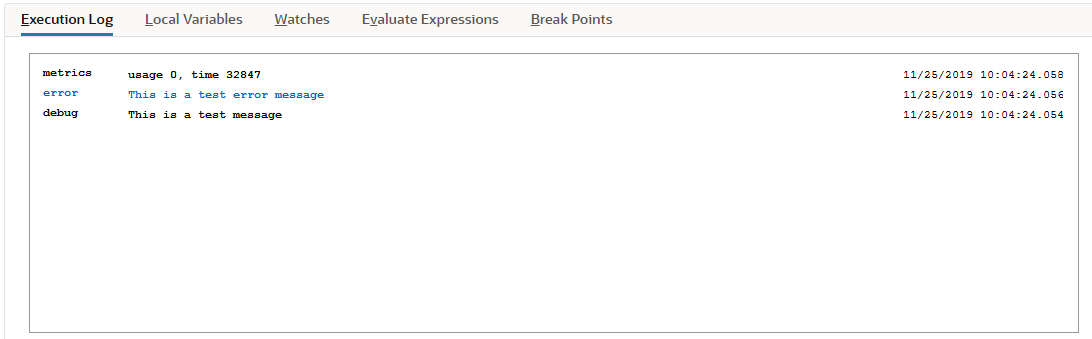
The Execution Log subtab shows all execution logs created by the currently executing program, including system errors. The execution log details that appear on this subtab are the same details that would normally appear in the Execution Log on the Script Deployment page. However, when you use the debugger, all script execution details appear on the Execution Log subtab on the Script Debugger page; these details will NOT appear on the Execution Log subtab of the Script Deployment page.
The type, subject, details, and timestamp are displayed on the Execution Log subtab. The timestamp is recorded on the server. It is converted to the current user's time zone for display.
Log details are collapsed by default, but you can see them by clicking the expand/collapse icon. Note that the subtab is automatically cleared at the start of each debugging session.