Example Use of the Script Debugger Buttons and Tabs
The following example shows how to debug a script using the execute, step over, and step into buttons. This example also shows how to use the Execution Log, Local Variables, and Watches tabs.
The code in this example assumes you have at least two customers with an entityId that includes 'Jack'.
-
Go to Customization > Scripting > Script Debugger.
-
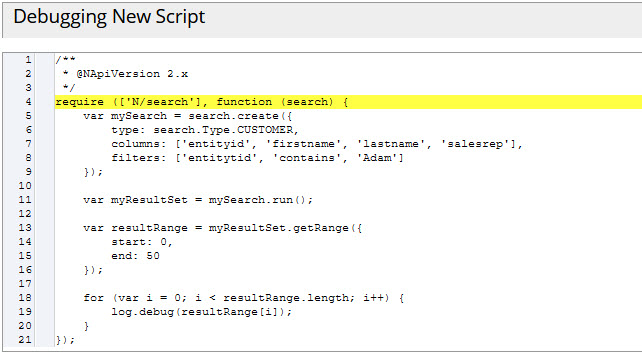
Enter the following code into the debugger window:
/** * @NApiVersion 2.x */ require (['N/search'], function (search) { var mySearch = search.create({ type: search.Type.CUSTOMER, columns: ['entityid', 'firstname', 'lastname', 'salesrep'], filters: ['entityid', 'contains', 'Jack'] }); var myResultSet = mySearch.run(); var resultRange = myResultSet.getRange({ start: 0, end: 50 }); for (var i = 0; i < resultRange.length; i++) { log.debug(resultRange[i]); } }); -
In the API Version dropdown list, select 2.0.
-
Click Debug Script.
-
Wait until the script is shown in the window with the first line highlighted. At this point, the script hasn't started to run yet.
-
Set a breakpoint at the
var myResultSet = mySearch.run()line by clicking between the line number (11) and the code line. When you add or remove a breakpoint, 'Running Script' is briefly displayed: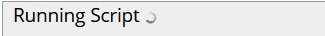
The script is not running, but the breakpoint is being inserted into the proper location.
-
Set another breakpoint at the
forline (line 18). The two breakpoints are shown like this: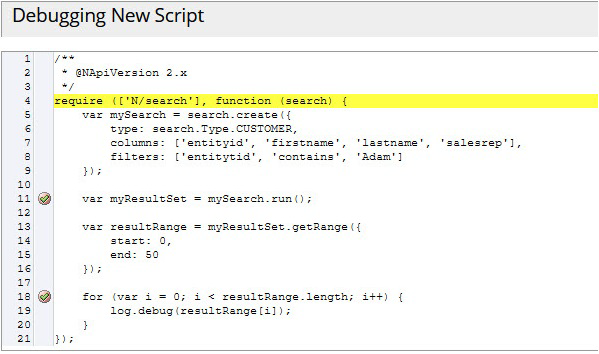
-
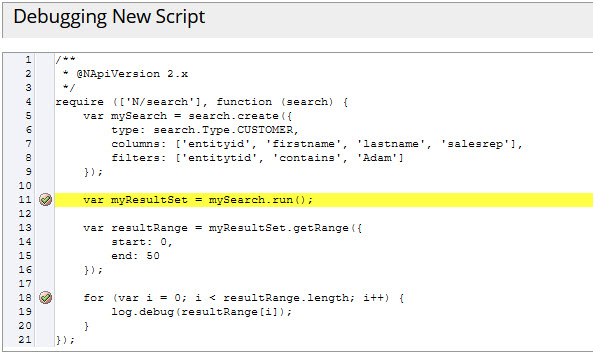
Click the Continue button
 to execute the script to the first breakpoint.
 -
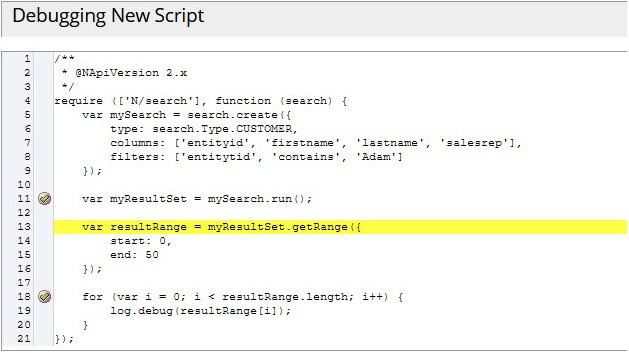
When the breakpoint is reached, the debugger pauses execution and highlights the line:
-
Click the Step Over button to execute the
mySearch.run()line to get your search results: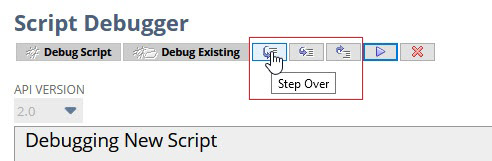
The debugger runs the search and pause at the next line of code:
-
While the debugger is paused, click the Local Variables subtab to view the value of the
myResultSetvariable: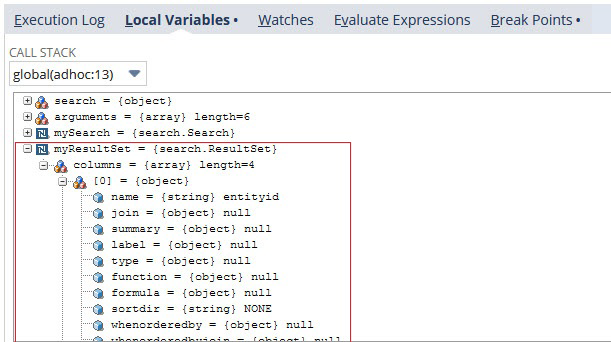
-
Click the Continue button to continue executing the script to the next breakpoint (line 15):
-
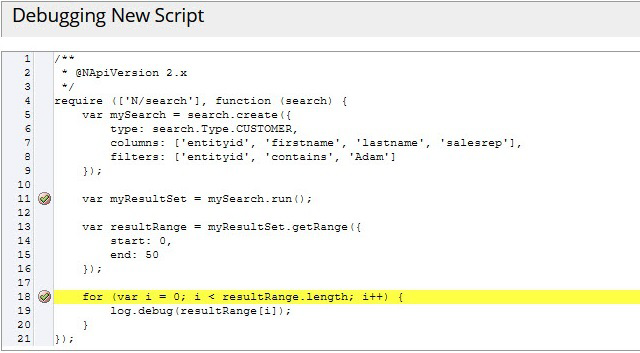
When the debugger pauses on line 15, click the Step Into button:
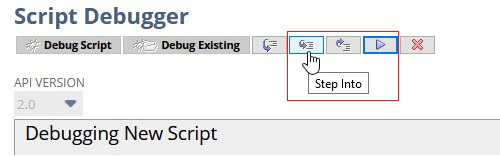
The debugger will execute the
forline and pause at the first line in theforloop block of code, which is thelog.debugstatement: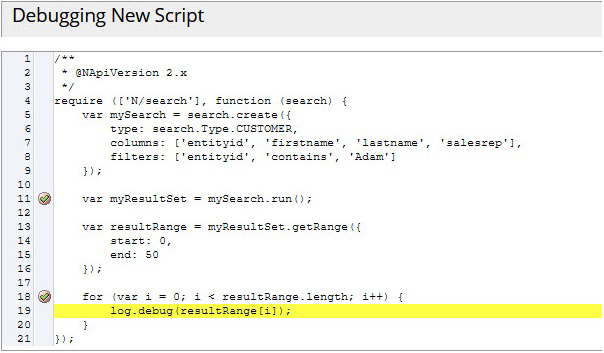
-
While the debugger is paused, add a watch for the
resultRangevariable to watch the variable value update as theforloop. Enter resultRange into the Add Watch box on the Watches subtab and press the Enter key to see the value.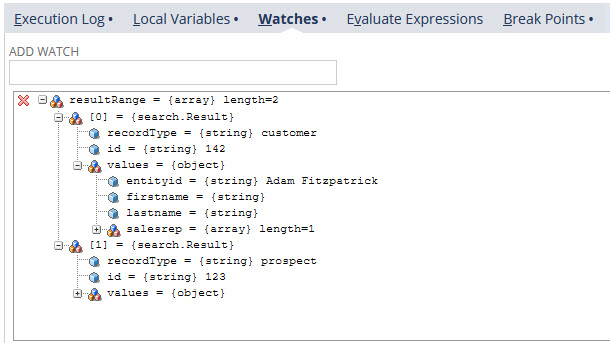
-
Click the Continue button. The debugger executes one iteration of the
forloop and will pause again. -
On the Watches tab, expand the
resultRangevariable to view its current value.
-
Click the second breakpoint to remove it. You must remove the breakpoint so the debugger does not pause at every iteration of the
forloop. You can remove any breakpoint at anytime while the debugger is paused. -
Click the Continue button to finish executing the script.
When the script completes execution, the Execution Log subtab shows all your log.debug statements:
