4.4 Visualize your Data in Oracle Machine Learning Notebooks
Oracle Machine Learning Notebooks offer rich visualization capabilities of your data. The visualizations depend on the type of your dataset.
The following visualization options are available:
- Visualize Data in a Table
A table is an arrangement of information or data in rows and columns. Using the Oracle Machine Learning Notebooks, you can create database tables, and also view the information in a tabular format. - Visualize Data in a Bar Chart
A bar chart is a graphical representation of data in rectangular bars. The length or height of the bars, depending on the horizontal or vertical orientation, depict the data set distribution. One axis represents a category, while the other represents values or counts. - Visualize Data in a Funnel Chart
A funnel chart is a graphical representation that resembles the shape of a funnel where each segment gets progressively narrower. The segments are arranged vertically and depict a hierarchy. Within the funnel chart, each segment corresponds to a step or stage in a sequential process. - Visualize Data in a Pyramid Chart
Pyramid charts present your data in a distinctive triangular configuration, horizontally segmented into partitions. Each segment in the pyramid charts represents points or steps in ascending or descending order. - Visualize Data in a Scatter Plot
Scatter plots represent the relationship between two numeric variables in a data set. It represents data points on a two-dimensional plane and show how much one variable is affected by another. The independent variable is plotted on the X-axis, while the dependent variable is plotted on the Y-axis. You can display points by one or more grouping variables such that each group has a distinct color and shape. - Visualize Data in a Line Chart
A line chart is a graphical representation used to display data points connected by straight lines. - Visualize Data in an Area Chart
An area chart uses lines to connect the data points and fills the area below these lines to the x-axis. Each data series contributes to the formation of a distinct shaded region. This emphasizes its contribution to the overall trend. As the data points fluctuate, the shaded areas expand or contract. - Visualize Data in a Pie Chart
A pie chart is a graphical representation of data in a circular form, with each slice of the circle representing a fraction that is a proportionate part of the whole. - Visualize Data in a Box Plot
A box plot provides an overview of data distributions in numeric data. It provides general information about the symmetry, skewness, variance, and outliers in a dataset. The box plot uses boxes and lines to depict the data distribution. - Visualize your Data in a Sunburst Chart
The sunburst chart is typically used to visualize hierarchical data structures - with part-to-whole relationships in data depicted additionally. - Visualize your Data in a Tag Cloud
A tag cloud is a visual representation of the most popular words or tags found in free-form text. The font size or the color of the text represents the frequency of occurrence. - Visualize your Data in a Treemap
A treemap is a visualization composed of nested rectangles, that represent certain categories within a selected dimension and are ordered in a hierarchy, or “tree.” Quantities and patterns can be compared and displayed in a limited chart space. - Visualize Data in a Map
The map visualization of OML Notebooks plots data points on a geographical map. For visualizing your data in a map in OML Notebooks, your data must contain explicit latitude and longitude values of locations to correctly position data on the map.
Parent topic: OML Notebooks
4.4.1 Visualize Data in a Table
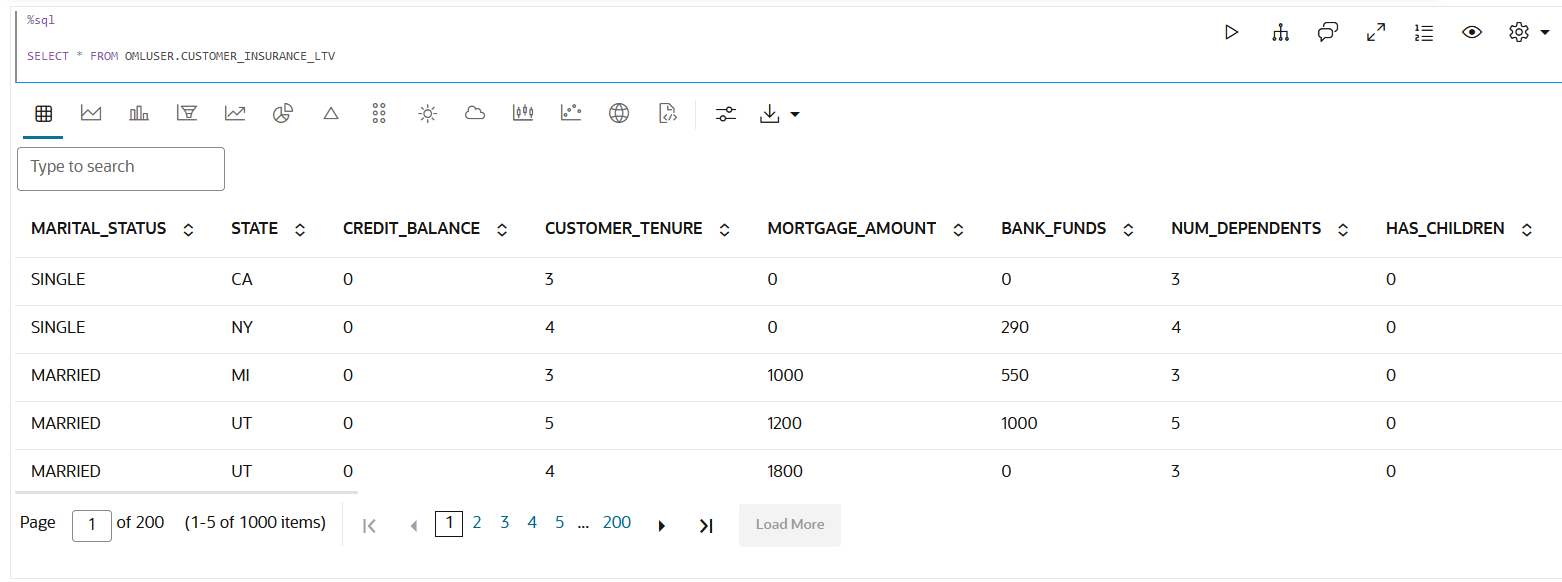
A table is an arrangement of information or data in rows and columns. Using the Oracle Machine Learning Notebooks, you can create database tables, and also view the information in a tabular format.
CUSTOMER_INSURANCE_LTV table
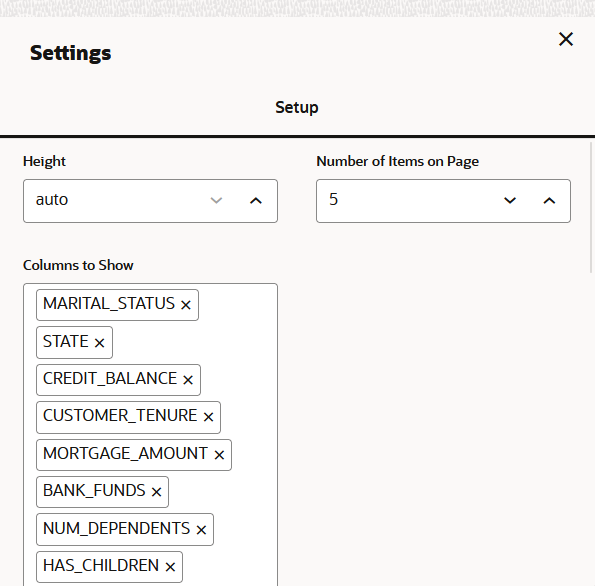
presented in a tabular format. The table has 8 columns and 200 rows.
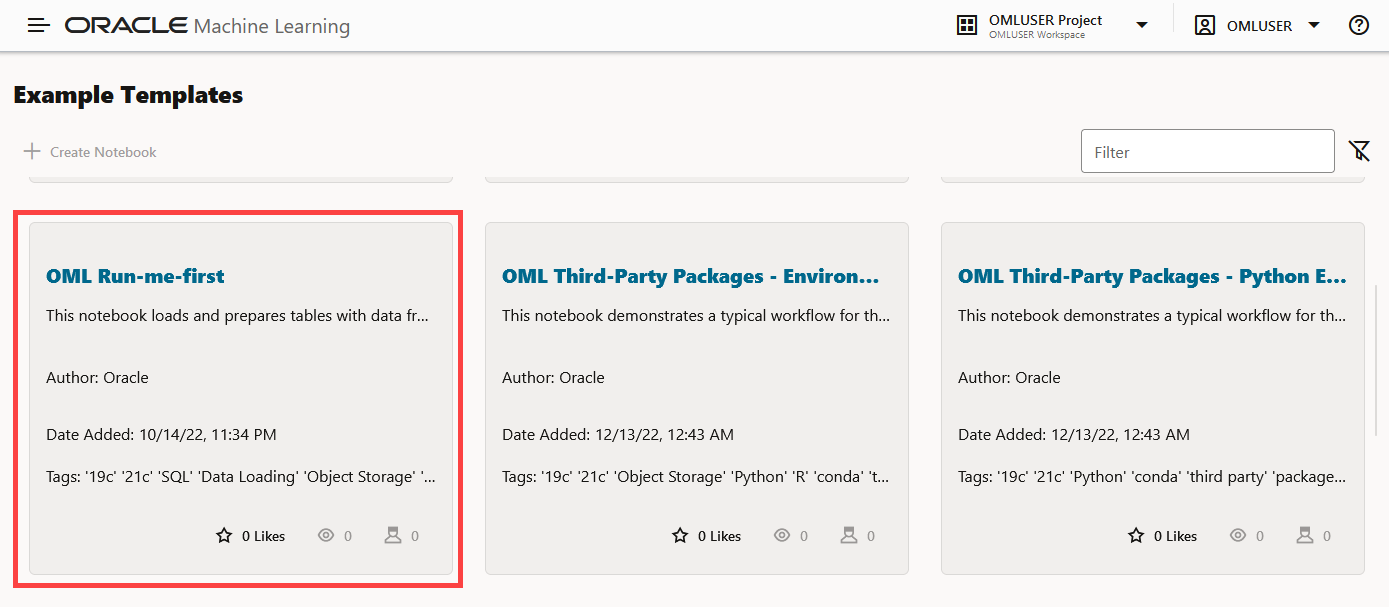
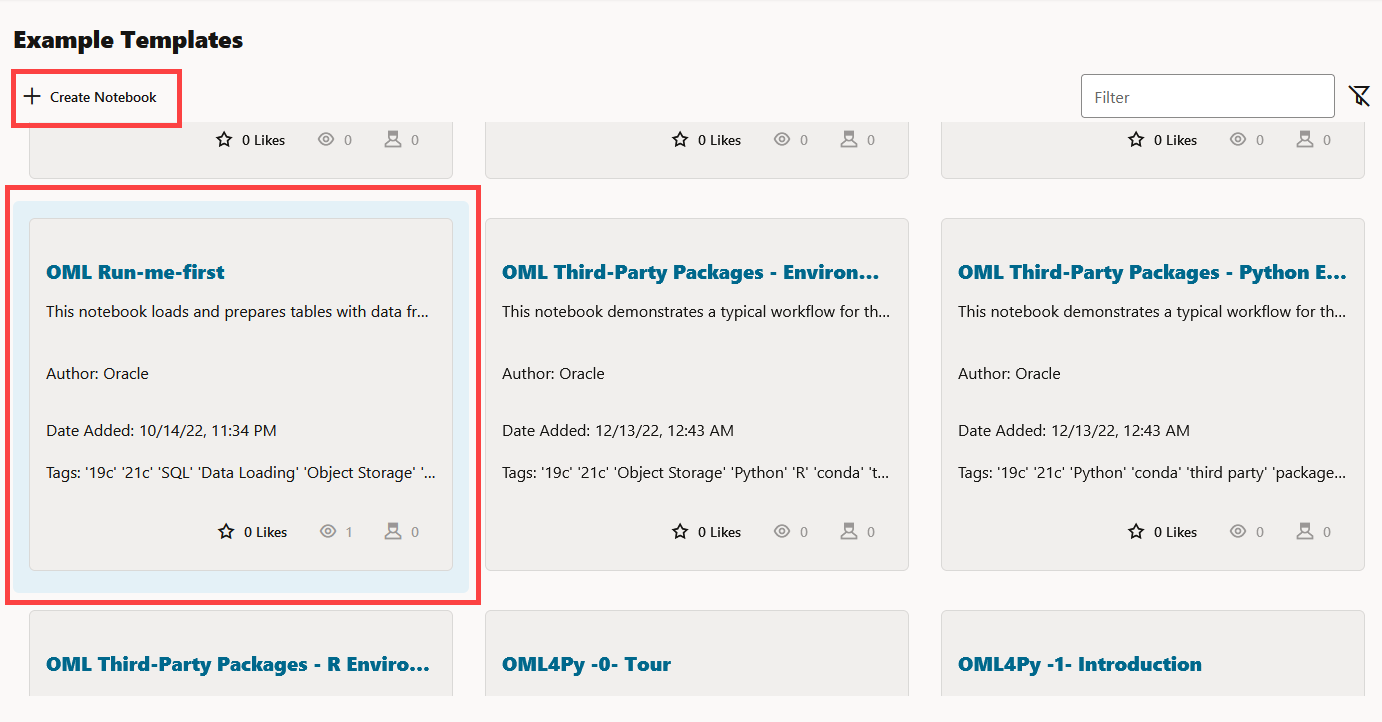
CUSTOMER_INSURANCE_LTV. In this example, we will use the example
template notebook OML-Run-me-first.
Parent topic: Visualize your Data in Oracle Machine Learning Notebooks
4.4.2 Visualize Data in a Bar Chart
A bar chart is a graphical representation of data in rectangular bars. The length or height of the bars, depending on the horizontal or vertical orientation, depict the data set distribution. One axis represents a category, while the other represents values or counts.
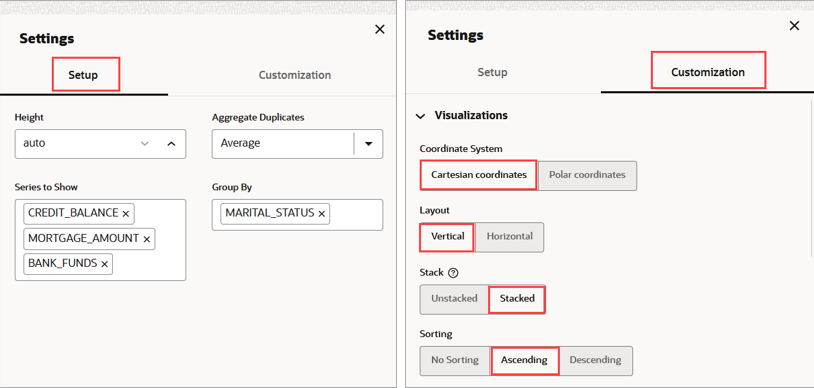
CUSTOMER_INSURANCE_LTV table. The average of
CREDIT_BALANCE, MORTGAGE_AMOUNT, and
BANK_FUNDS are plotted along the Y-axis, and
MARITAL_STATUS is depicted along the X-axis. Here,
CREDIT_BALANCE, MORTGAGE_AMOUNT, and
BANK_FUNDS are stacked in ascending order in each bar for the
groups—SINGLE, MARRIED, DIVORCED,
WIDOWED, and OTHERS.
CUSTOMER_INSURANCE_LTV. In this example, we will use the example
template notebook OML-Run-me-first.
Parent topic: Visualize your Data in Oracle Machine Learning Notebooks
4.4.3 Visualize Data in a Funnel Chart
A funnel chart is a graphical representation that resembles the shape of a funnel where each segment gets progressively narrower. The segments are arranged vertically and depict a hierarchy. Within the funnel chart, each segment corresponds to a step or stage in a sequential process.
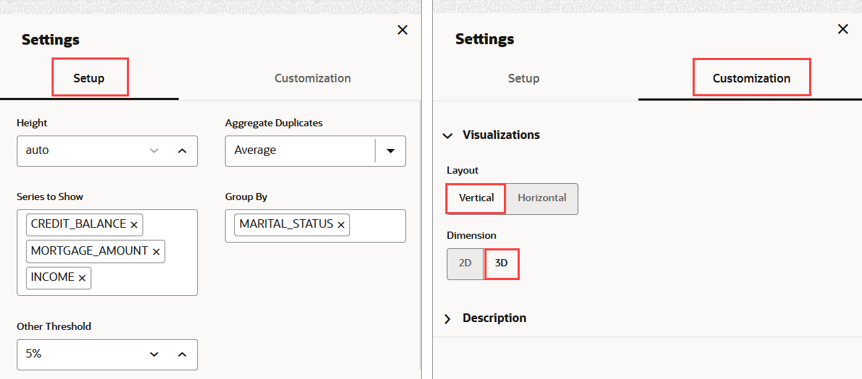
CREDIT_BALANCE,
MORTGAGE_AMOUNT and INCOME are depicted for each of these
groups—SINGLE, MARRIED, DIVORCED, WIDOWED, and OTHERS in three funnel charts. This is the data
visualization after customizing the funnel chart.
CUSTOMER_INSURANCE_LTV. In this example, we will use the example template
notebook OML-Run-me-first.
Parent topic: Visualize your Data in Oracle Machine Learning Notebooks
4.4.4 Visualize Data in a Pyramid Chart
Pyramid charts present your data in a distinctive triangular configuration, horizontally segmented into partitions. Each segment in the pyramid charts represents points or steps in ascending or descending order.
MORTGAGE_AMOUNT and INCOME for the two groups M
(Male) and F (Female). Each pyramid is divided into two segments to represent the two
groups in ascending order.
CUSTOMER_INSURANCE_LTV. In this example, we will use the example
template notebook OML-Run-me-first.
Parent topic: Visualize your Data in Oracle Machine Learning Notebooks
4.4.5 Visualize Data in a Scatter Plot
Scatter plots represent the relationship between two numeric variables in a data set. It represents data points on a two-dimensional plane and show how much one variable is affected by another. The independent variable is plotted on the X-axis, while the dependent variable is plotted on the Y-axis. You can display points by one or more grouping variables such that each group has a distinct color and shape.
CUSTOMER_INSURANCE_LTV table. The scatter plot shows a strong
correlation between INCOME and MORTGAGE_AMOUNT in the
income range 50k to 80k. Along the X-axis, INCOME is plotted and along
the Y-axis, MORTGAGE_AMOUNT is plotted. The data is grouped by
MARITAL_STATUS.
CUSTOMER_INSURANCE_LTV. In this example, we will use the example
template notebook OML-Run-me-first.
Parent topic: Visualize your Data in Oracle Machine Learning Notebooks
4.4.6 Visualize Data in a Line Chart
A line chart is a graphical representation used to display data points connected by straight lines.
SH.SALES table in the SH schema.
Parent topic: Visualize your Data in Oracle Machine Learning Notebooks
4.4.7 Visualize Data in an Area Chart
An area chart uses lines to connect the data points and fills the area below these lines to the x-axis. Each data series contributes to the formation of a distinct shaded region. This emphasizes its contribution to the overall trend. As the data points fluctuate, the shaded areas expand or contract.
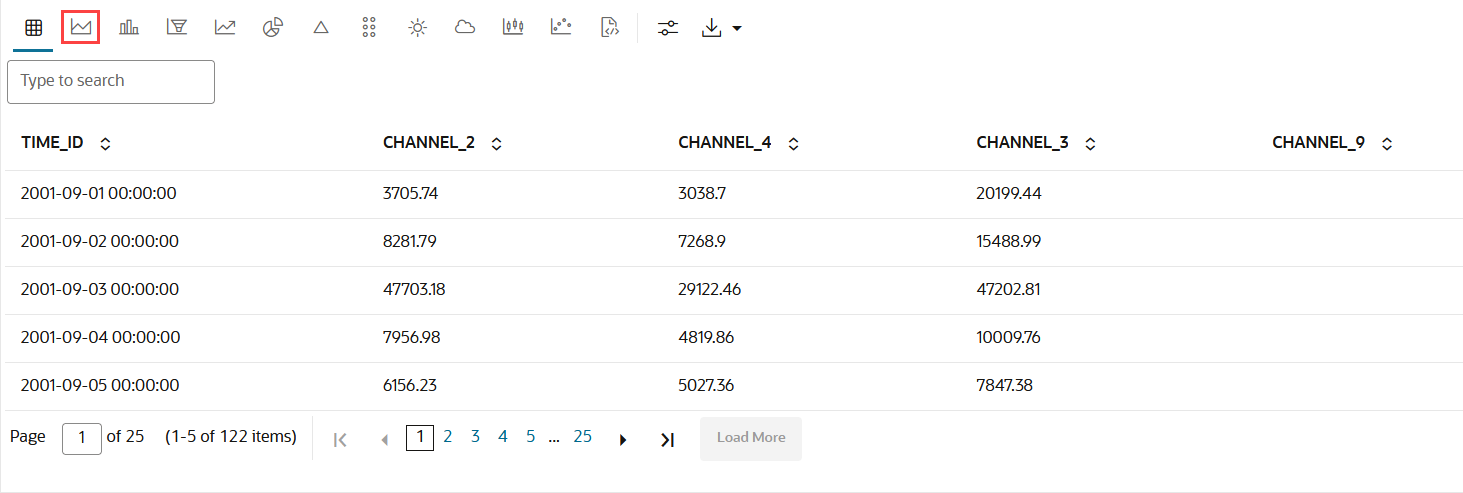
CHANNEL_3,
CHANNEL_4 and CHANNEL_9 in stacks.
Along the X-axis, time is plotted, and along the Y-axis, sum is plotted.
SALES table in the SH schema.
Parent topic: Visualize your Data in Oracle Machine Learning Notebooks
4.4.8 Visualize Data in a Pie Chart
A pie chart is a graphical representation of data in a circular form, with each slice of the circle representing a fraction that is a proportionate part of the whole.
IRIS data set. The IRIS data set contains 3 classes. These
classes are the three different Iris species—Setosa, Versicolor, and Virginica. The data set
has 50 samples each, and four numeric properties about those classes—Sepal Length, Sepal
Width, Petal Length, and Petal Width.
Parent topic: Visualize your Data in Oracle Machine Learning Notebooks
4.4.9 Visualize Data in a Box Plot
A box plot provides an overview of data distributions in numeric data. It provides general information about the symmetry, skewness, variance, and outliers in a dataset. The box plot uses boxes and lines to depict the data distribution.
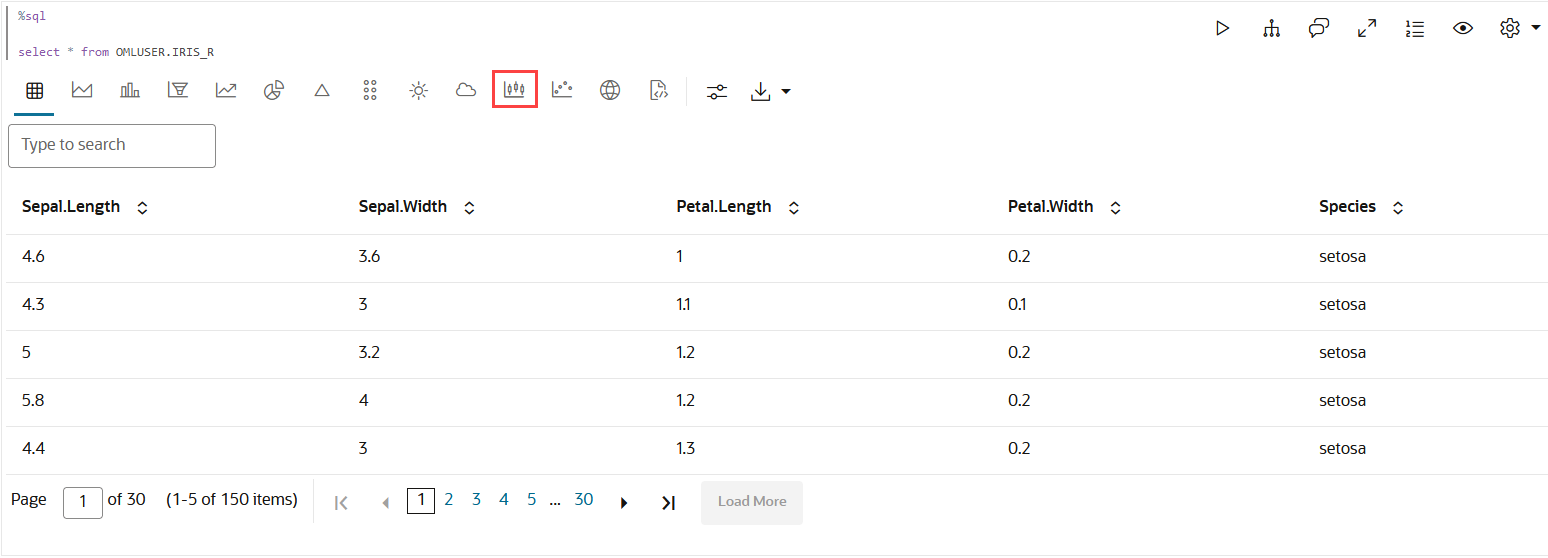
Sepal Length,
Sepal Width,
                                                Petal Length,
and
Petal Width) of the three species of the iris
flower— Setosa, Versicolor, and Virginica. The basic box plot (Box plot 1)
shows the numeric distribution of the 3 species Setosa, Versicolor, and
Virginica. This box plot has been customized to display the outlier value
for each of the three species. In this image, the cursor is over the outlier
dot for the class Virginica. It highlights the outlier
value at 4.9 for the sepal length of Virginica. This implies that in the
species Virginica, there are sepals whose length is significantly below the
lower count 5.6.
- Central Box: Inter-quartile
range and quartiles:
- Q1 (First Quartile): This is the value below which 25% of the data falls. It represents the boundary between the lowest 25% and highest 75% of values.
- Q3 (Third Quartile): This represents the value below which 75% of the data falls, serving as a border between the lowest 75% and highest 25% of values.
- Interquartile Range (IQR): The IQR is the range in which the central 50% of the values fall. IQR = Q3 - Q1
- Whiskers: The whiskers of the box plot extend from the central box to the minimum and maximum data values that are not considered outliers. They provide a graphical representation of the majority of the data distribution.
- Outliers:Outliers are data points that deviate significantly from other data points, typically due to data variability or errors. An outlier is plotted as a dot beyond the ends of the whiskers of a box plot.
- Median: The median is the value that divides the dataset into two halves, with 50% of the values falling below it and 50% falling above it. In the box plot, a line or a mark inside the central frame represents the median.
IRIS dataset. The IRIS dataset contains 3
classes, the three different Iris species—Setosa, Versicolor, and Virginica,
along with 50 samples each, and four numeric properties about those classes:
Sepal Length, Sepal Width, Petal Length, and Petal Width.
Parent topic: Visualize your Data in Oracle Machine Learning Notebooks
4.4.10 Visualize your Data in a Sunburst Chart
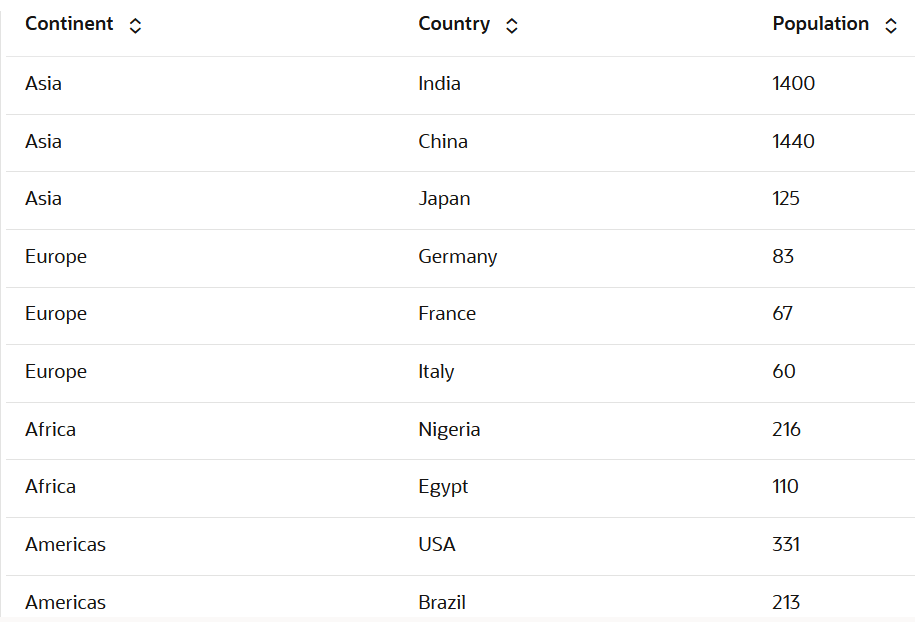
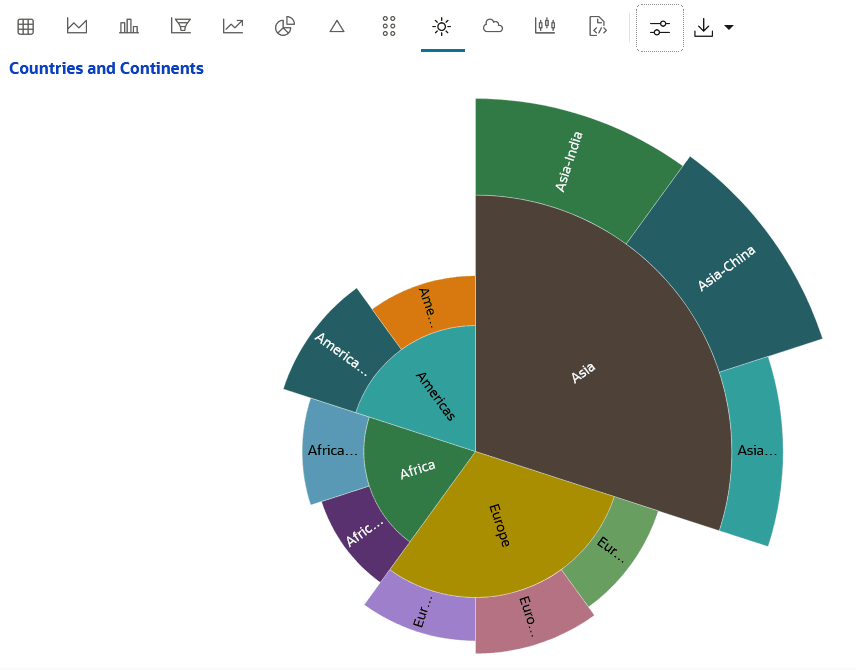
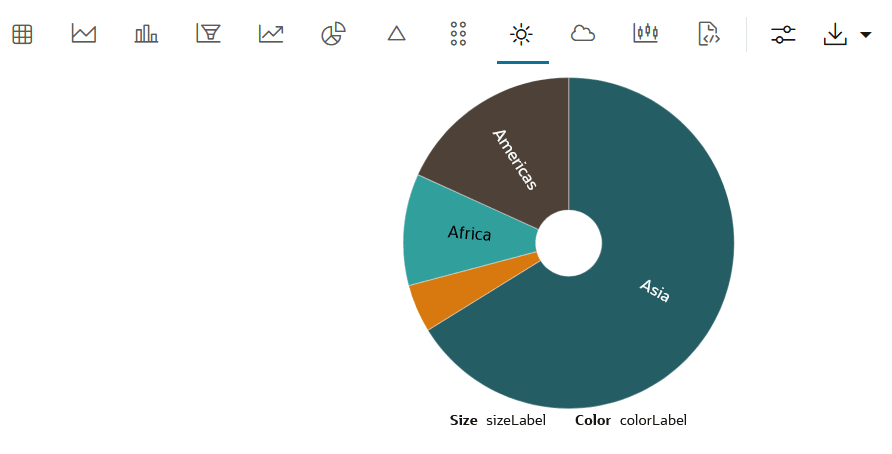
The sunburst chart is typically used to visualize hierarchical data structures - with part-to-whole relationships in data depicted additionally.
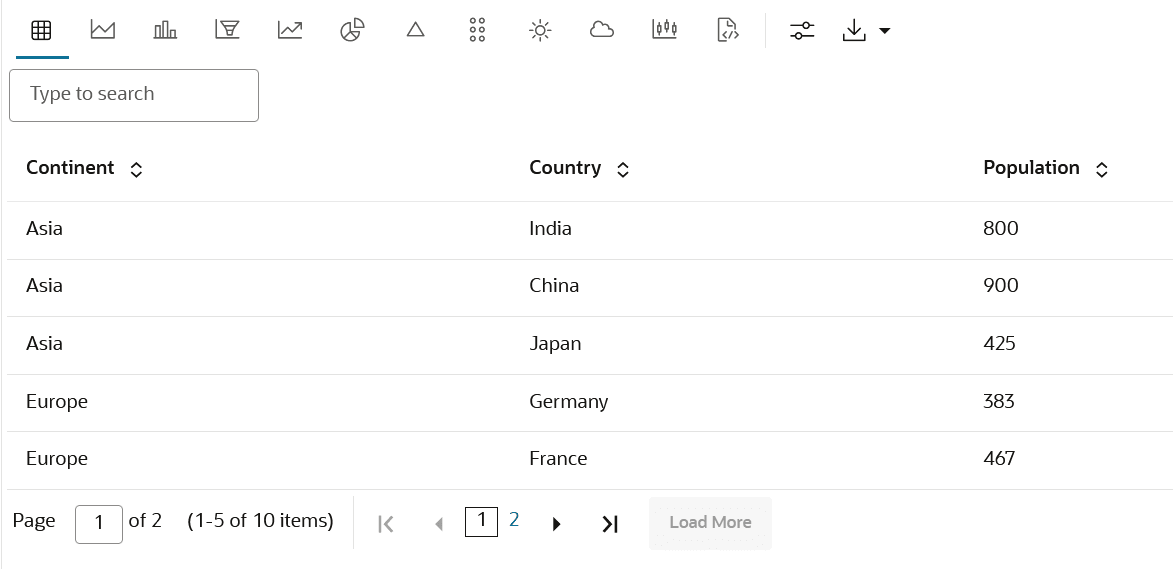
Population column.
Parent topic: Visualize your Data in Oracle Machine Learning Notebooks
4.4.11 Visualize your Data in a Tag Cloud
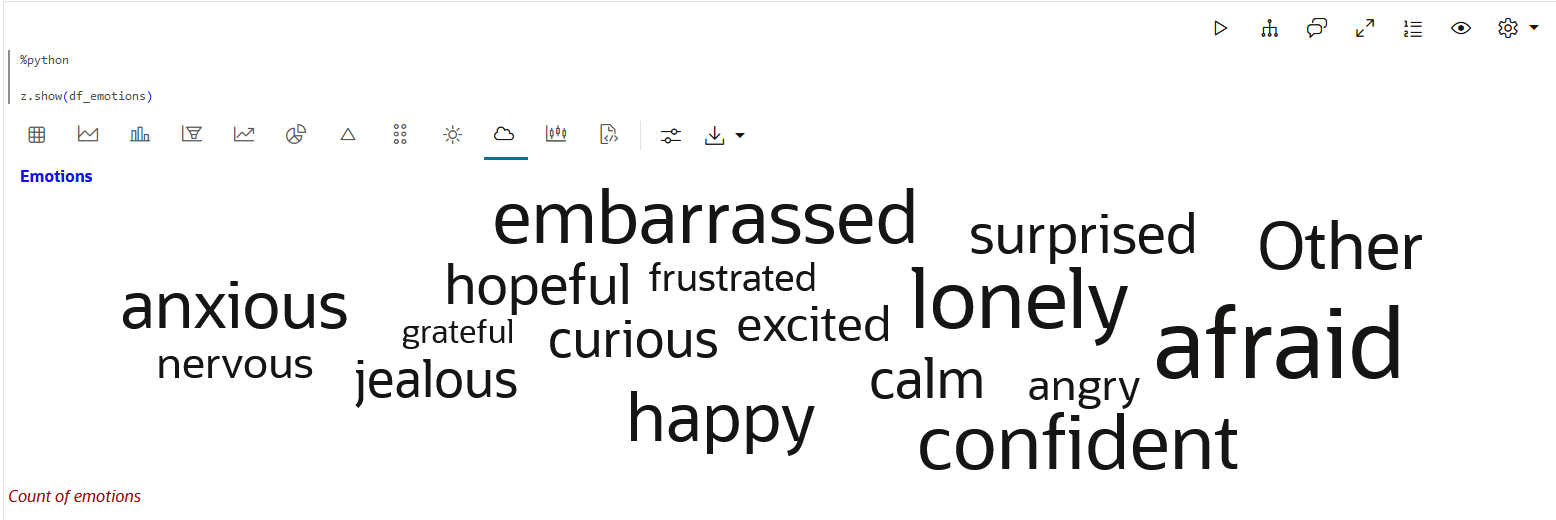
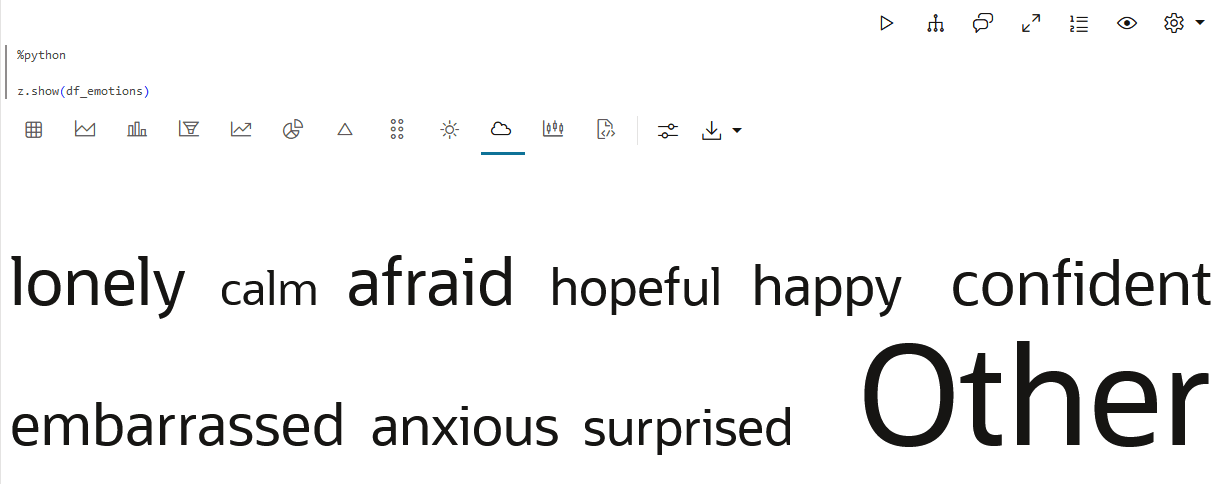
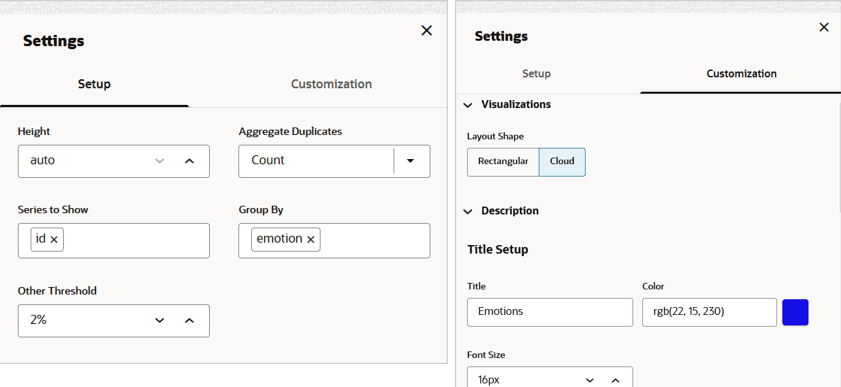
A tag cloud is a visual representation of the most popular words or tags found in free-form text. The font size or the color of the text represents the frequency of occurrence.
Parent topic: Visualize your Data in Oracle Machine Learning Notebooks
4.4.12 Visualize your Data in a Treemap
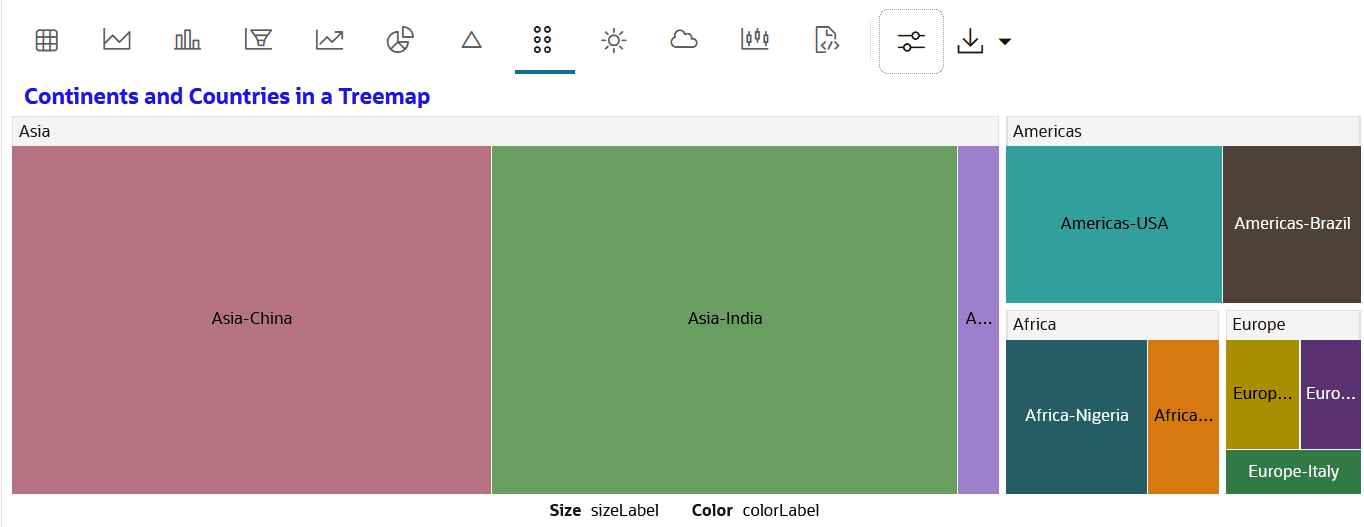
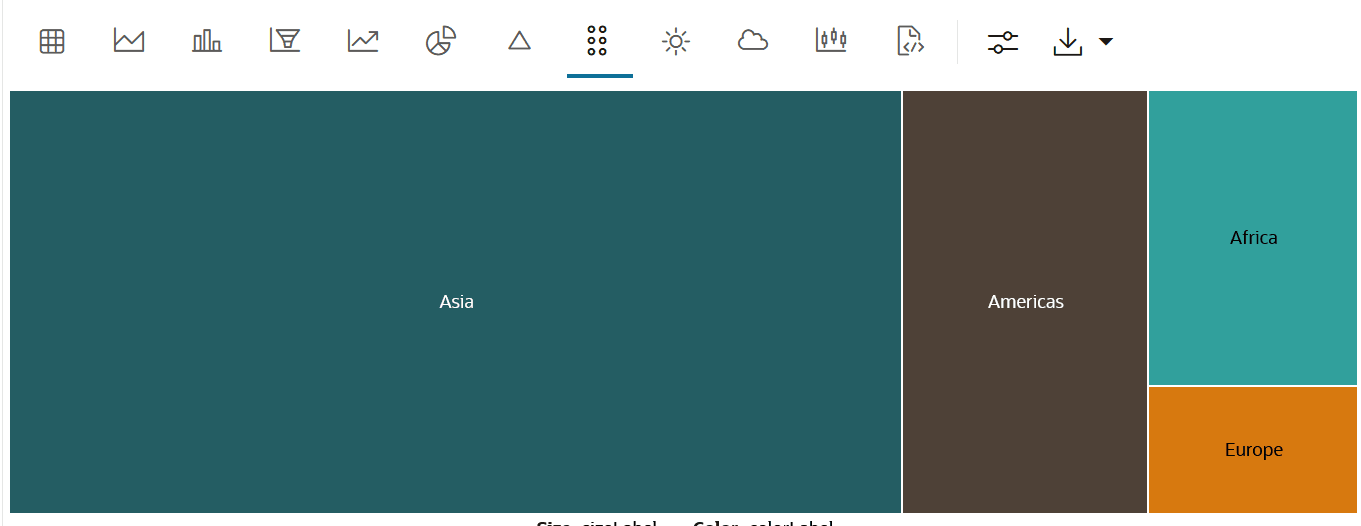
A treemap is a visualization composed of nested rectangles, that represent certain categories within a selected dimension and are ordered in a hierarchy, or “tree.” Quantities and patterns can be compared and displayed in a limited chart space.
Parent topic: Visualize your Data in Oracle Machine Learning Notebooks
4.4.13 Visualize Data in a Map
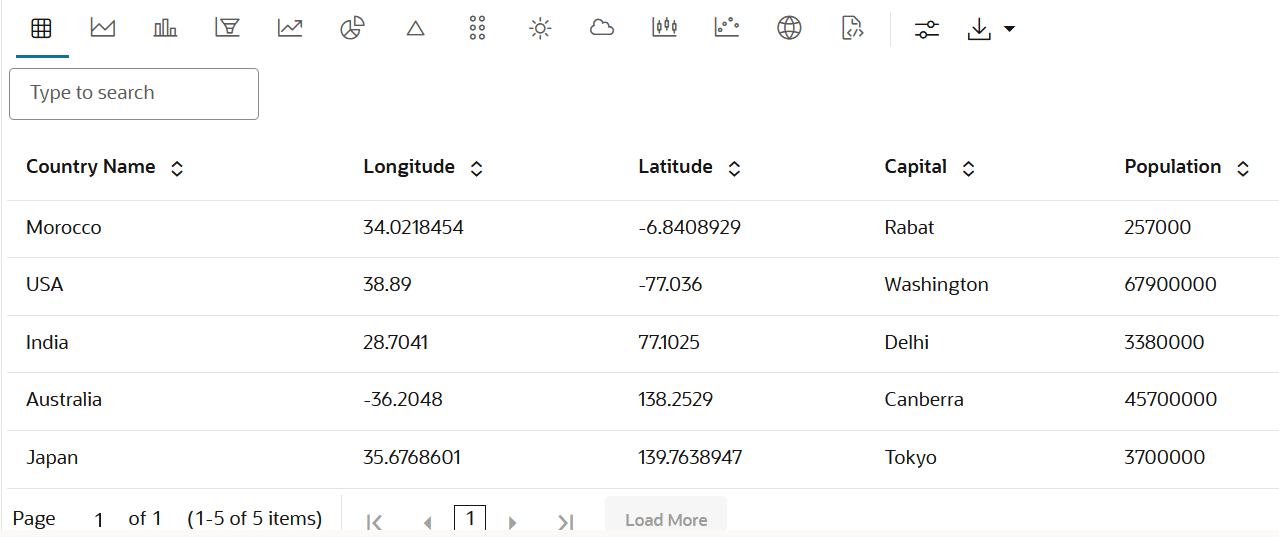
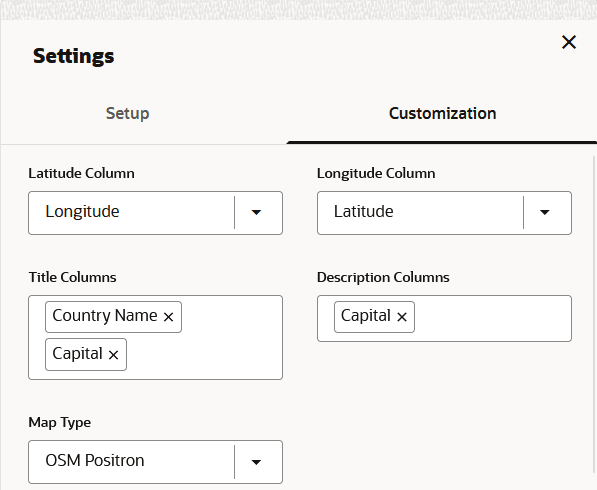
The map visualization of OML Notebooks plots data points on a geographical map. For visualizing your data in a map in OML Notebooks, your data must contain explicit latitude and longitude values of locations to correctly position data on the map.
Parent topic: Visualize your Data in Oracle Machine Learning Notebooks













 and on the