4.5.1 Visualize Data in a Table

A table is an arrangement of information or data in rows and columns. Using the Oracle Machine Learning Notebooks, you can create database tables, and also view the information in a tabular format.

Dataset: CUSTOMER_INSURANCE_LTV. In this example, we will use the example template notebook OML-Run-me-first.
To visualize data in a table:
  1. On the Oracle Machine Learning UI homepage, click Examples. Or, open the left navigation menu by clicking the Cloud menu icon click Cloud menu icon on the top left corner of the page. Click Templates and then click Examples.
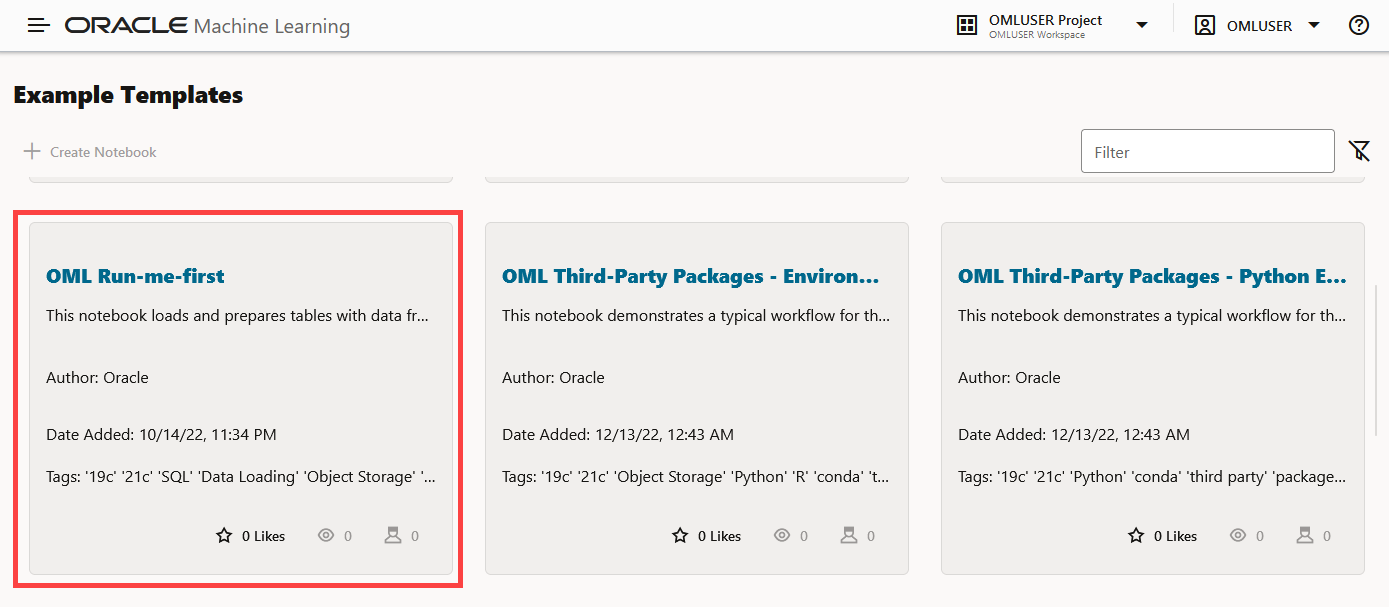
  2. The OML-Run-Me-First example template is listed. If you are unable to view it, type the name in the Filter field.

    Figure 4-8 OML Run-me-first Example Template


    Run me first Example Template

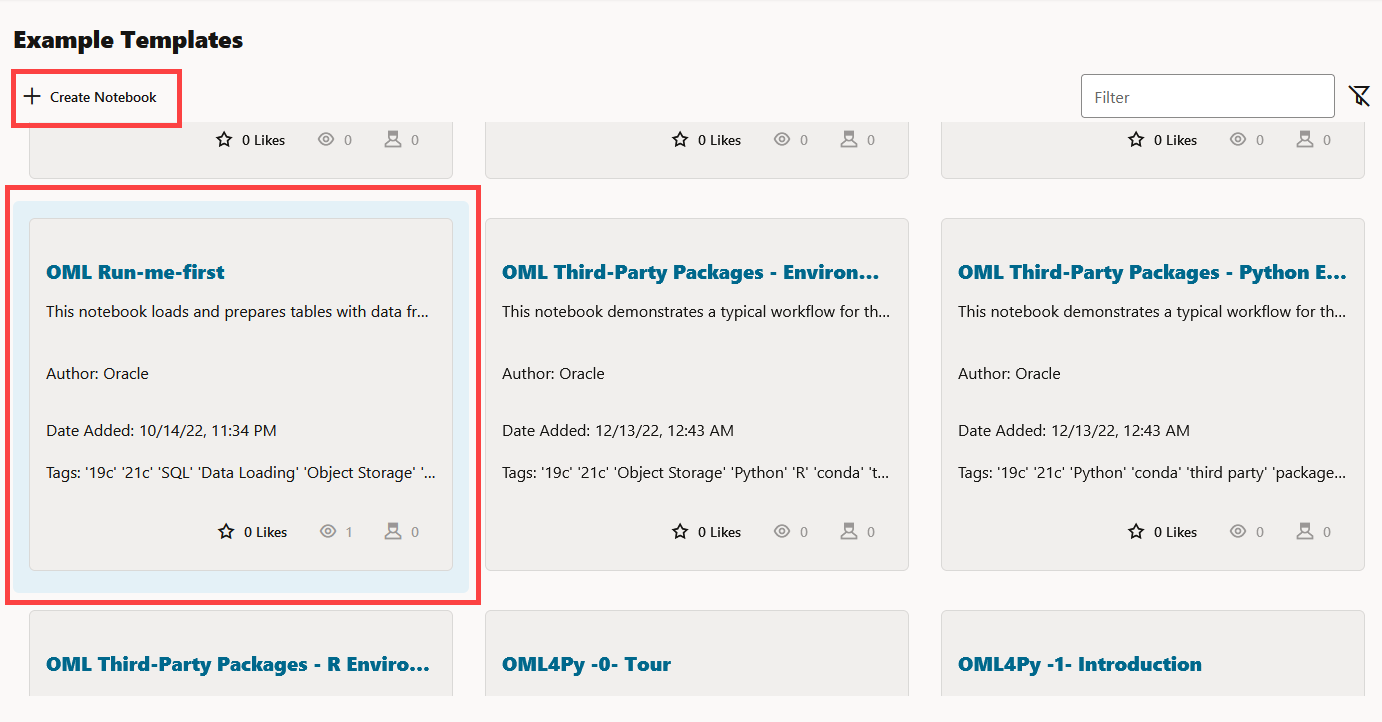
  3. Click on the OML Run-me-first tile (and not on the name) to highlight it in blue. Then click the Create Notebook icon.

    Figure 4-9 Create option on the Example Template page


    Create option on the Example Template page

  4. In the Create Notebook Dialog, click OK.
  5. Click Open Notebook in the confirmation dialog to open the notebook.
  6. Click the Run Paragraphs icon in the notebook to run all the paragraphs. This will also create the CUSTOMER_INSURANCE_LTV table. Click Confirm in the Confirmation dialog.
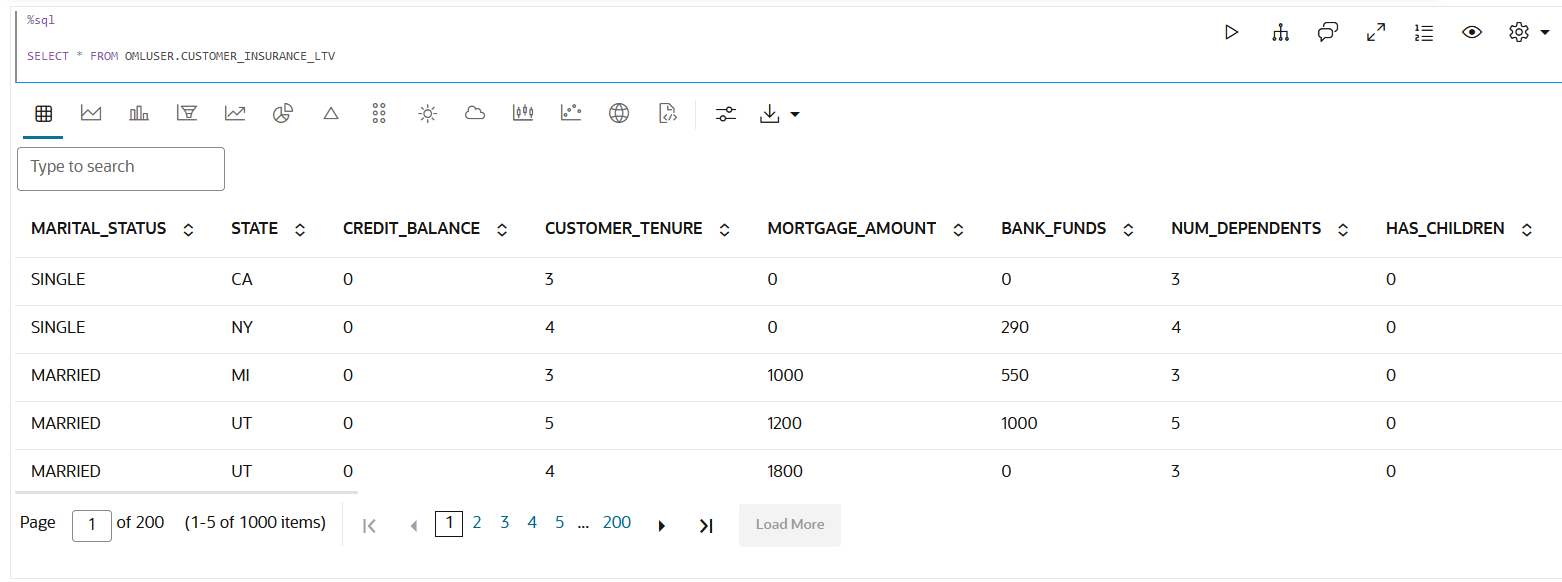
  7. To view the data in a table format, run the following script in a SQL paragraph:
    %sql
    
    SELECT * FROM OMLUSER.CUSTOMER_INSURANCE_LTV
    The script presents the data in a tabular format as shown in the screenshot:

    Figure 4-10 View the CUSTOMER_INSURANCE_LTV table


    View the CUSTOMER_INSURANCE_LTV table

  8. In this table, you can customize your views and settings.
    • Sort the columns in ascending or descending order: Click on the down arrow or up arrow against the columns to sort the data in ascending or descending order.

      Figure 4-11 Sort table columns


      Sort table columns

    • Use the horizontal scroll bar to scroll horizontally to view the columns on the right.
    • Filter specific search terms. In the Search field, type the entry or term that you are looking for. In this example, the term Single is entered. All the rows that contain the term SINGLE in the column MARITAL_STATUS are filtered for display.

      Figure 4-12 Filtering table columns by keywords


      Filter columns by key words

      Note:

      Rows that do not contain this term are hidden from the view and the remaining rows highlight the location of the search term within the row.
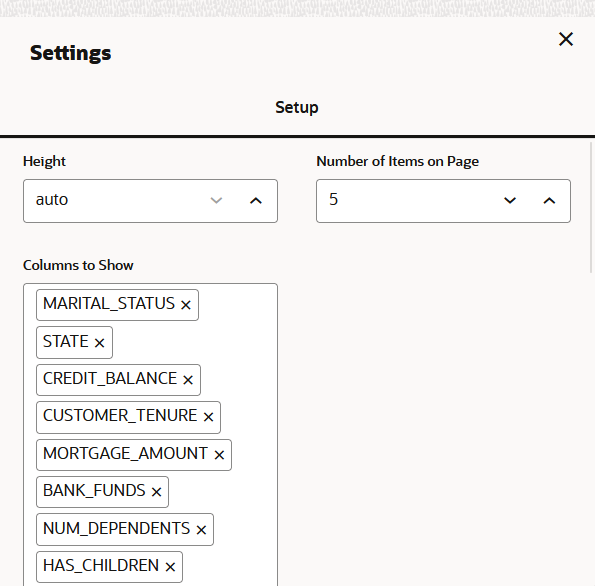
  9. By default, 5 rows are displayed. If you want to view more rows or customize the table settings, click on the Settings icon to open the Settings dialog. Here, you can edit the following:

    Figure 4-13 Settings dialog


    Settings dialog

    • Height: This parameter changes the height of the visualization. Click on the up or down arrow to increase or decrease the visualization height.
    • Number of Items on Page: Click on the up or down arrow, as applicable, to set the number of rows to be displayed on the page. By default, 5 rows are displayed.
    Columns to Display: By default, all the columns are listed. If you want to remove any column from displaying, click on the X in the column name. To view the column again, click inside the Columns to Show field. The hidden columns are displayed. Click on the column that you want to view again. In this example the column MARITAL_STATUS was removed. Clicking on the Columns to Show field displays it. Click on it to include in the display.
This completes the task of creating a table, and visualizing the data in it.