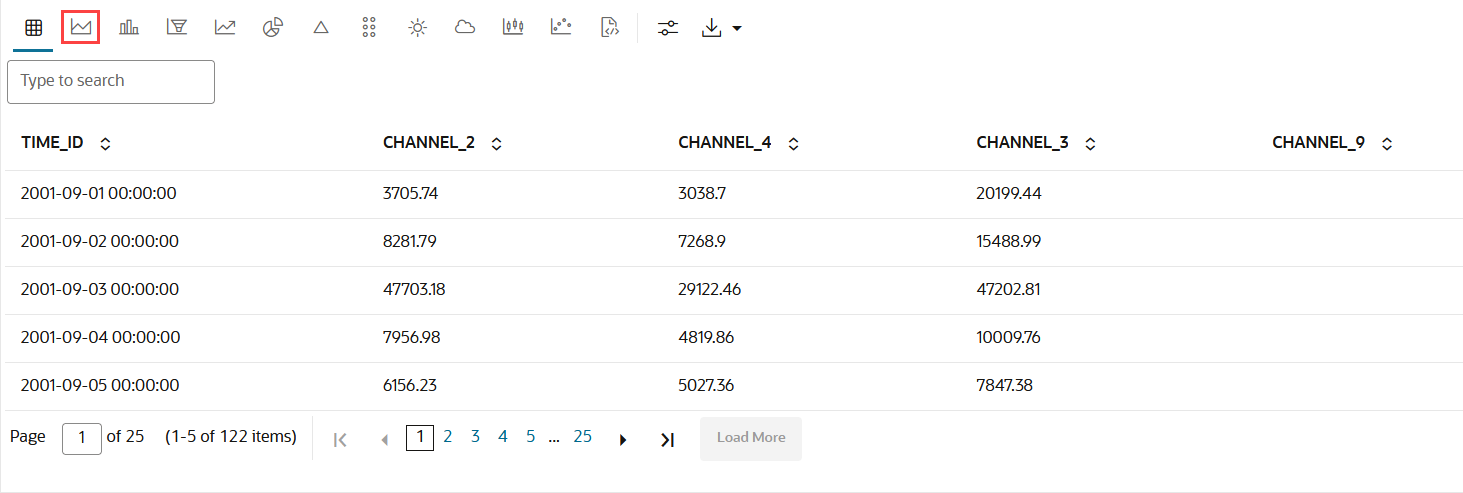
4.5.7 Visualize Data in an Area Chart
An area chart uses lines to connect the data points and fills the area below these lines to the x-axis. Each data series contributes to the formation of a distinct shaded region. This emphasizes its contribution to the overall trend. As the data points fluctuate, the shaded areas expand or contract.
When to use this chart: Use this chart
to visualize trends, changes, and relationships in data over a continuous
period.
Data set:
SH.SALES table in the SH schema.
To visualize data in an area chart:
This completes the task of visualizaing your data in an area chart.
Parent topic: Visualize your Data in Oracle Machine Learning Notebooks


