Using the Queue and Processor Details Portlet in SuiteCloud Processors Monitor
You can use the Queue and Processor Details portlet to see how jobs handled by scheduling queues differ from those handled by SuiteCloud Processors.
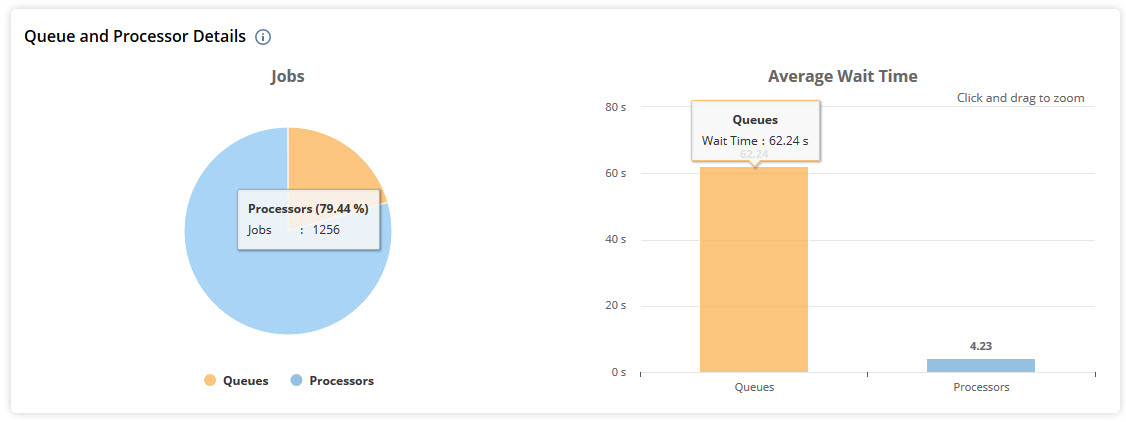
You'll find these charts in the Queue and Processor Details portlet:
-
Jobs - This pie chart shows how requests are split between scheduling queues and processors.
-
Average Wait Time - This bar chart compares the average wait time for jobs handled by scheduling queues versus processors. For map/reduce scripts, it only uses data from the getInputData stage.
Related Topics
- Using the SuiteCloud Processors Monitor Dashboard
- Setting the Date Range in SuiteCloud Processors Monitor
- Using the Overview Portlet in SuiteCloud Processors Monitor
- Using the Processor Settings Portlet in SuiteCloud Processors Monitor
- Using the Wait Time by Priority Portlet in SuiteCloud Processors Monitor
- Using the Elevated Priority Portlet in SuiteCloud Processors Monitor
- Using the Processor Utilization Portlet in SuiteCloud Processors Monitor
- Using the Job Status Portlet in SuiteCloud Processors Monitor
- Using the Processor Concurrency Portlet in SuiteCloud Processors Monitor