Using the Overview Portlet in SuiteCloud Processors Monitor
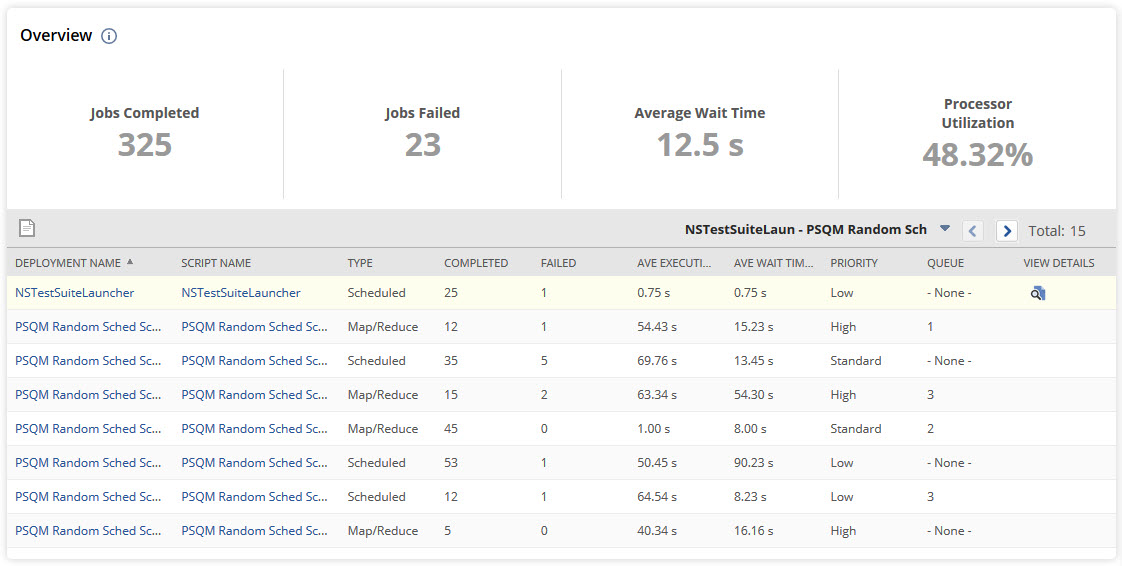
You can use the Overview portlet in SuiteCloud Processors Monitor to quickly check stats and details about your deployments. The portlet gives you a summary of key processor stats and a detailed table for your scheduled and map/reduce scripts.
The Overview portlet only logs jobs that ran long enough to help you troubleshoot issues. SuiteCloud Processors Monitor doesn't track every job your account runs.
The summary includes the following statistics:
-
Jobs Completed - Shows the total number of jobs finished in the time range.
-
Jobs Failed - Shows the total number of jobs that failed during that time.
-
Average Wait Time - Shows the average wait time for all jobs finished during that time.
-
Processor Utilization - Shows how much of the total processing time was used to finish jobs during that time.
You'll find these details in the table right after the summary:
-
Deployment name - Shows the name you gave the deployment record.
-
Script name - Shows the name you gave the script record.
-
Type - Shows if the deployment is map/reduce or scheduled.
-
Completed - Shows how many scripts were completed.
-
Failed - Shows how many scripts failed.
-
Average execution time - Shows the average time (in seconds) to run the job.
-
Average wait time - Shows the average wait before scripts started running.
-
Priority - Shows the priority level, so you know which jobs run first.
-
Queue - Shows the assigned queue for scheduled deployments still using queues. For SuiteCloud processor deployments, it shows -None-.
-
View details - Lets you click the icon to open SuiteCloud Processors Job Details in a new page.
You can't sort script jobs by the Completed, Failed, Average Execution Time, or Average Waiting Time columns since these are summary formula columns.
Related Topics
- Using the SuiteCloud Processors Monitor Dashboard
- Setting the Date Range in SuiteCloud Processors Monitor
- Using the Processor Settings Portlet in SuiteCloud Processors Monitor
- Using the Wait Time by Priority Portlet in SuiteCloud Processors Monitor
- Using the Elevated Priority Portlet in SuiteCloud Processors Monitor
- Using the Processor Utilization Portlet in SuiteCloud Processors Monitor
- Using the Job Status Portlet in SuiteCloud Processors Monitor
- Using the Processor Concurrency Portlet in SuiteCloud Processors Monitor
- Using the Queue and Processor Details Portlet in SuiteCloud Processors Monitor