Using the Processor Utilization Portlet in SuiteCloud Processors Monitor
You can use the Processor Utilization portlet to see how much your SuiteCloud Processors are being used.
You can also look at historical data for the date range you pick and see which settings help you get the best utilization.
You can view the following charts on the Processor Utilization portlet:
-
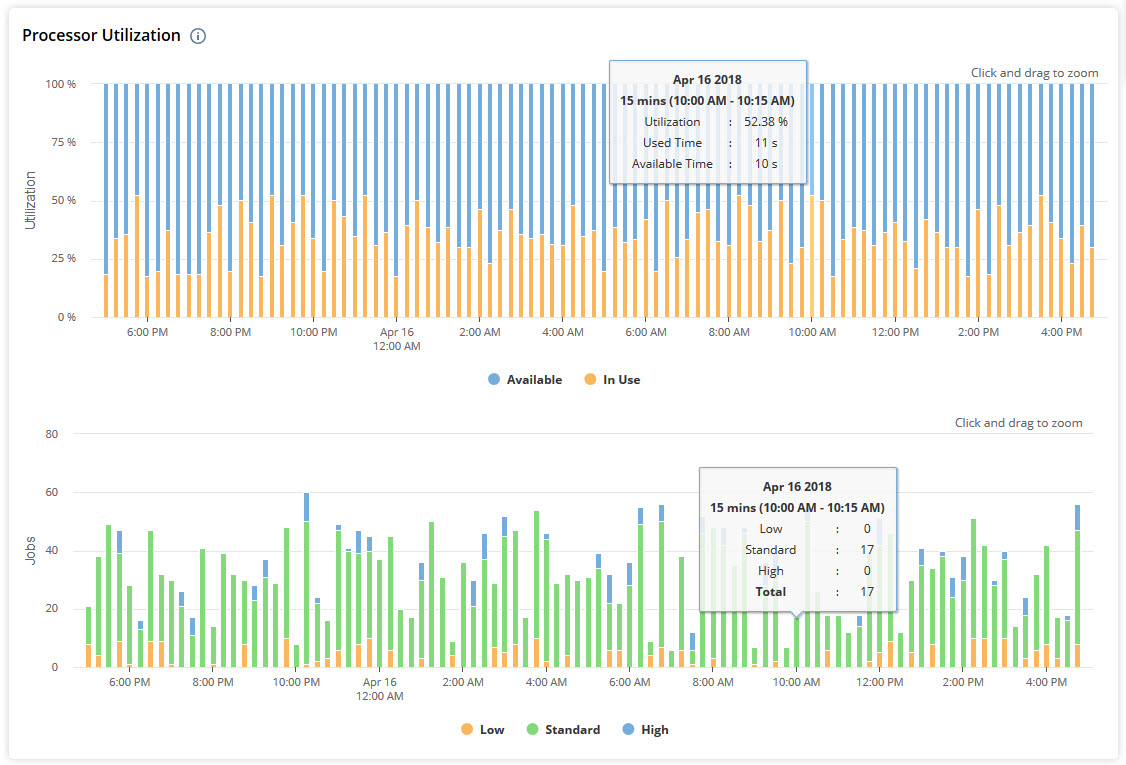
Utilization - This bar chart shows how much time your processors were used compared to the total available time in each interval.
The following table shows how to calculate available time and processor utilization:
Field
Formula
Available Time
Resolution (in seconds) × Number of SuiteCloud Processors
Processor Utilization
(Utilized Time / Available Time) × 100%
For more information about date ranges and resolutions, read Setting the Date Range in SuiteCloud Processors Monitor.
-
Jobs - This stacked bar chart shows the total number of jobs by priority level.
When you hover over any part of either chart, the counts for that interval show up on both charts. This helps you see how the number of jobs affects processor utilization.
Related Topics
- Using the SuiteCloud Processors Monitor Dashboard
- Setting the Date Range in SuiteCloud Processors Monitor
- Using the Overview Portlet in SuiteCloud Processors Monitor
- Using the Processor Settings Portlet in SuiteCloud Processors Monitor
- Using the Wait Time by Priority Portlet in SuiteCloud Processors Monitor
- Using the Elevated Priority Portlet in SuiteCloud Processors Monitor
- Using the Job Status Portlet in SuiteCloud Processors Monitor
- Using the Processor Concurrency Portlet in SuiteCloud Processors Monitor
- Using the Queue and Processor Details Portlet in SuiteCloud Processors Monitor