Using the Wait Time by Priority Portlet in SuiteCloud Processors Monitor
You can use the Wait Time by Priority portlet to see separate charts for wait times and job counts at each priority level.
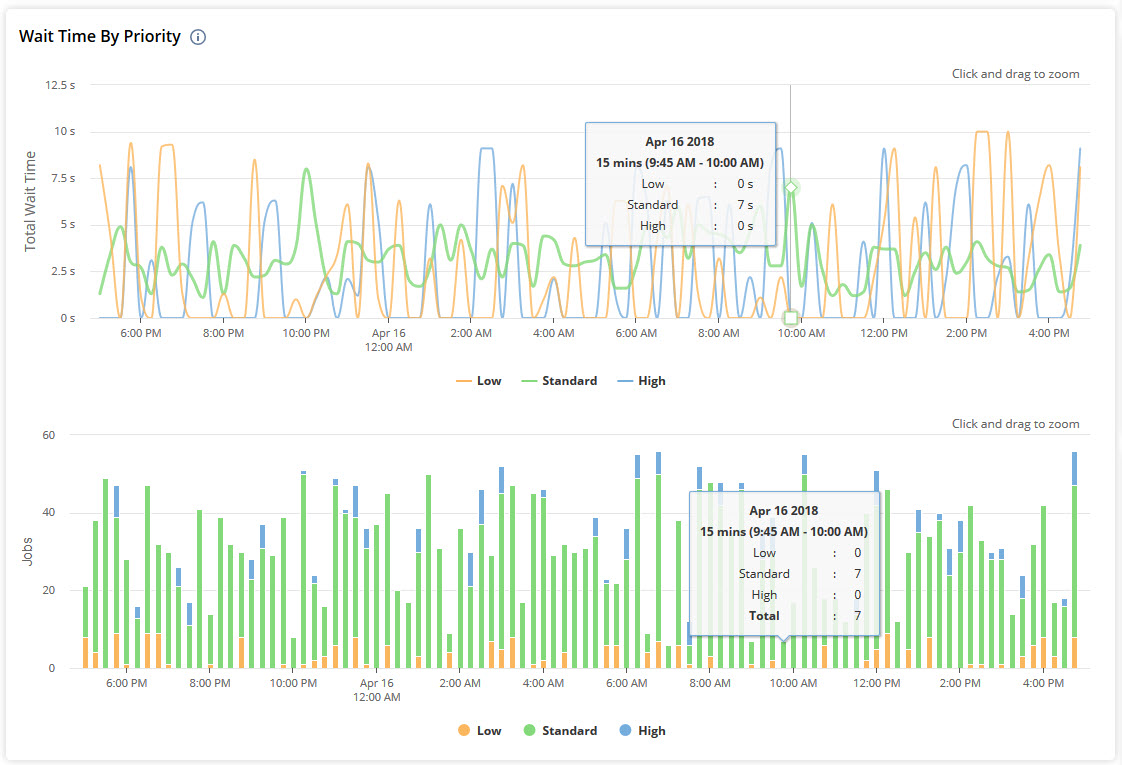
The Wait Time by Priority portlet includes the following charts:
-
Total Wait Time - This line chart shows how long it took to finish jobs in the selected time and priority level.
-
Jobs - This stacked bar chart shows the total number of jobs in the selected time and how they're split by priority.
When you hover over any part of either chart, you'll see the counts for that interval on both charts. This helps you spot how job counts and priority levels affect total wait time.
Related Topics
- Using the SuiteCloud Processors Monitor Dashboard
- Setting the Date Range in SuiteCloud Processors Monitor
- Using the Overview Portlet in SuiteCloud Processors Monitor
- Using the Processor Settings Portlet in SuiteCloud Processors Monitor
- Using the Elevated Priority Portlet in SuiteCloud Processors Monitor
- Using the Processor Utilization Portlet in SuiteCloud Processors Monitor
- Using the Job Status Portlet in SuiteCloud Processors Monitor
- Using the Processor Concurrency Portlet in SuiteCloud Processors Monitor
- Using the Queue and Processor Details Portlet in SuiteCloud Processors Monitor