Logs
Script logs are the primary means for Testing and Debugging a script and for monitoring the health of a deployed script. Any errors that occur during run time are written to the script log.
Scripts can write to the log using the NSOA.meta.log(severity, message) and NSOA.meta.alert(message) functions. Detailed SOAP API request and response messages can also be logged by calling the NSOA.wsapi.enableLog( [ flag] ) function from within a script.
Each log entry contains the following information:
-
Severity - The supplied severity: "Fatal", "Error", "Warning", "Info", "Debug", or "Trace".
-
Timestamp - The time the message was logged.
-
Generated by - For example, whether the message was generated by your script or by SuiteProjects Pro.
-
Message - The full message text.
Note:SuiteProjects Pro adds a log entry when one of the following script properties is changed, with an indication of what was changed: Source code, Event, Entrance function, Deployed status, Employee.
-
User - The user who triggered the script.
-
Internal ID - The internal ID of the log message. Sorting log entries by their Internal ID may be useful for debugging scripts when multiple log messages are recorded in the same second and you need to know the order the messages were recorded in.
If you load the script into an Editor you can quickly find the line number reported in the log message, see Testing Form Scripts.
View Log
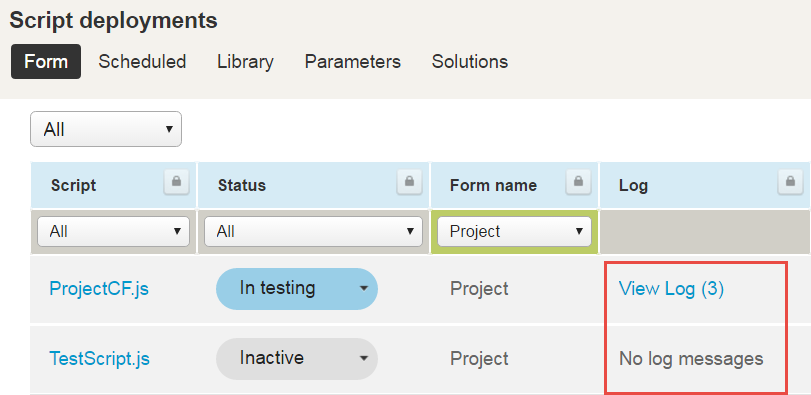
You can view any log messages a script has generated by clicking the "View Log" link from the Scripting Center and Scripting Studio, see also Reporting.
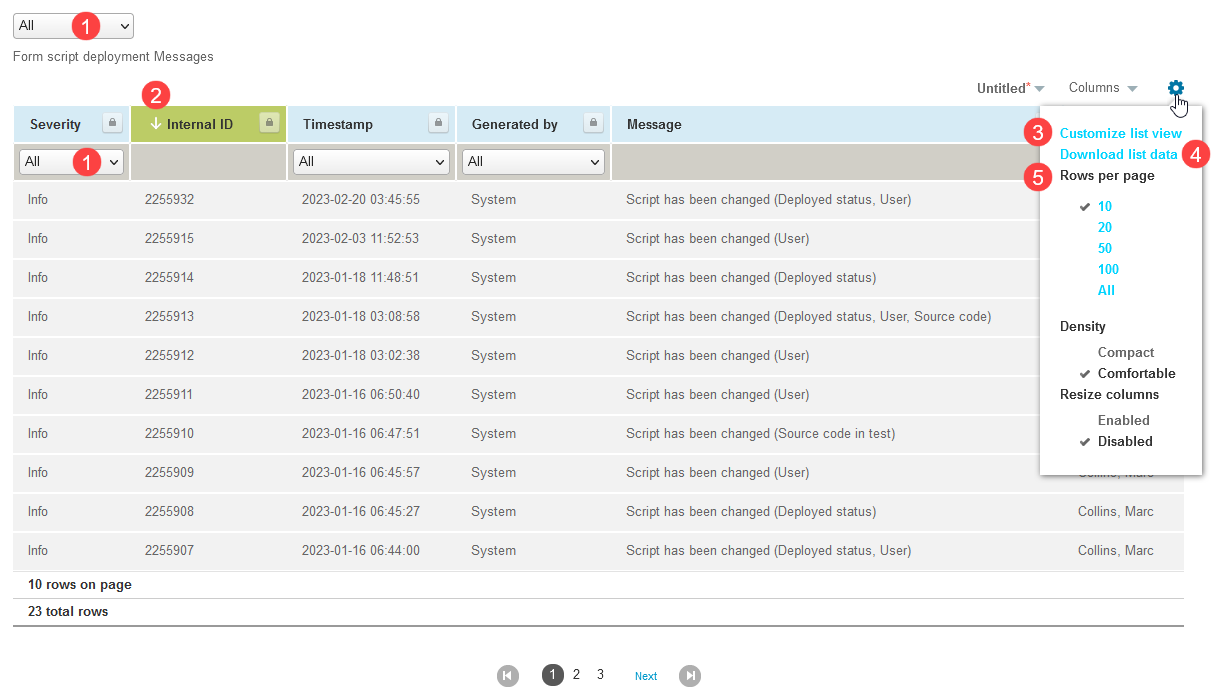
The log view has the following standard SuiteProjects Pro features:
-
Filter log entries
-
Sort log entries
-
Customize list
-
Download list data as a CSV, HTML, and PDF formatted file
-
Set the number of rows displayed on a page
Errors generated by a library are reported into the calling form or scheduled script. Libraries do not have separate logs.
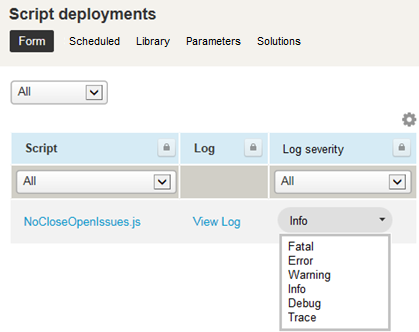
Administrators can control the messages that are written to deployed scripts by setting the Log Severity for the script.
You can see how many log entries are part of a log without having to open each log with the 'Display the number of logs at 'View logs' link' feature. This feature shows a count of log entries as part of the "View Log" link for Form and Scheduled Script Deployments.
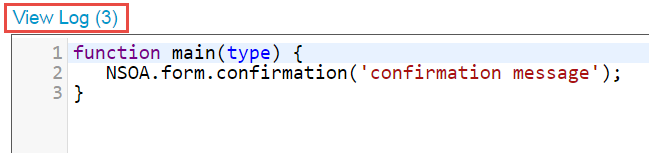
The number of logs also appears next to the "View Log" link in the Scripting Editor.
To use this feature, go to the User Menu > Personal settings > Scripting Studio Options and select the "Display the number of logs at 'View logs' link" option.
Log Severity
Script logs recognize the following severities: "Fatal", "Error", "Warning", "Info", "Debug", or "Trace".
If a severity is used that the log system does not recognize then it is written as an "Info" severity.
The NSOA.meta.log(severity, message) function takes two parameters, the first is severity and the second is the message to log. The NSOA.meta.alert(message) function takes a message parameter and writes "Info" severity message.
Severity is case insensitive so the following calls are all treated as the same:
            NSOA.meta.log('debug',"message");
NSOA.meta.log('Debug',"message");
NSOA.meta.log('DEBUG',"message");
The following are also treated as the same:
            NSOA.meta.log('myseverity',"message");
NSOA.meta.log('Info',"message");
This is the same as calling:
NSOA.meta.alert("message");
If you trigger a script that is either "In testing" (or "Active revising" and you are signed in as the test user) then ALL log messages are logged.
If you trigger a script that is "Active" (or "Active revising" and you are not signed in as the test user) then the log messages written are controlled by the Log severity set for the script in the Scripting Center.
Non-deployed scripts log all messages but deployed scripts log messages according to the Log severity setting.
Calls to NSOA.meta.log(severity, message) with the severity parameter set to "Debug" or "Trace" do not consume units but are limited to a maximum of 1000 per script.
The default Log severity level for deployed scripts is "Error". This means that only "Error' and "Fatal" severities are written to log. In this case "Trace", "Debug", 'Info', and 'Warning' messages are simply ignored.
Administrators can set the Log severity level for deployed scripts.
"Fatal" and system generated messages are ALWAYS logged! A system Info message is written to the log when the log severity is changed.
You can set the log severity to "Warning" or "Error" to save space and improve system performance for scripts that are operating correctly and generating log information that you are sure you don't need.
You can set the log severity of a deployed script to "Debug" to track down errors that only occur for a deployed script.
See Scripting Return Codes for more details.
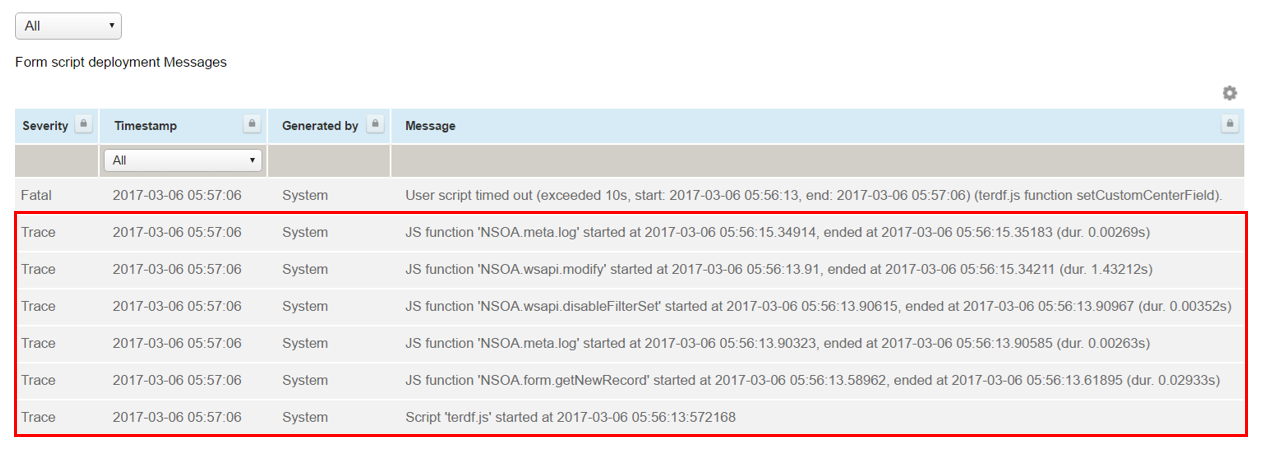
Trace Level Logs
Fatal "User script timed out" log messages are followed by "Trace" log messages which break down the time used in the script to assist you in identifying the root cause of the time out. The log messages indicate the time taken by each function call in the script.
Clear Log Entries for a Specific Script
You can clear all log entries for a specific script from the Scripting Center.
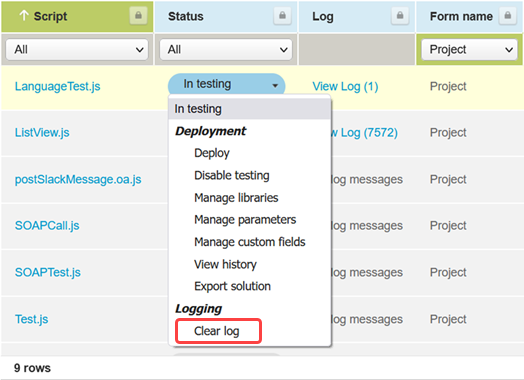
To clear log entries for a script
-
Go to Administration > Scripting Center.
-
Click the status dropdown for the script in the Status column, then click Clear log.
A confirmation dialog appears.
-
Click OK to clear the logs.
If there were any log messages to be cleared, the log now contains a single entry indicating that the log was cleared manually.
Delete Log Entries
The delete log entries maintenance task is available to allow administrators to delete log entries that are no longer needed. This can be useful to save space and create smaller backup files.
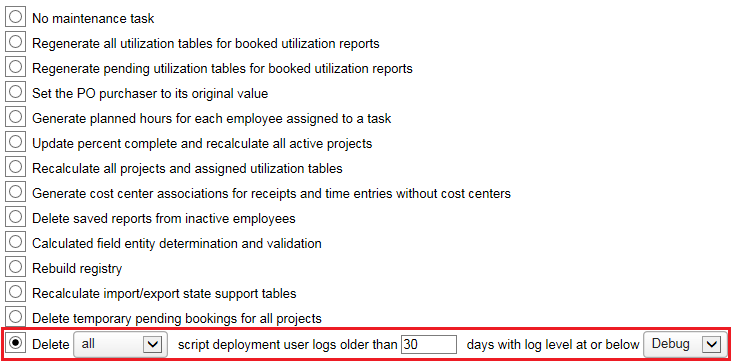
The delete logs task is available from Administration > Global Settings > Account > Maintenance Settings.
Use this maintenance task when your system is not busy and ensure not to delete log entries that you may need.
You should keep at least the last 30 days of log.