4 Alarms

This chapter provides recovery procedures for platform and application alarms.

4.1 Alarm Categories

This chapter describes recovery procedures to use when an alarm condition or other problem occurs on the server. For information about how and when alarm conditions are detected and reported, see Detecting and Reporting Problems.

When an alarm code is reported, locate the alarm in Table 4-1. The procedures for correcting alarm conditions are described in Recovering From Alarms.

Note:

Sometimes the alarm string may consist of multiple alarms and must be decoded in order to use the Alarm Recovery Procedures in this manual. If the alarm code is not listed, see Decode Alarm Strings.

Platform and application errors are grouped by category and severity. The categories are listed from most to least severe:

  • Critical Platform Alarms

  • Critical Application Alarms

  • Major Platform Alarms

  • Major Application Alarms

  • Minor Platform Alarms

  • Minor Application Alarms

Table 4-1 shows the alarm numbers and alarm text for all alarms generated by the platform and the EPAP application. The order within a category is not significant.

Table 4-1 Platform and Application Alarms

Alarm Codes and Error Descriptor UAM Number
Critical Platform Alarms
1000000000002000 - Uncorrectable ECC Memory Error 0370
Major Platform Alarms
32300 3000000000000001 – Server Fan Failure 0372
32301 3000000000000002 - Server Internal Disk Error 0372
32303 3000000000000008 - Server Platform Error 0372
32304 3000000000000010 - Server File System Error 0372
32305 3000000000000020 - Server Platform Process Error 0372
32307 3000000000000080 - Server Swap Space Shortage Failure 0372
32308 3000000000000100 - Server Provisioning Network Error 0372
32309 3000000000000200 – Server Eagle Network A Error 0372
32310 3000000000000400 – Server Eagle Network B Error 0372
32311 3000000000000800 – Server Sync Network Error 0372
32312 3000000000001000 - Server Disk Space Shortage Error 0372
32313 3000000000002000 - Server Default Route Network Error 0372
32314 3000000000004000 - Server Temperature Error 0372
32315 3000000000008000 – Server Mainboard Voltage Error 0372
32317 3000000000020000 - Server Disk Health Test Error 0372
32318 3000000000040000 - Server Disk Unavailable Error 0372
32321 3000000000200000 – Correctable ECC Memory Error 0372
32334 3000000400000000 - Multipath Device Access Link Problem 0372
3000000800000000 – Switch Link Down Error 0372
32336 3000001000000000 - Half-open Socket Limit 0372
32337 3000002000000000 - Flash Program Failure 0372
32338 3000004000000000 - Serial Mezzanine Unseated 0372
Major Application Alarms
4000000000000001 - Mate EPAP Unavailable 0373
4000000000000002 - RTDB Mate Unavailable 0373
4000000000000004 - Congestion 0373
4000000000000008 - File System Full 0373
4000000000000010 - Log Failure 0373
4000000000000020 - RMTP Channels Down 0373
4000000000000040 - Fatal Software Error 0373
4000000000000080 - RTDB Corrupt 0373
4000000000000100 - RTDB Inconsistent 0373
4000000000000200 - RTDB Incoherent 0373
4000000000001000 - RTDB 100% Full 0373
4000000000002000 - RTDB Resynchronization In Progress 0373
4000000000004000 - RTDB Reload Is Required 0373
4000000000008000 - Mate PDBA Unreachable 0373
4000000000010000 - PDBA Connection Failure 0373
4000000000020000 - PDBA Replication Failure 0373
4000000000040000 - RTDB DSM Over-Allocation 0373
4000000000080000 - RTDB Maximum Depth Reached 0373
4000000000100000 - No PDBA Proxy to Remote PDBA Connection 0373
4000000000200000 - DSM Provisioning Error 0373
4000000000800000 - EPAP State Changed to UP 0373
4000000004000000 - RTDB Overallocated 0373
4000000020000000 - Mysql Lock Wait Timeout Exceeded 0373
Minor Platform Alarms
32500 5000000000000001 – Server Disk Space Shortage Warning 0374
32501 5000000000000002 – Server Application Process Error 0374
5000000000000004 - Server Hardware Configuration Error 0374
32506 5000000000000040 – Server Default Router Not Defined 0374
32507 5000000000000080 – Server Temperature Warning 0374
32508 5000000000000100 – Server Core File Detected 0374
32509 5000000000000200 – Server NTP Daemon Not Synchronized 0374
32511 5000000000000800 – Server Disk Self Test Warning 0374
32514 5000000000004000 – Server Reboot Watchdog Initiated 0374
32518 5000000000040000 – Platform Health Check Failure 0374
32519 5000000000080000 – NTP Offset Check Failed 0374
32520 5000000000100000 – NTP Stratum Check Failed 0374
325295000000020000000 – Server Kernel Dump File Detected 0374
325305000000040000000 – TPD Upgrade Failed 0374
325315000000080000000– Half Open Socket Warning 0374
5000000100000000 – Server Upgrade Pending Accept/Reject 0374
Minor Application Alarms
6000000000000001 - RMTP Channel A Down 0375
6000000000000002 - RMTP Channel B Down

0375

6000000000000008 - RTDB 80% Full 0375
6000000000000010 - Minor Software Error 0375
6000000000000020 - Standby PDBA Falling Behind 0375
6000000000000040 - RTDB Tree Error 0375
6000000000000080 - PDB Backup failed 0375
6000000000000100 - Automatic PDB Backup failed 0375
6000000000000200 - RTDB Backup failed 0375
6000000000000400 - Automatic RTDB Backup failed 0375
6000000000001000 - SSH tunnel not established 0375
6000000000002000 - RTDB 90% Full 0375
6000000000004000 - PDB 90% Full 0375
6000000000008000 - PDB 80% Full 0375
6000000000010000 - PDB InnoDB Space 90% Full 0375
6000000000040000 - RTDB Client Lagging Behind 0375
6000000000080000 - Automatic Backup is not configured 0375
6000000000100000 - EPAP QS Replication Issue 0375
6000000000200000 - EPAP QS Lagging Behind 0375
6000000000400000 - License capacity is not configured 0375
6000000000800000 - Long wait on write for PDBI update 0375
6000000001000000 - NE count mismatch between PDB and RTDB 0375
NOTE: The order within a category is not significant.

4.2 EPAP Alarm Recovery Procedures

This section provides recovery procedures for platform and application alarms. The alarm categories are listed by severity.

4.3 Critical Platform Alarms

4.3.1 1000000000002000 - Uncorrectable ECC Memory Error

Alarm Type: TPD

Description: This alarm indicates that chipset has detected an uncorrectable (multiple-bit) memory error that the ECC (Error-Correcting Code) circuitry in the memory is unable to correct.

Severity: Critical

OID: 1.3.6.1.4.1.323.5.3.18.3.1.1.14TpdFanErrorNotifyTpdEccUncorrectableError

Alarm ID: TKSPLATCR141000000000002000

Recovery

  1. Contact My Oracle Support to request hardware replacement.

4.4 Critical Application Alarms

No critical EPAP alarms are generated.

4.5 Major Platform Alarms

Major platform alarms involve hardware components, memory, and network connections.

4.5.1 32300 3000000000000001 – Server Fan Failure

Alarm Type: TPD

Description: This alarm indicates that a fan on the application server is either failing or has failed completely. In either case, there is a danger of component failure due to overheating.

Description: This alarm indicates that a fan in the EAGLE fan tray in the EAGLE shelf where the E5-APP-B is "jacked in" is either failing or has failed completely. In either case, there is a danger of component failure due to overheating.

Severity: Major

OID: TpdFanErrorNotifyTpdFanErrorNotify 1.3.6.1.4.1.323.5.3.18.3.1.2.1

Alarm ID: TKSPLATMA13000000000000001

Recovery

Note:

  1. Run syscheck in Verbose mode to verify a fan failure using the following command:
    [admusr@hostname1351690497 ~]$ sudo syscheck -v hardware fan
    Running modules in class hardware...
             fan: Checking Status of Server Fans.
    *         fan: FAILURE:: MAJOR::3000000000000001 -- Server Fan Failure. This test uses the leaky bucket algorithm.
    *         fan: FAILURE:: Fan RPM is too low, fana: 0, CHIP: FAN
    One or more module in class "hardware" FAILED
    
    LOG LOCATION: /var/TKLC/log/syscheck/fail_log
    
  2. Refer to the procedure for determining the location of the fan assembly that contains the failed fan and replacing a fan assembly in the appropriate hardware manual. After you have opened the front lid to access the fan assemblies, determine whether any objects are interfering with the fan rotation. If some object is interfering with fan rotation, remove the object.
  3. Run "syscheck -v hardware fan" (see Running syscheck Through the EPAP GUI)
    • If the alarm has been cleared (as shown below), the problem is resolved
    [admusr@hostname1351691862 ~]$ sudo syscheck -v hardware fan
    Running modules in class hardware...
    Discarding cache...
             fan: Checking Status of Server Fans.
             fan: Fan is OK. fana: 1, CHIP: FAN
             fan: Server Fan Status OK.
                                     OK
    
    • If the alarm has not been cleared (as shown below) continue with the next step
    [admusr@hostname1351690497 ~]$ sudo syscheck -v hardware fan
    Running modules in class hardware...
             fan: Checking Status of Server Fans.
    *         fan: FAILURE:: MAJOR::3000000000000001 -- Server Fan Failure. This test uses the leaky bucket algorithm.
    *         fan: FAILURE:: Fan RPM is too low, fana: 0, CHIP: FAN
    One or more module in class "hardware" FAILED
    
    LOG LOCATION: /var/TKLC/log/syscheck/fail_log
    
  4. Contact My Oracle Support.

4.5.2 32301 3000000000000002 - Server Internal Disk Error

Alarm Type: TPD

Description: This alarm indicates the server is experiencing issues replicating data to one or more of its mirrored disk drives. This could indicate that one of the server’s disks has either failed or is approaching failure.

Severity: Major

OID: 1.3.6.1.4.1.323.5.3.18.3.1.2.2TpdFanErrorNotifyTpdIntDiskErrorNotify

Alarm ID: TKSPLATMA23000000000000002

Recovery

  1. Run syscheck in Verbose mode (see procedure Running the System Health Check.).
  2. Contact the My Oracle Support and provide the system health check output.

    Note:

    Refer to Hardware and Installation Guide for E5-APP-B, Field Replaceable Units (FRUs) section for information about installing a hard disk drive.
  3. Contact My Oracle Support.

4.5.3 32303 3000000000000008 - Server Platform Error

Alarm Type: TPD

Description: This alarm indicates an error such as a corrupt system configuration or missing files, or indicates that syscheck itself is corrupt.

Severity: Major

OID: 1.3.6.1.4.1.323.5.3.18.3.1.2.4TpdFanErrorNotifyTpdPlatformErrorNotify

Alarm ID: TKSPLATMA43000000000000008

Recovery

  1. Run syscheck in Verbose mode (see procedure Run Syscheck Manually).).
  2. Contact My Oracle Support and provide the system health check output.

4.5.4 32304 3000000000000010 - Server File System Error

Alarm Type: TPD

Description: This alarm indicates that syscheck was unsuccessful in writing to at least one of the server’s file systems.

Severity: Major

OID: 1.3.6.1.4.1.323.5.3.18.3.1.2.5TpdFanErrorNotifyTpdFileSystemErrorNotify

Alarm ID: TKSPLATMA53000000000000010

Recovery

  1. Contact My Oracle Support.

4.5.5 32305 3000000000000020 - Server Platform Process Error

Alarm Type: TPD

Description: This alarm indicates that either the minimum number of instances for a required process are not currently running or too many instances of a required process are running.

Severity: Major

OID: 1.3.6.1.4.1.323.5.3.18.3.1.2.6TpdFanErrorNotifyTpdPlatProcessErrorNotify

Alarm ID: TKSPLATMA63000000000000020

Recovery

  1. Rerun syscheck in verbose mode (see procedure Running the System Health Check).
    • If the alarm has been cleared, the problem is solved.
    • If the alarm has not been cleared, contact My Oracle Support.
  2. Contact My Oracle Support.

4.5.6 32307 3000000000000080 - Server Swap Space Shortage Failure

Alarm Type: TPD

Description: This alarm indicates that the server’s swap space is in danger of being depleted. This is usually caused by a process that has allocated a very large amount of memory over time.

Note:

The interface identified as eth01 on the hardware is identified as eth91 by the software (in syscheck output, for example).

Severity: Major

OID: 1.3.6.1.4.1.323.5.3.18.3.1.2.8TpdFanErrorNotifyTpdSwapSpaceShortageErrorNotify

Alarm ID: TKSPLATMA83000000000000080

Recovery

  1. Contact My Oracle Support.

4.5.7 32308 3000000000000100 - Server Provisioning Network Error

Alarm Type: TPD

Description: This alarm indicates that the connection between the server’s eth1ethernet interface and the customer network is not functioning properly. The eth1 interface is at the upper right port on the rear of the server on the EAGLE backplane.

Note:

The interface identified as eth01 on the hardware is identified as eth91 by the software (in syscheck output, for example).

Severity: Major

OID: TpdFanErrorNotifyTpdProvNetworkErrorNotify 1.3.6.1.4.1.323.5.3.18.3.1.2.9

Alarm ID: TKSPLATMA93000000000000100

Recovery

  1. Verify that a customer-supplied cable labeled TO CUSTOMER NETWORK is securely connected to the upper right port on the rear of the server on the EAGLE backplane.to the appropriate server. Follow the cable to its connection point on the local network and verify this connection is also secure.
  2. Test the customer-supplied cable labeled TO CUSTOMER NETWORK with an Ethernet Line Tester. If the cable does not test positive, replace it.
  3. Have your network administrator verify that the network is functioning properly.
  4. If no other nodes on the local network are experiencing problems and the fault has been isolated to the server or the network administrator is unable to determine the exact origin of the problem, contact My Oracle Support.

4.5.8 32309 3000000000000200 – Server Eagle Network A Error

Alarm Type: TPD

Description: This alarm is generated by the MPS syscheck software package and is not part of the TPD distribution.

Description:

Note:

If these three alarms exist, the probable cause is a failed mate server.
  • 3000000000000200-Server Eagle Network A Error

  • 3000000000000400-Server Eagle Network B Error

  • 3000000000000800-Server Sync Network Error

This alarm indicates an error in the Main SM network, which connects to the SM A ports. The error may be caused by one or more of the following conditions:
  • One or both of the servers is not operational.

  • One or both of the switches is not powered on.

  • The link between the switches is not working.

  • The connection between server A and server B is not working.

Some of the connections between the servers of the SM networks (main and backup).
  • The eth01 interface (top ethernet port on the rear of the server A) connects to the customer provisioning network.

  • The eth02 interface (2nd from top ethernet port on the rear of the server A) connects to port 3 of switch A.

  • The eth03 interface (2nd from bottom ethernet port on the rear of the server A) connects to port 3 of switch B.

  • The eth04 interface (bottom ethernet port on the rear of the server A) is an optional connection to the backup customer provisioning network.

  • The interfaces on the switch are ports 1 through 20 (from left to right) located on the front of the switch.

  • Ports 1 and 2 of switch A connect to ports 1 and 2 of switch B.

  • Ports 5 through 21 of switch A can be used for links to the Main SM ports (SM A ports) on the EAGLE.

Severity: Major

OID: 1.3.6.1.4.1.323.5.3.18.3.1.2.10

Alarm ID: TKSPLATMA103000000000000200

Recovery

  1. Refer to MPS-specific documentation for information regarding this alarm.
  2. Contact My Oracle Support.
  3. Perform the following:
    1. Verify that both servers are powered on by confirming that the POWER LEDs on both servers are illuminated green.
    2. Verify that the switch is powered on.
    3. Verify that the switch does not have any fault lights illuminated.
    4. Verify that the eth01 cable is securely connected to the top port on the server that is reporting the error.
    5. Trace the eth01 cable to the switch. Verify that the eth01 cable is securely connected at correct point of the customer uplink.
    6. Verify that the cable connecting the switches is securely connected at both switches.
  4. Run syscheck (see Running syscheck Through the EPAP GUI).
    1. If the alarm is cleared, the problem is resolved.
    2. If the alarm is not cleared, continue with the next step.
  5. Verify that the cable from eth01 to the switch tests positive with an Ethernet Line Tester. Replace any faulty cables.
  6. If the problem persists, call My Oracle Support.
  7. Perform general IP troubleshooting.
    The syscheck utility reports this error when it tries to ping hosts dsmm-a and dsmm-b a set number of times and fails. This failure could mean any number of things are at fault on the network, but general IP troubleshooting will usually resolve the issue. The platcfg utility can be used to help isolate the problem. To access the platcfg utility:
    1. Log in as platcfg to the server that is generating the alarm.
      
      Login:  platcfg
      Password: <Enter platcfg password>
      
    2. To display various network information and statistics, select menu options:Diagnostics->Network Diagnostics->Netstat
    3. To ping the dsmb-a and/or dsmb-b select menu options:Diagnostics->Network Diagnostics->Ping
    4. To verify no routing issues exist, select menu options:Diagnostics->Network Diagnostics->Traceroute
  8. Run savelogs to gather all application logs, (see Saving Logs Using the EPAP GUI).
  9. Run savelogs_plat to gather system information for further troubleshooting, (see Saving Logs Using the EPAP GUI ), and contact My Oracle Support.

4.5.9 32310 3000000000000400 – Server Eagle Network B Error

Alarm Type: TPD

Description: This alarm is generated by the MPS syscheck software package and is not part of the TPD distribution.

Description:

Note:

If these three alarms exist, the probable cause is a failed mate server.
  • 3000000000000200-Server Eagle Network A Error
  • 3000000000000400-Server Eagle Network B Error
  • 3000000000000800-Server Sync Network Error
This alarm indicates an error in the Backup SM network, which connects to the SM B ports. The error may be caused by one or more of the following conditions:
  • One or both of the servers is not operational.

  • One or both of the switches is not powered on.

  • The link between the switches is not working.

  • The connection between server A and server B is not working.

Some of the connections between the servers of the SM networks (main and backup).
  • The eth01 interface (top ethernet port on the rear of the server B) connects to the customer provisioning network.

  • The eth02 interface (2nd from top ethernet port on the rear of the server B) connects to port 4 of switch A.

  • The eth03 interface (2nd from bottom ethernet port on the rear of the server B) connects to port 4 of switch B.

  • The eth04 interface (bottom ethernet port on the rear of the server B) is an optional connection to the customer backup provisioning network.

  • The interfaces on the switch are ports 1 through 20 (from left to right) located on the front of the switch.

  • Ports 1 and 2 of switch A connect to ports 1 and 2 of switch B.

  • Ports 5 through 21 of switch B can be used for links to the Backup SM ports (SM B ports) on the EAGLE.

Severity: Major

OID: 1.3.6.1.4.1.323.5.3.18.3.1.2.11

Alarm ID: TKSPLATMA113000000000000400

Recovery

  1. Refer to MPS-specific documentation for information regarding this alarm.
  2. Contact My Oracle Support.
  3. Perform the following:
    1. Verify that both servers are powered on by confirming that the POWER LEDs on both servers are illuminated green.
    2. Verify that the switch is powered on.
    3. Verify that the switch does not have any fault lights illuminated.
    4. Verify that the eth01 cable is securely connected to the top port of the server that is reporting the error.
    5. Trace the eth01 cable to the switch. Verify that the eth01 cable is securely connected to the correct point of the customer uplink.
    6. Verify that the cable connecting the switches is securely connected at both switches.
  4. Run syscheck (see Running syscheck Through the EPAP GUI).
    1. If the alarm is cleared, the problem is resolved.
    2. If the alarm is not cleared, continue with the next step.
  5. Verify that the cable from eth01 to the hub tests positive with an Ethernet Line Tester. Replace any faulty cables.
  6. If the problem persists, call My Oracle Support for assistance.
  7. Perform general IP troubleshooting.
    The syscheck utility reports this error when it tries to ping hosts dsmb-a and dsmb-b a set number of times and fails. This failure could mean any number of things are at fault on the network, but general IP troubleshooting will usually resolve the issue. The platcfg utility can be used to help isolate the problem. To access the platcfg utility:
    1. Log in as platcfg to the server that is generating the alarm.
      
      Login:  platcfg
      Password: <Enter  platcfg
       password>
      
    2. To display various network information and statistics, select menu options:Diagnostics->Network Diagnostics->Netstat
    3. To ping the dsmm-a and/or dsmm-b select menu options:Diagnostics->Network Diagnostics->Ping
    4. To verify no routing issues exist, select menu options:Diagnostics->Network Diagnostics->Traceroute
  8. Run savelogs to gather all application logs, (see Saving Logs Using the EPAP GUI).
  9. Run savelogs_plat to gather system information for further troubleshooting, (see Saving Logs Using the EPAP GUI), and contact My Oracle Support.

4.5.10 32311 3000000000000800 – Server Sync Network Error

Alarm Type: TPD

Description: This alarm is generated by the MPS syscheck software package and is not part of the TPD distribution.

Description:

Note:

If these three alarms exist, the probable cause is a failed mate server.
  • 3000000000000200-Server Eagle Network A Error

  • 3000000000000400-Server Eagle Network B Error

  • 3000000000000800-Server Sync Network Error

This alarm indicates that the eth03 connection between the two servers is not functioning properly. The eth03 connection provides a network path over which the servers synchronize data with one another. The eth03 interface is the 2nd from the bottom ethernet port on the rear of the server.

Note:

The sync interface uses eth03 and goes through switch B. All pairs are required.

Severity: Major

OID: 1.3.6.1.4.1.323.5.3.18.3.1.2.12

Alarm ID: TKSPLATMA123000000000000800

Recovery

  1. Refer to MPS-specific documentation for information regarding this alarm.
  2. Contact My Oracle Support.
  3. Verify that both servers are powered on by confirming that the POWER LEDs on both servers are illuminated green.
  4. Verify that the eth03 cable is securely connected to the 2nd from bottom ethernet port on both Server A and Server B.
  5. Test the eth03 cable with an Ethernet Line Tester that is set to test a straight-through cable.
  6. If the cable does not test positive, replace it.
  7. If the problem persists, call My Oracle Support for assistance. Switch B may have failed.
  8. Perform general IP troubleshooting.
    The syscheck utility reports this error when it tries to ping hosts sync-a and sync-b a set number of times and fails. This failure could mean any number of things are at fault on the network, but general IP troubleshooting will usually resolve the issue. The platcfg utility can be used to help isolate the problem. To access the platcfg utility:
    1. Log in as platcfg to the server that is generating the alarm.
      
      Login:  platcfg
      Password: <Enter platcfg password>
      
    2. To display various network information and statistics, select menu options:Diagnostics->Network Diagnostics->Netstat
    3. To ping the sync-a and/or sync-b select menu options:Diagnostics->Network Diagnostics->Ping
    4. To verify no routing issues exist, select menu options:Diagnostics->Network Diagnostics->Traceroute
  9. Run savelogs to gather all application logs (see Saving Logs Using the EPAP GUI).
  10. Run savelogs_plat to gather system information for further troubleshooting, (see Saving Logs Using the EPAP GUI), and contact Platform Engineering.

4.5.11 32312 3000000000001000 - Server Disk Space Shortage Error

Alarm Type: TPD

Description: This alarm indicates that one of the following conditions has occurred:
  • A filesystem has exceeded a failure threshold, which means that more than 90% of the available disk storage has been used on the filesystem.

  • More than 90% of the total number of available files have been allocated on the filesystem.

  • A filesystem has a different number of blocks than it had when installed.

Severity: Major

OID: 1.3.6.1.4.1.323.5.3.18.3.1.2.13

Alarm ID: TKSPLATMA133000000000001000

Recovery

  1. Run syscheck.
  2. Examine the syscheck output to determine if the file system /var/TKLC/epap/free/var/TKLC/elap/free is low on space. If it is, continue to the next step. Otherwise, go to 4
  3. If possible, recover space on the free partition by deleting unnecessary files:
    1. Log in to the EPAP GUI.
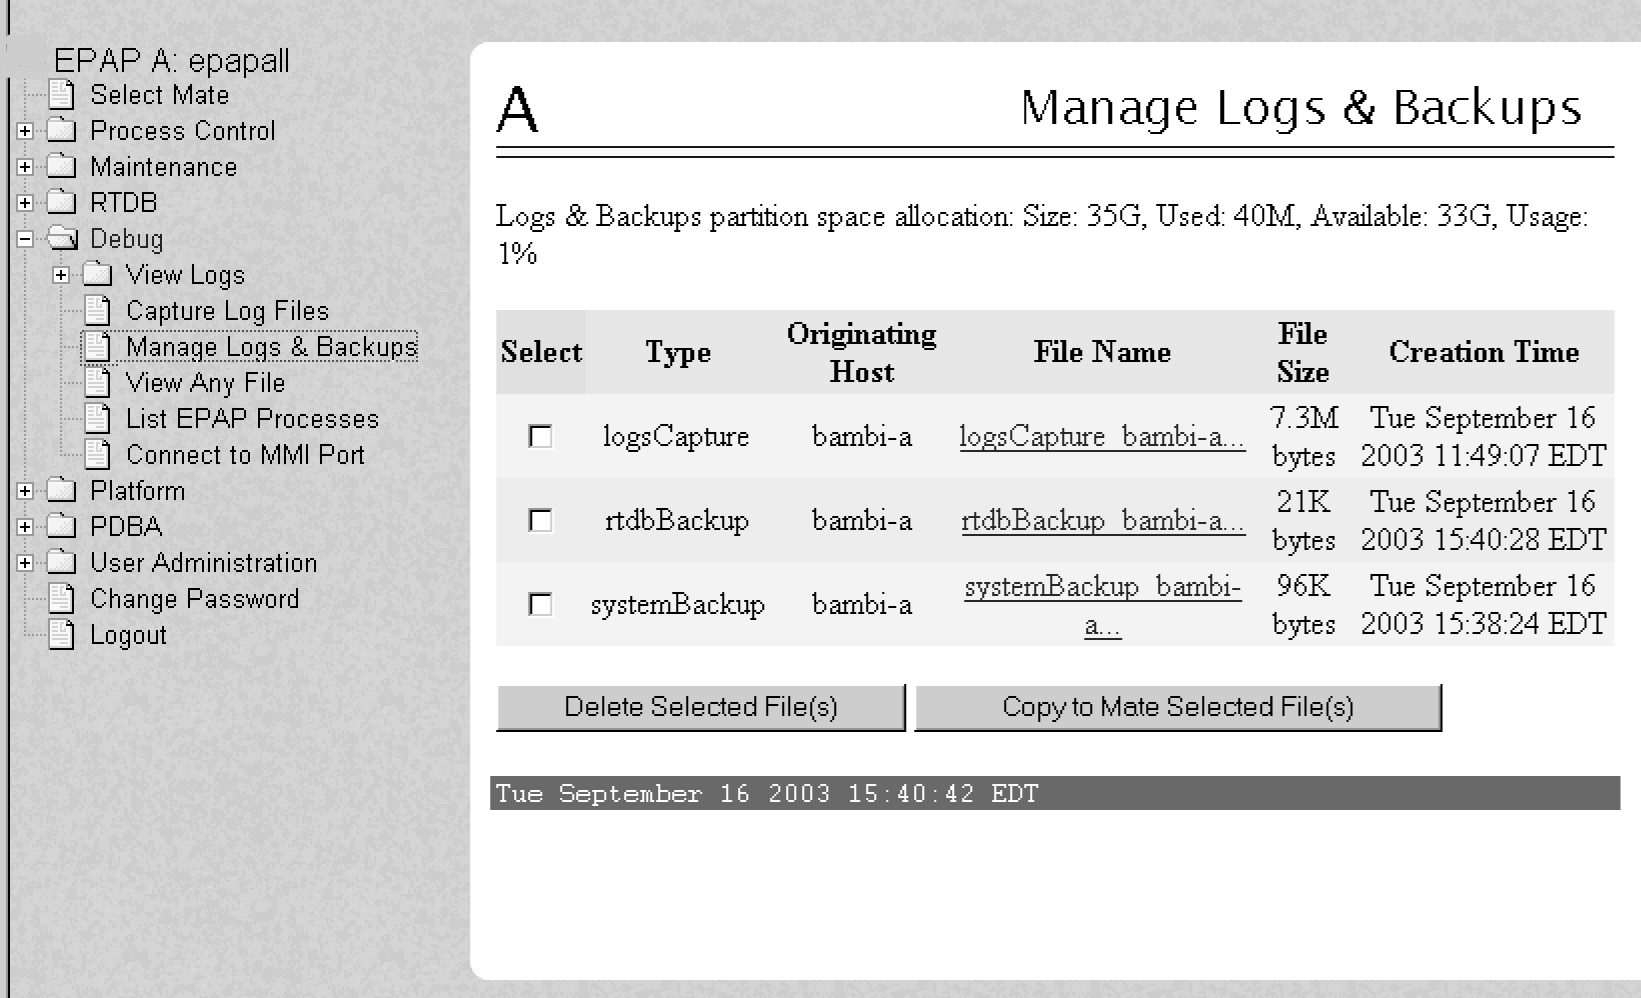
    2. Select Debug>Manage Logs & Backups.
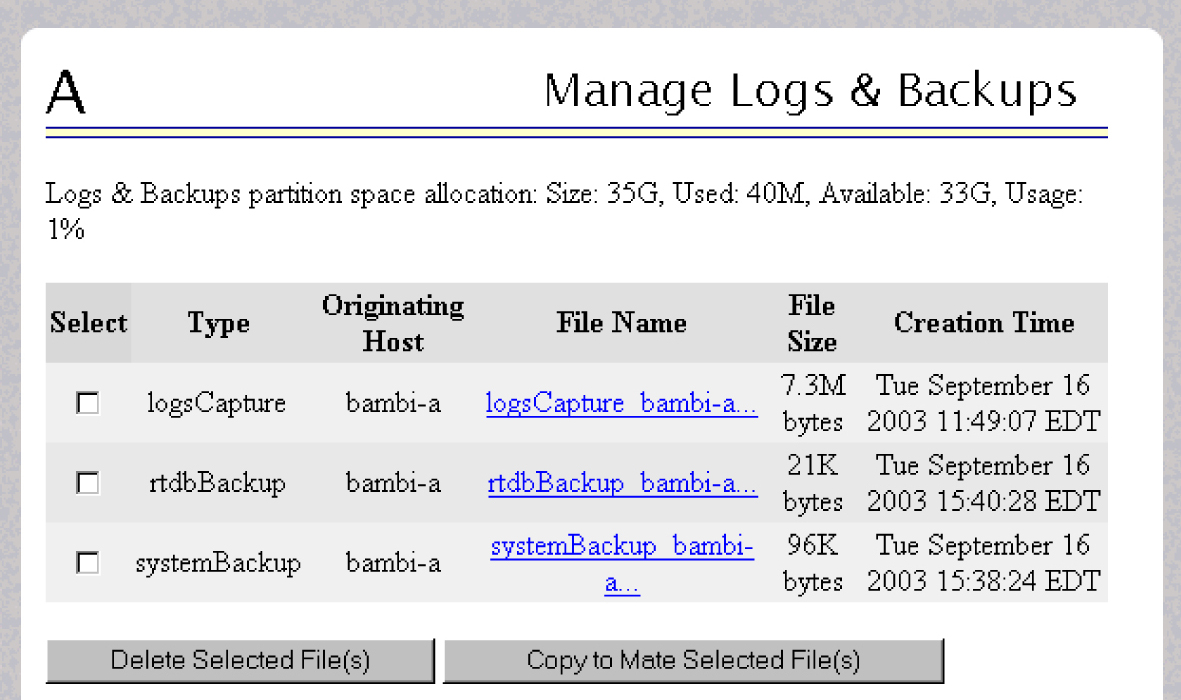
      A screen similar to Figure 4-1 is displayed. This screen displays the information about the total amount of space allocated for and currently used by logs and backups. The display includes logs and backup files which might be selected for deletion to recover additional disk space.

      Figure 4-1 Manage Logs and Backups

      Manage Logs and BackupsManage Logs and Backups
    3. Click the checkbox of each file that you want to delete and then click Delete Selected File(s).
  4. If the file system mounted on /var/TKLC/epap/logs/var/TKLC/elap/logs is the file system that syscheck is reporting to be low on space, execute the following steps:
    1. Log into the server generating the alarm as the admusr:
      
      Login:  admusr
      Password:<Enter admusr password>
      
    2. Change to the /var/TKLC/epap/logs directory:
      $ cd /var/TKLC/epap/logs
    3. Confirm that you are in the /var/TKLC/epap/logs directory:
      $ pwd
      /var/TKLC/epap/logs
      
    4. When the pwd command is executed, if /var/TKLC/epap/logs is not output, go back to sub-step b.
    5. Look for files that you want to delete and execute an rm command for each:
      $ sudo rm <filename>
      where <filename> is replaced by the name of the file to be deleted.
    6. Re-run syscheck.
      • If the alarm is cleared, the problem is solved.

      • If the alarm is not cleared, go to the next step.

  5. If syscheck has determined inodes have been depleted or a file system has a different number of blocks, skip to 11.
  6. Execute the following steps to collect and remove any core files from the server.
    Core files can occupy a large amount of disk space and may be the cause of this alarm:
    1. Log into the server generating the alarm as the admusr:
      
      Login:  admusr
      Password:<Enter admusr password>
      
    2. To list core files on the server, execute the following command, where <mountpoint> is the file system’s mount point:
      $ sudo find <mountpoint> -name core.[0-9]\* -print -exec gzip -9 {} \;

      Note:

      The find command shown above will list any core files found and then compress and rename the file adding a “.gz” extension.
      If any core files are found, transfer them off of the system and save them aside for examination by Oracle. Once a copy of a compressed file has been saved it is safe to delete it from the server.
    3. Re-run syscheck.
      • If the alarm has been cleared, the problem is resolved.

      • If the alarm has not been cleared, proceed to 7.

  7. Execute the following steps if the file system reported by syscheck is /tmp, otherwise skip to 11.
    1. Log into the server generating the alarm as the admusr:
      
      Login:  admusr
      Password:<Enter admusr password>
      
    2. Change to the /tmp directory:
      $ cd /tmp
    3. Confirm that you are in the /tmp directory:
      $ pwd
      /tmp
      
    4. When the pwd command is executed, if /tmp is not output, go back to 5.
    5. Look for possible candidates for deletion:
      $ ls *.iso *.bz2 *.gz *.tar *.tgz *.zip
    6. If any files that can be deleted exist, the output of the ls will show them. For each of the files listed, execute the rm command to delete the file:
      $ sudo rm <filename>
    7. Run syscheck.
      • If the alarm is cleared, the problem is solved.

      • If the alarm is not cleared, go to the next step.

    8. Upon a reboot the system will clean the /tmp directory.
      To reboot the system, issue the following command:
      $ sudo shutdown -r now
    9. Re-run syscheck.
      • If the alarm has been cleared, the problem is resolved.

      • If the alarm has not been cleared, proceed to the next step.

  8. Execute the following steps if the file system reported by syscheck is /var, otherwise skip to 11.
    1. Log into the server generating the alarm as the admusr:
      
      Login:  admusr
      Password:<Enter admusr password>
      
    2. Change to the /var/tmp directory:
      $ cd /var/tmp
    3. Confirm that you are in the /var/tmp directory:
      $ pwd
      /var/tmp
      
    4. When the pwd command is executed, if /var/tmp is not output, go back to 6.
    5. Since all files in this directory can be safely deleted, execute the rm * command to delete all files from the directory:
      $ sudo rm -i *
    6. Re-run syscheck.
      • If the alarm is cleared, the problem is solved.

      • If the alarm is not cleared, go to 11.

  9. Execute the following steps if the file system reported by syscheck is /var/TKLC, otherwise skip to 11.
    1. Log into the server generating the alarm as the admusr:
      
      Login:  admusr
      Password:<Enter admusr password>
      
    2. Change to the /var/TKLC/upgrade directory:
      $ cd /var/TKLC/upgrade
    3. Confirm that you are in the /var/TKLC/upgrade directory:
      $ pwd
      /var/TKLC/upgrade
      
    4. When the pwd command is executed, if /var/TKLC/upgrade is not output, go back to 6.
    5. Since all files in this directory can be safely deleted, execute the rm * command to delete all files from the directory:
      $ sudo rm -i *
    6. Run syscheck.
      • If the alarm is cleared, the problem is solved.

      • If the alarm is not cleared, go to 11.

  10. For any other file system, execute the following command, where <mountpoint> is the file system’s mount point:
    $ sudo find <mountpoint> -type f -exec du -k {} \; | sort -nr > /tmp/file_sizes.txt
    This will produce a list of files in the given file system sorted by file size in the file /tmp/file_sizes.txt.

    Note:

    The find command noted above could possibly take a few minutes to complete if the given mountpoint contains many files.
    Do not delete any file unless you know for certain that it is not needed. Continue to 11 .
  11. Run savelogs to gather all application logs (see Saving Logs Using the EPAP GUI).
  12. Run savelogs_plat to gather system information for further troubleshooting, (see Saving Logs Using the EPAP GUI), and contact My Oracle Support.
  13. Run syscheck in Verbose mode.
  14. Contact My Oracle Support.

4.5.12 32313 3000000000002000 - Server Default Route Network Error

Alarm Type: TPD

Description: This alarm indicates that the default network route of the server is experiencing a problem. Running syscheck in Verbose mode will provide information about which type of problem is occurring.

Caution:

When changing the network routing configuration of the server, verify that the modifications will not impact the method of connectivity for the current login session. The route information must be entered correctly and set to the correct values. Incorrectly modifying the routing configuration of the server may result in total loss of remote network access.

Severity: Major

OID: 1.3.6.1.4.1.323.5.3.18.3.1.2.14

Alarm ID: TKSPLATMA143000000000002000

Recovery

  1. Run syscheck in Verbose mode.
    The output should indicate one of the following errors:
    • The default router at <IP_address> cannot be pinged.

      This error indicates that the router may not be operating or is unreachable. If the syscheck Verbose output returns this error, go to 4.

    • The default route is not on the provisioning network.

      This error indicates that the default route has been defined in the wrong network. If the syscheck Verbose output returns this error, go to 4.

    • An active route cannot be found for a configured default route.

      This error indicates that a mismatch exists between the active configuration and the stored configuration. If the syscheck Verbose output returns this error, go to 5.

  2. Run syscheck in Verbose mode.
    If the output should indicates:
    
    The default router at <IP_address> cannot be pinged
    

    Go to 3, otherwise go to 4.

  3. Perform the these substeps:
    1. Verify the network cables are firmly attached to the server, network switch, router, hub, and any other connection points.
    2. Verify that the configured router is functioning properly.
      Request that the network administrator verify the router is powered on and routing traffic as required.
    3. Request that the router administrator verify that the router is configured to reply to pings on that interface.
    4. If the alarm is cleared, the problem is resolved.
  4. Perform the following substeps when syscheck Verbose output indicates:
    
    The default route is not on the provisioning network
    
    1. Obtain the proper Provisioning Network netmask and the IP address of the appropriate Default Route on the provisioning network.
      This information is maintained by the customer network administrators.
    2. Log in to the server with username epapconfig.
      The server designation at this site is displayed as well as hostname, hostid, Platform Version, Software Version, and date. Verify that the side displayed is the MPS that is reporting the problem. In this example, MPS A is reporting the problem. Enter option 2, Configure Network Interfaces Menu, from the EPAP Configuration Menu.
      
      MPS Side A:  hostname: mpsa-d1a8f8  hostid: 80d1a8f8
                   Platform Version: x.x.x-x.x.x
                   Software Version: EPAP x.x.x-x.x.x
                   Wed Jul 17 09:51:47 EST 2002
       /-------EPAP Configuration Menu--------\
      /----------------------------------------\
      |  1 | Display Configuration             |
      |----|-----------------------------------|
      |  2 | Configure Network Interfaces Menu |
      |----|-----------------------------------|
      |  3 | Set Time Zone                     |
      |----|-----------------------------------|
      |  4 | Exchange Secure Shell Keys        |
      |----|-----------------------------------|
      |  5 | Change Password                   |
      |----|-----------------------------------|
      |  6 | Platform Menu                     |
      |----|-----------------------------------|
      |  7 | Configure NTP Server              |
      |----|-----------------------------------|
      |  8 | PDB Configuration Menu            |
      |----|-----------------------------------|
      |  9 | Security                          |
      |----|-----------------------------------|
      | 10 | SNMP Configuration                |
      |----|-----------------------------------|
      | 11 | Configure Alarm Feed              |
      |----|-----------------------------------|
      | 12 | Configure Query Server            |
      |----|-----------------------------------|
      | 13 | Configure Query Server Alarm Feed |
      |----|-----------------------------------|
      | 14 | Configure SNMP Agent Community    |
      |----|-----------------------------------|
      |  e | Exit                              |
      \----------------------------------------/
      Enter Choice:  2
      
    3. Enter option 1, Configure Provisioning Network, from the Configure Network Interfaces Menu.
      The submenu for configuring communications networks and other information is displayed.
      
       /-----Configure Network Interfaces Menu----\
      /--------------------------------------------\
      |  1 | Configure Provisioning Network        |
      |----|---------------------------------------|
      |  2 | Configure Sync Network                |
      |----|---------------------------------------|
      |  3 | Configure DSM Network                 |
      |----|---------------------------------------|
      |  4 | Configure Backup Provisioning Network |
      |----|---------------------------------------|
      |  5 | Configure Forwarded Ports             |
      |----|---------------------------------------|
      |  6 | Configure Static NAT Addresses        |
      |----|---------------------------------------|
      |  7 | Configure Provisioning VIP Addresses  |
      |----|---------------------------------------|
      |  e | Exit                                  |
      \--------------------------------------------/
      Enter choice:  1
      
    4. Enter option 1, IPv4 Configuration (or 2 for IPv6 Configuration), from the Configure Provisioning Network Menu.
      MPS Side A:  hostname: EPAP17  hostid: f80a110f
                  Platform Version: 6.0.2-7.0.3.0.0_86.45.0
                  Software Version: EPAP 161.0.28-16.1.0.0.0_161.28.0
                  Wed Jun 15 01:33:56 EDT 2016
      
      /-----Configure Provisioning Network Menu-\
      /-------------------------------------------\
      |  1 | IPv4 Configuration                   |
      |----|--------------------------------------|
      |  2 | IPv6 Configuration                   |
      |----|--------------------------------------|
      |  e | Exit                                 |
      \-------------------------------------------/
      
      Enter Choice:  1
      
    5. The following warning is displayed. Type Y and press Enter.
      
      EPAP software and PDBA are running. Stop them? [N]  Y
      
    6. The EPAP A provisioning network IP address is displayed.
      
      Verifying connectivity with mate ...
      Enter the EPAP A provisioning network IP Address [192.168.61.90]:
      
    7. Press Enter after each address is displayed until the Default Route address is displayed.
      
      Verifying connectivity with mate ...
      Enter the EPAP A provisioning network IP Address [192.168.61.90]: 
      Enter the EPAP B provisioning network IP Address [192.168.61.91]: 
      Enter the EPAP provisioning network netmask [255.255.255.0]: 
      Enter the EPAP provisioning network default router IP Address: 192.168.61.250
      
    8. If the default router IP address is incorrect, type the correct address and press Enter.
    9. After you have verified or corrected the Provisioning Network configuration information, enter e to return to the Configure Network Interfaces Menu.
    10. Enter e again to return to the EPAP Configuration Menu.
    11. Go to 6.
  5. Perform the following substeps to reboot the server if the syscheck output indicates the following error. Otherwise, go to 6:
    
    An active route cannot be found for a configured default route
    
    1. Log in as epapconfig on the server console.
      Enter option 6, Platform Menu, from the EPAP Configuration Menu.
      
       /-------EPAP Configuration Menu--------\
      /----------------------------------------\
      |  1 | Display Configuration             |
      |----|-----------------------------------|
      |  2 | Configure Network Interfaces Menu |
      |----|-----------------------------------|
      |  3 | Set Time Zone                     |
      |----|-----------------------------------|
      |  4 | Exchange Secure Shell Keys        |
      |----|-----------------------------------|
      |  5 | Change Password                   |
      |----|-----------------------------------|
      |  6 | Platform Menu                     |
      |----|-----------------------------------|
      |  7 | Configure NTP Server              |
      |----|-----------------------------------|
      |  8 | PDB Configuration Menu            |
      |----|-----------------------------------|
      |  9 | Security                          |
      |----|-----------------------------------|
      | 10 | SNMP Configuration                |
      |----|-----------------------------------|
      | 11 | Configure Alarm Feed              |
      |----|-----------------------------------|
      | 12 | Configure Query Server            |
      |----|-----------------------------------|
      | 13 | Configure Query Server Alarm Feed |
      |----|-----------------------------------|
      | 14 | Configure SNMP Agent Community    |
      |----|-----------------------------------|
      |  e | Exit                              |
      \----------------------------------------/
      Enter Choice:  6
      
    2. Enter option 2, Reboot MPS, from the EPAP Platform Menu.
      At the prompt, enter the identifier of the server to which you are logged in (A or B). In this example, A is used.
      MPS Side A:  hostname: EPAP17  hostid: f80a110f
                   Platform Version: 6.0.2-7.0.3.0.0_86.45.0
                   Software Version: EPAP 161.0.28-16.1.0.0.0_161.28.0
                   Wed Jun 15 01:34:39 EDT 2016
      
      /-----EPAP Platform Menu-\
      /--------------------------\
      |  1 | Initiate Upgrade    |
      |----|---------------------|
      |  2 | Reboot MPS          |
      |----|---------------------|
      |  3 | MySQL Backup        |
      |----|---------------------|
      |  4 | RTDB Backup         |
      |----|---------------------|
      |  5 | PDB Backup          |
      |----|---------------------|
      |  e | Exit                |
      \--------------------------/
      
      
      Enter Choice:  2
      Reboot MPS A, MPS B or BOTH? [BOTH]:  A
      Reboot local MPS...
      
    3. Wait for the reboot to complete.
    4. Go to 6.
  6. Run syscheck.
    • If the alarm is cleared, the problem is resolved.
    • If the alarm is not cleared, go to the next step.
  7. Contact My Oracle Support with the syscheck output collected in the previous steps.
  8. Run savelogs to gather all application logs (see Saving Logs Using the EPAP GUI).
  9. Run savelogs_plat to gather system information for further troubleshooting (see Saving Logs Using the EPAP GUI), and contact My Oracle Support.
  10. Run syscheck in Verbose mode.
    The output should indicate one of the following errors:
    • The default router at <IP_address> cannot be pinged.

      This error indicates that the router may not be operating or is unreachable. If the syscheck Verbose output returns this error, go to 4.

    • The default route is not on the provisioning network.

      This error indicates that the default route has been defined in the wrong network. If the syscheck Verbose output returns this error, contact My Oracle Support.

    • An active route cannot be found for a configured default route.

      This error indicates that a mismatch exists between the active configuration and the stored configuration. If the syscheck Verbose output returns this error, contact My Oracle Support.

  11. Perform the following substeps when syscheck Verbose output indicates:
    
    The default router at <IP_address> cannot be pinged
    
    1. Verify the network cables are firmly attached to the server, network switch, router, hub, and any other connection points.
    2. Verify that the configured router is functioning properly.
      Request that the network administrator verify the router is powered on and routing traffic as required.
    3. Request that the router administrator verify that the router is configured to reply to pings on that interface.
    4. Rerun syscheck:
      • If the alarm has been cleared, the problem is solved.
      • If the alarm has not been cleared, contact My Oracle Support.
  12. Contact My Oracle Support.

4.5.13 32314 3000000000004000 - Server Temperature Error

Alarm Type: TPD

Description: The internal temperature within the server is unacceptably high.

Severity: Major

OID: TpdTemperatureErrorNotify 1.3.6.1.4.1.323.5.3.18.3.1.2.15

Alarm ID: TKSPLATMA153000000000004000

Recovery

  1. Ensure that nothing is blocking the fan's intake. Remove any blockage.
  2. Verify that the temperature in the room is normal (see the following table). If it is too hot, lower the temperature in the room to an acceptable level.

    Table 4-2 Server Environmental Conditions

    Ambient Temperature

    Operating: 5 degrees C to 40 degrees C

    Exceptional Operating Limit: 0 degrees C to 50 degrees C

    Storage: -20 degrees C to 60 degrees C

    Ambient Temperature

    Operating: 5° C to 35° C

    Storage: -20° C to 60° C

    Relative Humidity

    Operating: 5% to 85% non-condensing

    Storage: 5% to 950% non-condensing

    Elevation

    Operating: -300m to +300m

    Storage: -300m to +1200m

    Heating, Ventilation, and Air Conditioning

    Capacity must compensate for up to 5100 BTUs/hr for each installed frame.

    Calculate HVAC capacity as follows:

    Determine the wattage of the installed equipment. Use the formula: watts x 3.143 = BTUs/hr

    Note:

    Be prepared to wait the appropriate period of time before continuing with the next step. Conditions need to be below alarm thresholds consistently for the alarm to clear. The alarm may take up to five minutes to clear after conditions improve. It may take about ten minutes after the room returns to an acceptable temperature before syscheck shows the alarm cleared.
  3. Verify that the temperature in the room is normal. If it is too hot, lower the temperature in the room to an acceptable level.

    Note:

    Be prepared to wait the appropriate period of time before continuing with the next step. Conditions need to be below alarm thresholds consistently for the alarm to clear. It may take about ten minutes after the room returns to an acceptable temperature before the alarm cleared.
  4. Run syscheck Check to see if the alarm has cleared
    • If the alarm has been cleared, the problem is resolved.
    • If the alarm has not been cleared, continue with the next step.
  5. Run syscheck Check to see if the alarm has cleared
    • If the alarm has been cleared, the problem is resolved.
    • If the alarm has not been cleared, continue with the next step.
  6. Replace the filter (refer to the appropriate hardware manual).

    Note:

    Be prepared to wait the appropriate period of time before continuing with the next step. Conditions need to be below alarm thresholds consistently for the alarm to clear. The alarm may take up to five minutes to clear after conditions improve. It may take about ten minutes after the filter is replaced before syscheck shows the alarm cleared.
  7. Run syscheck (see Running the System Health Check).
    • If the alarm has been cleared, the problem is resolved.
    • If the alarm has not been cleared, continue with the next step.
  8. If the problem has not been resolved, contact My Oracle Support.

4.5.14 32315 3000000000008000 – Server Mainboard Voltage Error

Alarm Type: TPD

Description: This alarm indicates that one or more of the monitored voltages on the server mainboard have been detected to be out of the normal expected operating range.

Severity: Major

OID: TpdMainboardVoltageErrorNotify 1.3.6.1.4.1.323.5.3.18.3.1.2.16

Alarm ID: TKSPLATMA163000000000008000

Recovery

  1. Contact My Oracle Support.

4.5.15 32317 3000000000020000 - Server Disk Health Test Error

Alarm Type: TPD

Description: Either the hard drive has failed or failure is imminent.

Severity: Major

OID: TpdDiskHealthErrorNotify 1.3.6.1.4.1.323.5.3.18.3.1.2.18

Alarm ID: TKSPLATMA183000000000020000

Recovery

  1. Immediately contact My Oracle Support for assistance with a disk replacement.
  2. Perform the recovery procedures for the other alarms that accompany this alarm.
  3. If the problem has not been resolved, contact My Oracle Support.

4.5.16 32318 3000000000040000 - Server Disk Unavailable Error

Alarm Type: TPD

Description: The smartd service is not able to read the disk status because the disk has other problems that are reported by other alarms. This alarm appears only while a server is booting.

Severity: Major

OID: TpdDiskUnavailableErrorNotify 1.3.6.1.4.1.323.5.3.18.3.1.2.19

Alarm ID: TKSPLATMA193000000000040000

Recovery

  1. Contact My Oracle Support.

4.5.17 32321 3000000000200000 – Correctable ECC Memory Error

Alarm Type: TPD

Description: This alarm indicates that chipset has detected a correctable (single-bit) memory error that has been corrected by the ECC (Error-Correcting Code) circuitry in the memory.

Severity: Major

OID: TpdEccCorrectableErrorNotify 1.3.6.1.4.1.323.5.3.18.3.1.2.22

Alarm ID: TKSPLATMA223000000000200000

Recovery

  1. No recovery necessary. If the condition persists, contact My Oracle Support to request hardware replacement.

4.5.18 32334 3000000400000000 - Multipath Device Access Link Problem

Alarm Type: TPD

Description: One or more "access paths" of a multipath device are failing or are not healthy, or the multipath device does not exist.

Severity: Major

OID: TpdMpathDeviceProblemNotify1.3.6.1.4.1.323.5.3.18.3.1.2.35

Alarm ID: TKSPLATMA353000000400000000

Recovery

  1. My Oracle Support should do the following:
    1. Check in the MSA administration console (web-application) that correct "volumes" on MSA exist, and read/write access is granted to the blade server.
    2. Check if multipath daemon/service is running on the blade server: service multipathd status. Resolution:
      1. start multipathd: service multipathd start
    3. Check output of "multipath -ll": it shows all multipath devices existing in the system and their access paths; check that particular /dev/sdX devices exist. This may be due to SCSI bus and/or FC HBAs haven't been rescanned to see if new devices exist. Resolution:
      1. run "/opt/hp/hp_fibreutils/hp_rescan -a",
      2. "echo 1 > /sys/class/fc_host/host*/issue_lip",
      3. "echo '- - -' > /sys/class/scsi_host/host*/scan"
    4. Check if syscheck::disk::multipath test is configured to monitor right multipath devices and its access paths: see output of "multipath -ll" and compare them to "syscheckAdm disk multipath - -get - -var=MPATH_LINKS" output. Resolution:
      1. configure disk::multipath check correctly.
  2. Contact My Oracle Support.

4.5.19 3000000800000000 – Switch Link Down Error

This alarm indicates that the switch is reporting that the link is down. The link that is down is reported in the alarm. For example, port 1/1/2 is reported as 1102.

Recovery Procedure:

  1. Verify cabling between the offending port and remote side.
  2. Verify networking on the remote end.
  3. If problem persists, contact My Oracle Support to verify port settings on both the server and the switch.

4.5.20 32336 3000001000000000 - Half-open Socket Limit

Alarm Type: TPD

Description:This alarm indicates that the number of half open TCP sockets has reached the major threshold. This problem is caused by a remote system failing to complete the TCP 3-way handshake.

Severity: Major

OID: tpdHalfOpenSocketLimit 1.3.6.1.4.1.323.5.3.18.3.1.2.37

Alarm ID: TKSPLATMA37 3000001000000000

Recovery

  1. Contact My Oracle Support.

4.5.21 32337 3000002000000000 - Flash Program Failure

Alarm Type: TPD

Description: This alarm indicates there was an error while trying to update the firmware flash on the E5-APP-B cards.

Severity: Major

OID: tpdFlashProgramFailure 1.3.6.1.4.1.323.5.3.18.3.1.2.38

Alarm ID: TKSPLATMA383000002000000000

Recovery

  1. Contact My Oracle Support.

4.5.22 32338 3000004000000000 - Serial Mezzanine Unseated

Alarm Type: TPD

Description:This alarm indicates the serial mezzanine board was not properly seated.

Severity: Major

OID: tpdSerialMezzUnseated 1.3.6.1.4.1.323.5.3.18.3.1.2.39

Alarm ID: TKSPLATMA393000004000000000

Recovery

  1. Contact My Oracle Support.

4.6 Major Application Alarms

The major application alarms involve the EPAP software, RTDBs, file system and logs.

4.6.1 4000000000000001 - Mate EPAP Unavailable

One EPAP has reported that the other EPAP is unreachable.

Recovery

  1. Log in to the EPAPGUI (see Accessing the EPAP GUI).
  2. View the EPAP status on the banner.
    • If the mate EPAP status is DOWN, go to 3 .
    • If the mate EPAP status is ACTIVE or STANDBY, go to 4.
  3. Select the Select Mate menu item to change to the mate EPAP.
  4. Select Process Control > Start Software to start the mate EPAP software.
  5. View the EPAP status on the banner.
    • If the mate EPAP status is ACTIVE or STANDBY, the problem is resolved.
    • If the mate EPAP status is still DOWN, continue with 6.
  6. Select the Select Mate menu item to change back to the side that reported the alarm.
  7. Stop and start the software on the side that is reporting the alarm (see Restarting the EPAP Software).
  8. If the problem persists, run savelogs to gather system information for further troubleshooting (see Saving Logs Using the EPAP GUI), and contact My Oracle Support.

4.6.2 4000000000000002 - RTDB Mate Unavailable

The local EPAP cannot use the direct link to the Standby for RTDB database synchronization.

Recovery

  1. Log in to the EPAPGUI (see Accessing the EPAP GUI).
  2. View the EPAP status on the banner.
    • If the mate EPAP status is DOWN, go to 3.
    • If the mate EPAP status is ACTIVE or STANDBY, go to 4.
  3. Select Process Control > Start Software to start the mate EPAP software.
  4. Select the Select Mate menu item to change to the mate EPAP.
  5. Determine whether the alarm has cleared by verifying whether it is still being displayed in the banner or in the Alarm View window.
    • If the alarm has cleared, the problem is resolved.
    • If the alarm has not yet cleared, continue with 6.
  6. Make sure that you are logged into the side opposite from the side reporting the alarm.

    If it is necessary to change sides, select the Select Mate menu item to change to the side opposite the side that reported the alarm.

  7. Stop and start the software on the side that is reporting the alarm (see Restarting the EPAP Software).
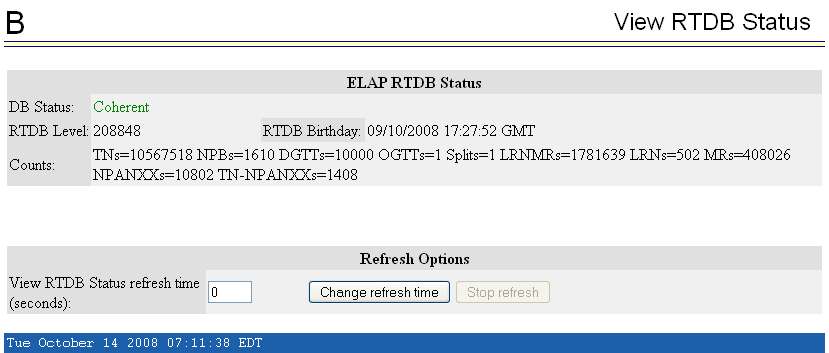
  8. Select RTDB>View RTDB Status to verify that the RTDB status on both sides is coherent, as shown in Figure 4-2.

    Figure 4-2 Coherent RTDB Status

    Coherent RTDB StatusCoherent RTDB Status
  9. If the problem persists, run savelogs to gather system information for further troubleshooting (see Saving Logs Using the EPAP GUI), and contact My Oracle Support.

4.6.3 4000000000000004 - Congestion

The EPAP RTDB database record cache used to keep updates currently being provisioned is above 80% capacity.

Recovery

  1. At the EAGLE input terminal, enter the rept-stat-mps command to verify the status.

    Refer to Commands User's Guide to interpret the output.

  2. If the problem does not clear within 2 hours with an "EPAP Available" notice, capture the log files on both EPAPs (see Saving Logs Using the EPAP GUI) and contact My Oracle Support.

4.6.4 4000000000000008 - File System Full

This alarm indicates that the server file system is full.

Recovery

  1. Call My Oracle Support for assistance.

4.6.5 4000000000000010 - Log Failure

This alarm indicates that the system was unsuccessful in writing to at least one log file.

  1. Call My Oracle Support for assistance.

4.6.6 4000000000000020 - RMTP Channels Down

Both IP multicast mechanisms are down.

Recovery

  1. Check the physical connections between the local server and the Service Module cards on the EAGLE.

    Make sure the connectors are firmly seated.

  2. Stop and restart the software on the side that is reporting the alarm (see Restarting the EPAP Software).
  3. Capture the log files on both EPAPs (see Saving Logs Using the EPAP GUI) and contact My Oracle Support.

4.6.7 4000000000000040 - Fatal Software Error

A major software component on the EPAP has failed.

Recovery

  1. Restart EPAP software. See Restarting the EPAP Software
  2. Capture the log files on both EPAPs (see Saving Logs Using the EPAP GUI) and contact My Oracle Support.

4.6.8 4000000000000080 - RTDB Corrupt

A real-time database is corrupt. The calculated checksum did not match the checksum value stored for one or more records.

Recovery

  1. Capture the log files on both EPAPs (see Saving Logs Using the EPAP GUI) and contact My Oracle Support.

4.6.9 4000000000000100 - RTDB Inconsistent

This message indicates one or more of the following conditions:

  • The real-time database for one or more Service Module cards is inconsistent with the current real-time database on the Active EPAP fixed disks

  • RTDBs detect that it is ahead of an ACTIVEPDBA that it just connected to (probably a PDBA switchover has occurred, or a restore from a backup of PDB with a previous db level)

  • RTDB timestamp of most recent level does not match the PDBAs record of that timestamp.

Recovery

  1. Log in to the User Interface screen of EPAP A (see Accessing the EPAP GUI)
  2. Check the banner information above the menu to verify that you are logged into the EPAP A that is reporting the problem.
    If it is necessary to switch to EPAP B, click the Select Mate menu item.
  3. From the menu, select RTDB>View RTDB Status to display status information about the RTDBs.
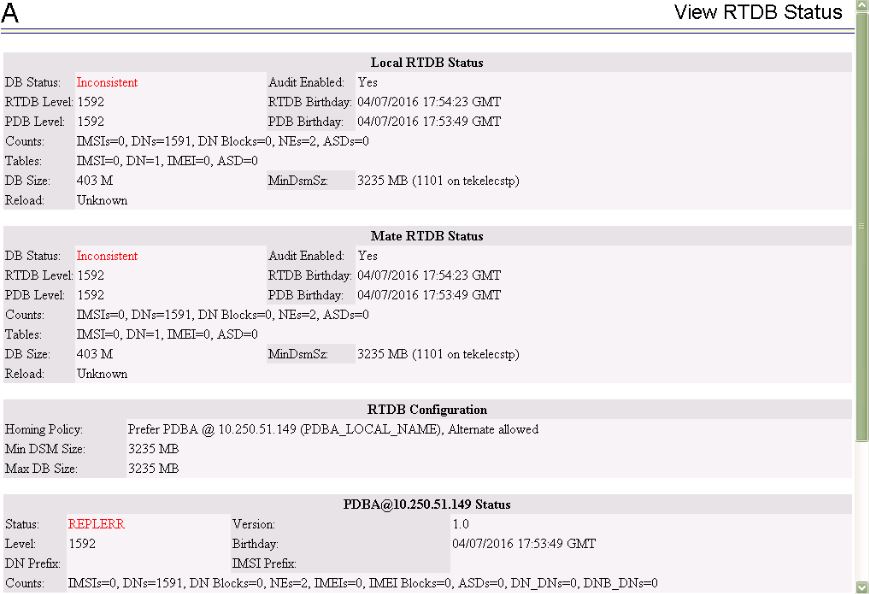
    Figure 4-3 shows an example of two Inconsistent RTDBs.

    Figure 4-3 Inconsistent RTDB Status

    Inconsistent RTDB Status
    If one RTDB is inconsistent and the other is coherent in a mated pair setup, proceed to 4. If both RTDBs on an EPAP paired setup are inconsistent, reload from the nearest EPAP site with a coherent RTDB. If all RTDBs are inconsistent, additional steps may be required to reload one RTDB from PDB and backup the new RTDB, then restore the remaining RTDBs.
  4. Verify the PDB information on the RTDB Status view is correct before continuing.
  5. Before attempting to copy the RTDB, the EPAP A software must be stopped by doing the following:

    Caution:

    If the software is not stopped as directed in 5.a through 5.c, the RTDB will become corrupted.
    1. Select Process Control>Stop Software to stop the software.
      The following warning appears:
      
      CAUTION: This action will stop all EPAP software processes, and will prevent the selected EPAP from updating the RTDB until the EPAP software is re-started (by executing the Start Software menu item).
      
    2. On the Stop EPAP Software screen, make sure the following item on the screen is checked: Check if you want the software to automatically start on reboot.
    3. Select the Stop EPAP Software button to stop the software.
    4. Select Select Mate from the menu to return to the EPAP that is reporting the problem.
  6. Select RTDB>Maintenance>Reload from Remote.
    The screen shown in Figure 4-6 shows this function.

    Figure 4-4 Reload RTDB from Mate EPAP

    Reload RTDB from Mate EPAP
  7. Make sure that the Mate radio button is filled in, as shown in Figure 4-6 and click the Begin RTDB Reload from Remote button.
  8. Click the Reload button as shown in Figure 4-6.
  9. When the reload has completed, start the software on EPAP A by doing the following:
    1. Select Process Control > Start Software to start the software again.

      Make sure the following item on the screen is checked:

      Check if you want to start the PDBA software along with the EPAP software

    2. Select the Start EPAP Software button to start the software.
  10. If the problem persists, capture the log files on both EPAPs (see Saving Logs Using the EPAP GUI) and contact My Oracle Support.

4.6.10 4000000000000200 - RTDB Incoherent

This message usually indicates that the RTDB database download is in progress.

When the download is complete, the following UIM message will appear:


0452 - RTDB reload complete

Recovery

  1. If this alarm displays while an RTDB download is in progress, no further action is necessary.
  2. If this alarm displays when an RTDB download is not in progress, capture the log files on both EPAPs (see Saving Logs Using the EPAP GUI) and contact My Oracle Support.

4.6.11 4000000000001000 - RTDB 100% Full

The RTDB on the EPAP is at capacity. The EPAP RTDB is not updating.

You may be able to free up space by deleting unnecessary data in the database.

This error can result from one of the following conditions on the EAGLE:

  • The EPAP Data Split feature is not ON
  • The epap240m STP option is not ON (E5-SM8G-B card required)
  • The 120M DN and 120M IMSIs via split database feature is OFF at EPAP and OFF at Eagle
  • The 120M DN and 120M IMSIs via split database feature is OFF at EPAP and ON at Eagle

Recovery

  1. On the EAGLE, turn ON the optional EPAP Data Split feature to allow more room for the provisioned data.
  2. On the EAGLE, turn ON the epap240m STP option (E5-SM8G-B card required) to allow more room for the provisioned data.
  3. Turn ON the optional 120M DN and 120M IMSIs via Split database feature on the EPAP and Eagle to allow more room for the provisioned data.
  4. Contact My Oracle Support for assistance.

4.6.12 4000000000002000 - RTDB Resynchronization In Progress

This message indicates that the RTDB resynchronization is in progress.

Recovery

  1. No further action is necessary.

4.6.13 4000000000004000 - RTDB Reload Is Required

This message indicates that the RTDB reload is required for one of the following reasons:

  • The PDB Birthday on the EPAP reporting the error does not match the mate EPAP’s PDB Birthday.

  • The transaction logs did not contain enough information to resynchronize the databases (the transaction logs may be too small).

Caution:

If both sides are reporting this error, contact My Oracle Support.

If only one side is reporting this error, use the following procedure.

Recovery

  1. Log in to the User Interface screen of the EPAP (see 4000000000004000 - RTDB Reload Is Required)
  2. Check the banner information above the menu to verify that you are logged into the EPAP that is reporting the problem.
    If it is necessary to switch to the problem EPAP, click the Select Mate menu item.
  3. From the menu, select RTDB>View RTDB Status to display status information about the RTDBs.
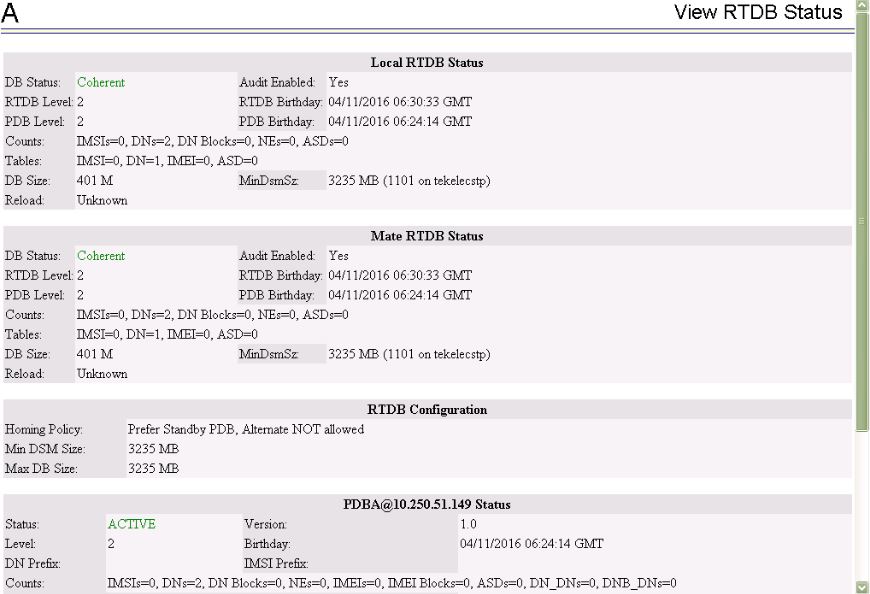
    Figure 4-5 shows an example.

    Figure 4-5 RTDB Status

    RTDB Status
  4. If the RTDB birthdays for both the local RTDB and the mate RTDB are the same, you can copy the mate’s RTDB to the local RTDB.
    If the RTDB birthdays are not the same, go to step 5.
  5. Before attempting to copy the RTDB, you must stop the software on both sides by doing the following:

    Caution:

    If you do not stop the software on both sides, as directed in substeps 5a through 5c, the RTDBs will become corrupted.
    1. Select Process Control > Stop Software to stop the software.
      The following warning appears:
      
      CAUTION: This action will stop all EPAP software processes, and will prevent the selected EPAP from updating the RTDB until the EPAP software is re-started (by executing the Start Software menu item).
      
    2. On the Stop EPAP Software screen, make sure the following item on the screen is checked:
      Check if you want the software to automatically start on reboot.
    3. Select the Stop EPAP Software button to stop the software.
    4. Select Select Mate from the menu.
    5. Repeat substeps 5.a through 5.c on the other side.
    6. Select Select Mate from the menu to return to the EPAP that is reporting the problem.
  6. Verify that you are logged in to the side that is reporting the problem.
  7. Select RTDB>Maintenance>Reload from Remote.
    The screen shown in Figure 4-6 shows this function.

    Figure 4-6 Reload RTDB from Mate EPAP

    Reload RTDB from Mate EPAP
  8. Make sure that the Mate radio button is filled in, as shown in Figure 4-6 and click the Begin RTDB Reload from Remote button.
  9. When the reload has completed, start the software on both sides by doing the following:
    1. Select Process Control > Start Software to start the software again.

      Make sure the following item on the screen is checked (this item applies only if performing this procedure on Side A):

      Check if you want to start the PDBA software along with the EPAP software.

    2. Select the Start EPAP Software button to start the software.
    3. Select Select Mate from the menu.
    4. Repeat substeps 9.a and 9.b on the other side.
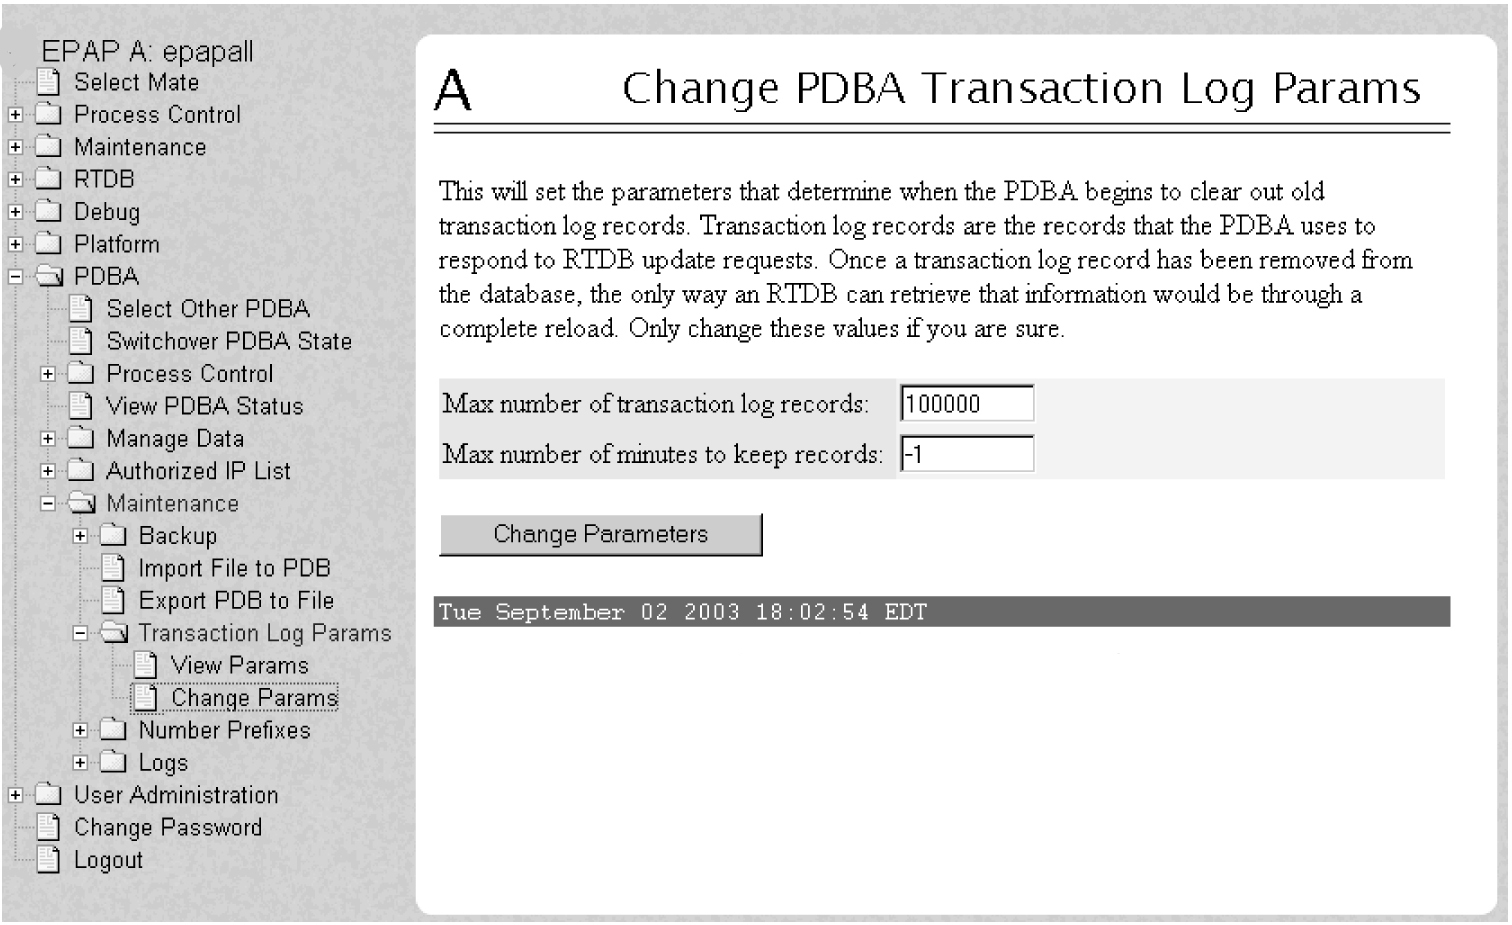
  10. If you wish to increase the size of the transaction logs, select PDBA> Maintenance > Transaction Log Params > Change Params as shown in Figure 4-7.

    Figure 4-7 Changing Transaction Log Parameters

    Changing Transaction Log Parameters
  11. If the problem persists, contact My Oracle Support.

4.6.14 4000000000008000 - Mate PDBA Unreachable

This message indicates that the other PDBA is unreachable.

Recovery

  1. Log in to the User Interface screen of the EPAP GUI (see Accessing the EPAP GUI).
  2. Check the banner information above the menu for the PDBA status.
    1. If neither PDBA status is DOWN, go to 3.
    2. If status of one of the PDBAs is DOWN, continue with 4.
    Figure 4-8 shows an example in which the PDBA on EPAP B is DOWN.

    Figure 4-8 PDBA Down


    PDBA Down

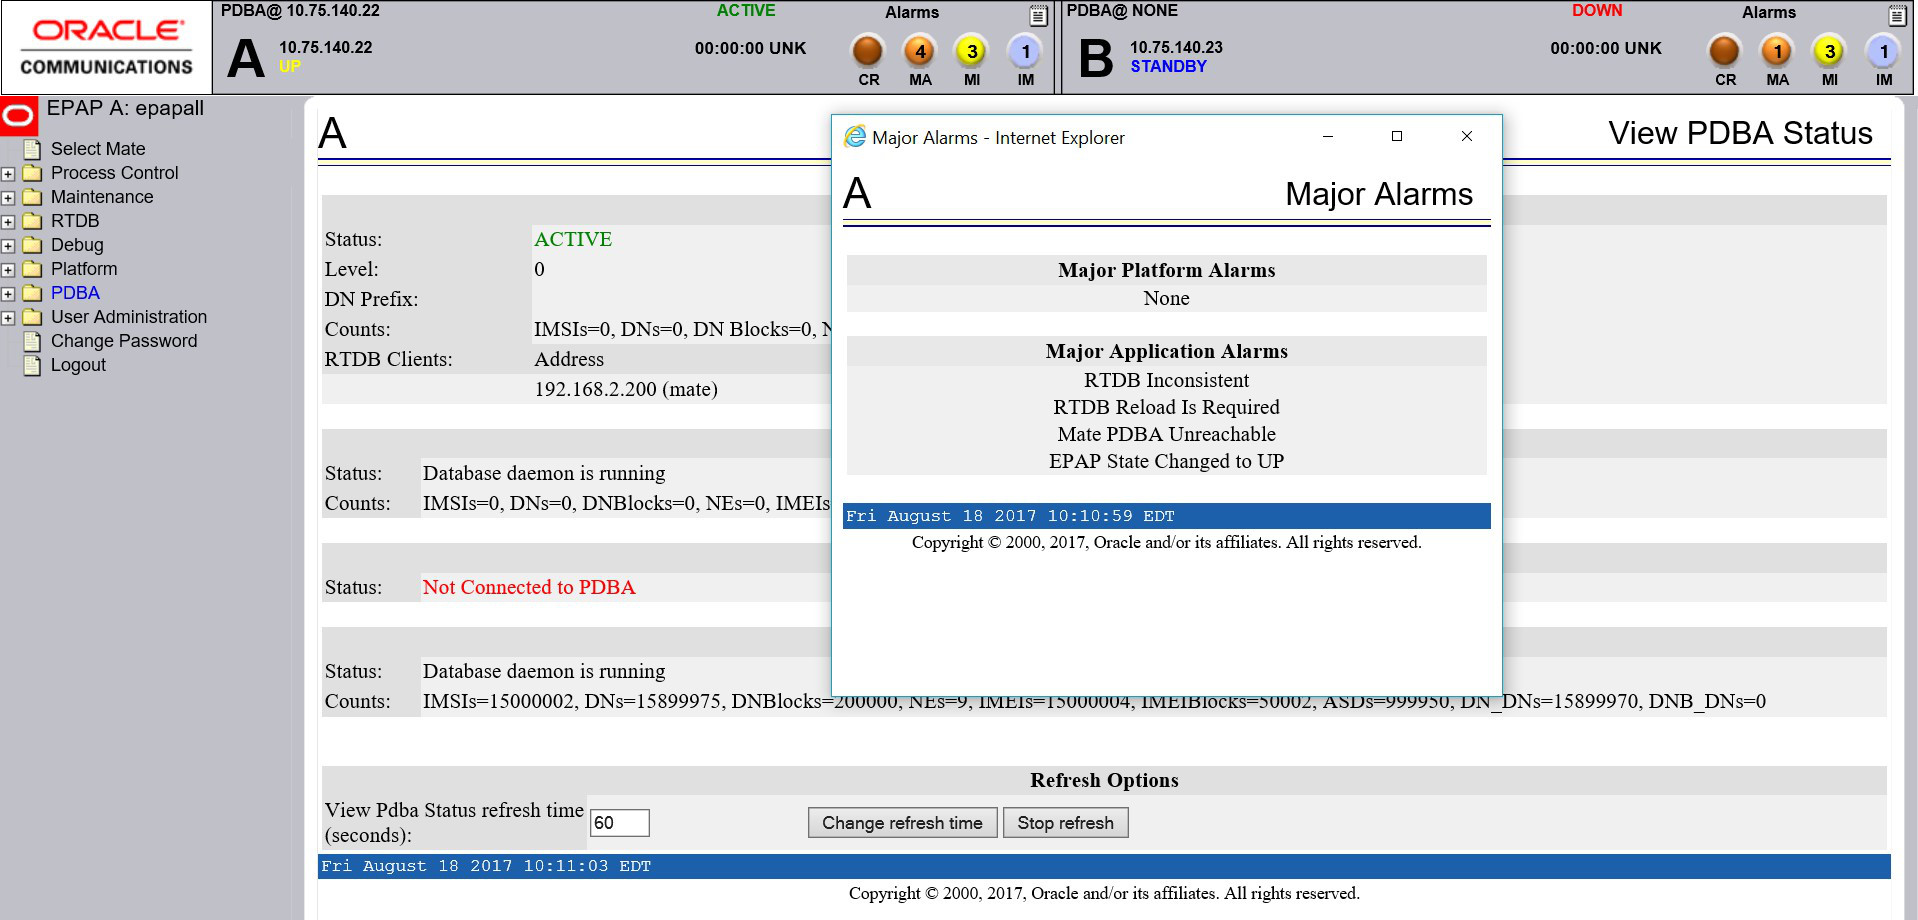
  3. View Tool Tips to verify the alarm and to verify that you are logged into the EPAP whose PDBA is DOWN.

    Figure 4-9 Alarms Details


    Alarms Details

    If it necessary to switch to the other PDBA, select PDBA>Select Other PDBA.
  4. Attempt to start the PDBA by selecting PDBA> Process Control > Start PDBA Software.
    The window shown in Figure 4-10 is displayed.

    Figure 4-10 Start PDBA

    Start PDBA
  5. Click the Start PDBA Software button.
  6. When the PDBA software has been started, the window shown in Figure 4-11 displays, and within moments the banner will show the PDBA status as ACTIVE or STANDBY.
    If the status does not change to ACTIVE or STANDBY, continue to 7.

    Figure 4-11 PDBA Started

    PDBA Started
  7. Check the status of the provisioning network.
    If problems exist in the provisioning network, fix them.
  8. If the problem persists, run savelogs (see Saving Logs Using the EPAP GUI), and contact My Oracle Support.

4.6.15 4000000000010000 - PDBA Connection Failure

The local EPAP RTDB process cannot connect to the local PDBA.

Recovery

  1. Log in to the User Interface screen of the EPAP (see Accessing the EPAP GUI).
  2. Check the banner information above the menu to verify that you are logged into the problem EPAP indicated in the UAM.
    Select Select Mate if necessary to switch to the problem EPAP.
  3. Perform Restarting the EPAP and PDBA.
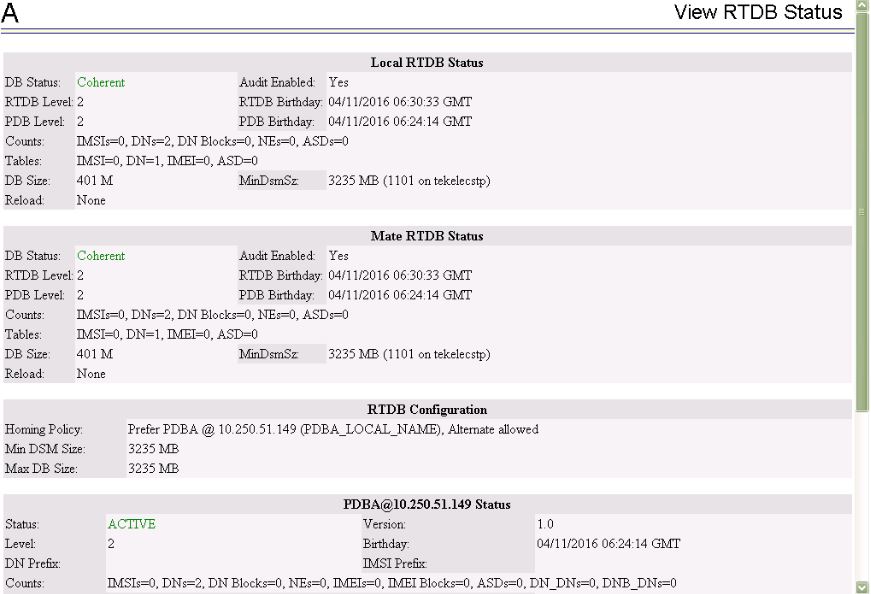
  4. Select RTDB>View RTDB Status and determine the homing policy for the PDBA.
    In the example shown in Figure 4-12, the Homing Policy shows that the Standby PDB is preferred for homing.

    Figure 4-12 Determining the Homing Policy

    Determining the Homing Policy
  5. At the EPAP indicated by the Homing Policy, repeat 3 and 5 to restart the PDBA.
  6. If the problem persists, run savelogs (see Saving Logs Using the EPAP GUI), and contact My Oracle Support.

4.6.16 4000000000020000 - PDBA Replication Failure

Provisioning data is no longer being exchanged from the Active PDB to the Standby PDB.

  1. Run savelogs (see Saving Logs Using the EPAP GUI).
  2. Contact My Oracle Support.

4.6.17 4000000000040000 - RTDB DSM Over-Allocation

At least one Service Module card in the attached EAGLE has insufficient memory to provision the RTDB entry. No more provisioning will be allowed to the RTDB until this issue is resolved.

Recovery

  1. Install Service Module cards in the attached EAGLE with sufficient memory to accommodate the expected size of the RTDB.
  2. Contact My Oracle Support for assistance.

4.6.18 4000000000080000 - RTDB Maximum Depth Reached

For ELAP 7.0 or earlier, this alarm indicates that the maximum depth has been reached for a tree. If the alarm was initiated during a data update, the update will continually fail until there is manual intervention. RTDB data is stored as inverse tree structures. The trees have a maximum depth allowed.

This alarm indicates that the maximum depth has been reached for a tree. If the alarm was initiated during a data update, the update will continually fail until there is manual intervention. RTDB data is stored as inverse tree structures. The trees have a maximum depth allowed.

Recovery

  1. Contact My Oracle Support.

4.6.19 4000000000100000 - No PDBA Proxy to Remote PDBA Connection

This message indicates that the PDBA Proxy feature is disabled or the software is down.

Recovery

  1. Log in to the User Interface screen of EPAP A (see Accessing the EPAP GUI)
  2. Refer to the LNP Database Synchronization Manual for the correct procedures.
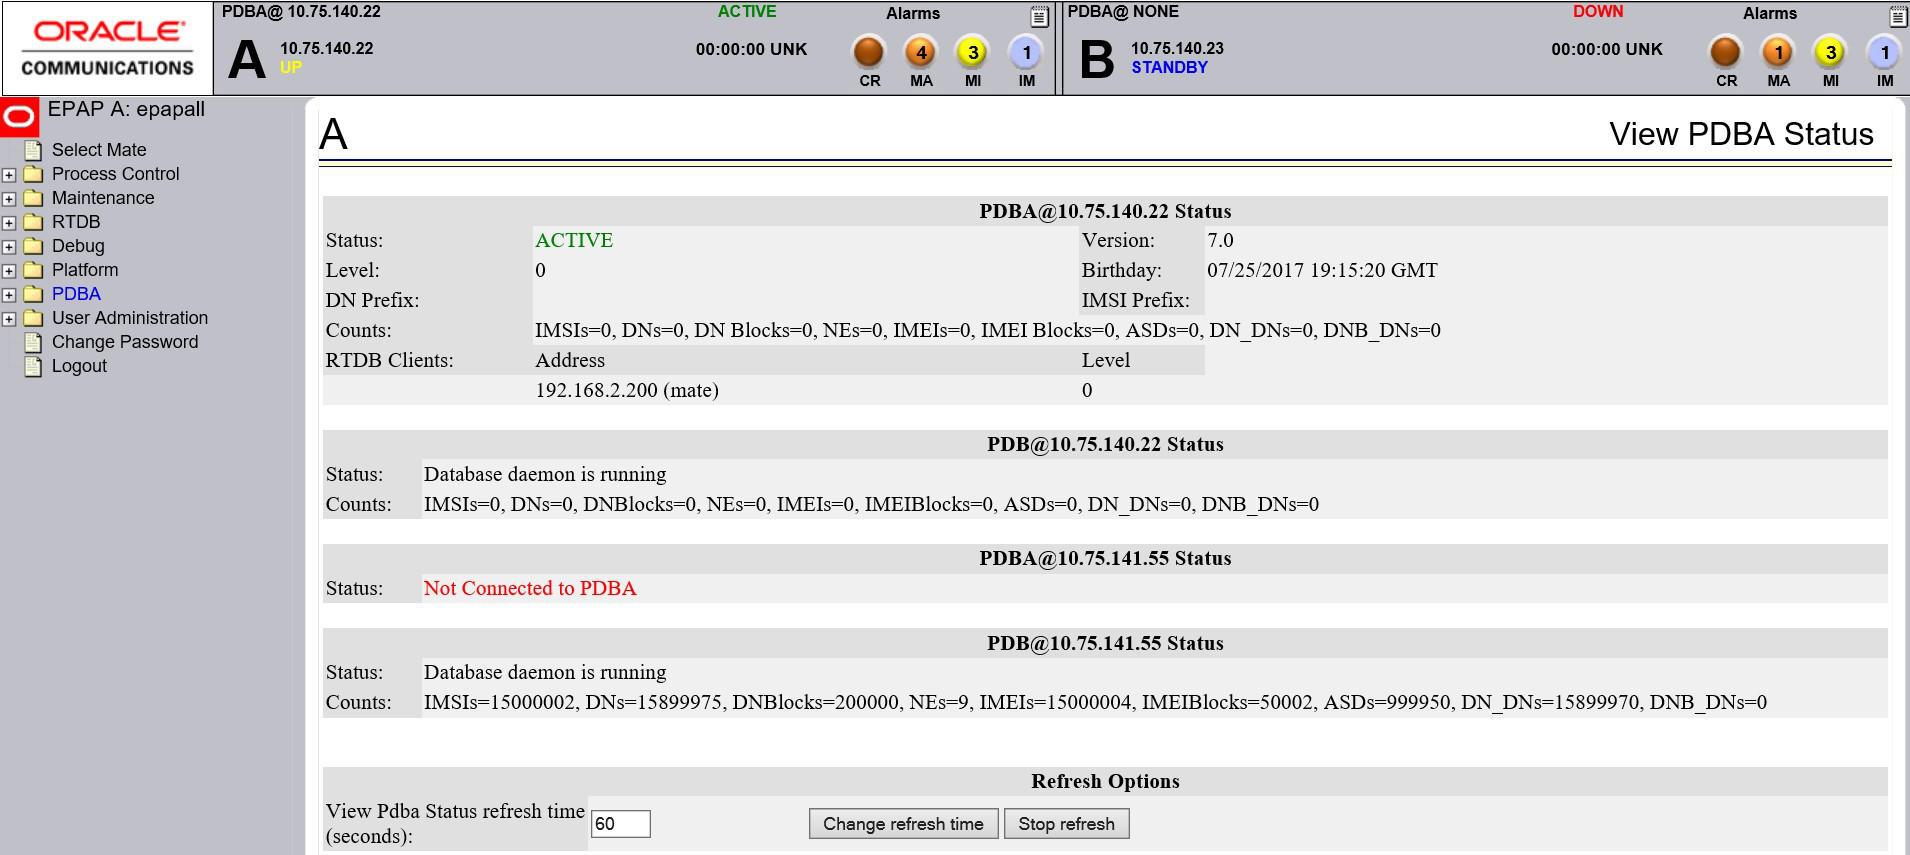
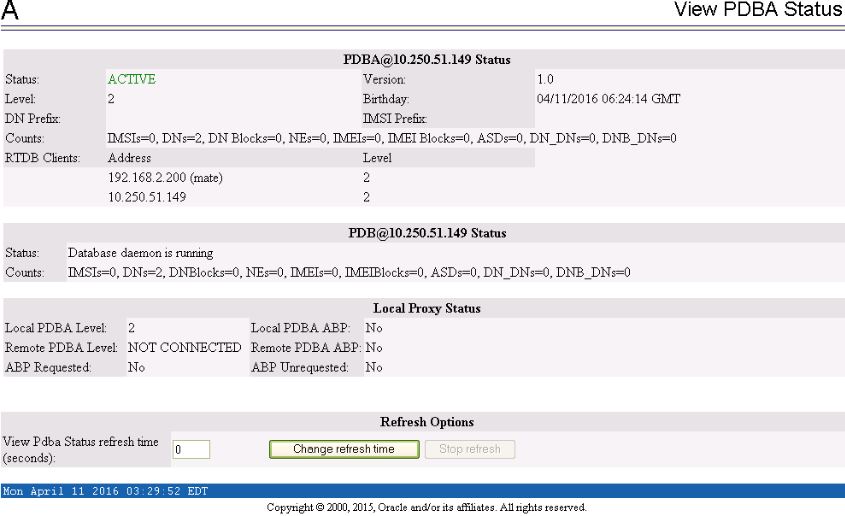
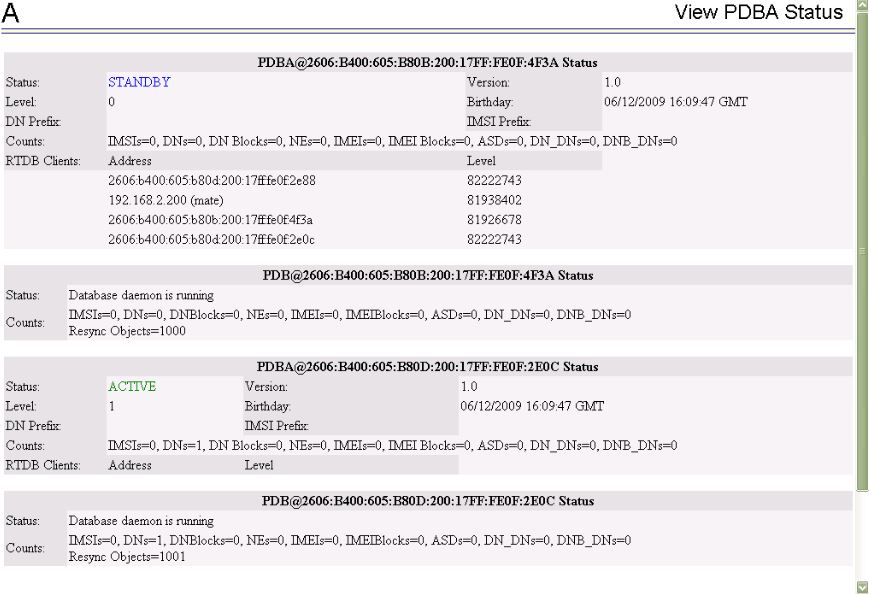
  3. Select PDBA>View PDBA Status to verify that the PDBA proxy feature is enabled.
    The Local Proxy Status items only appear if the PDBA Proxy feature is enabled (See Figure 4-13).

    Figure 4-13 View PDBA Status Screen

    View PDBA Status Screen
  4. Refer to Restarting the EPAP and PDBA to restart the PDBA.
  5. If the problem persists, capture the log files on both EPAPs (see Saving Logs Using the EPAP GUI) and contact My Oracle Support.

4.6.20 4000000000200000 - DSM Provisioning Error

A coherent SM RTDB is more than 1000 levels behind the EPAP RTDB.

Recovery

  1. Monitor this situation.
    If it does not improve, contact My Oracle Support for guidance.

4.6.21 4000000000800000 - EPAP State Changed to UP

The standby EPAP state was changed from STANDBY to UP.

Recovery

  1. Restart the EPAP software.

  2. If the standby EPAP state is not changed back to STANDBY, capture the log files on both EPAPs (see Saving Logs Using the EPAP GUI) and contact My Oracle Support.

4.6.22 4000000004000000 - RTDB Overallocated

At least one Service Module card in the attached EAGLE has insufficient memory to provision the RTDB entry. No more provisioning will be allowed to the RTDB until this issue is resolved.

This error can result from one of the following conditions on the EAGLE:

  • The EPAP Data Split feature is not ON
  • The epap240m STP option is not ON (E5-SM8G-B card required)
  • The 120M DN and 120M IMSIs via split database feature is OFF at EPAP and OFF at Eagle
  • The 120M DN and 120M IMSIs via split database feature is OFF at EPAP and ON at Eagle

Recovery

  1. On the EAGLE, turn ON the optional EPAP Data Split feature to allow more room for the provisioned data.
  2. On the EAGLE, turn ON the epap240m STP option (E5-SM8G-B card required) to allow more room for the provisioned data.
  3. Turn ON the optional 120M DN and 120M IMSIs via Split database feature on the EPAP and Eagle to allow more room for the provisioned data.
  4. Contact My Oracle Support for assistance.

4.6.23 4000000020000000 - Mysql Lock Wait Timeout Exceeded

If MySQL is not able to get a lock to write to the PDB table, then an alarm is raised after 15 minutes when the lock wait timeout is exceeded.

Occasionally, a transaction can hang for a longer time, particularly in a multi-threaded environment, and also due to some underlying hardware failure on the disk, kernel bugs, and so on.

Recovery

Restart the PDB software.

4.7 Minor Platform Alarms

Minor platform alarms involve disk space, application processes, RAM, and configuration errors.

4.7.1 32500 5000000000000001 – Server Disk Space Shortage Warning

Alarm Type: TPD

Description: This alarm indicates that one of the following conditions has occurred:
  • A file system has exceeded a warning threshold, which means that more than 80% (but less than 90%) of the available disk storage has been used on the file system.
  • More than 80% (but less than 90%) of the total number of available files have been allocated on the file system.

Severity: Minor

OID: 1.3.6.1.4.1.323.5.3.18.3.1.3.1

Alarm ID: TKSPLATMI15000000000000001

Recovery

  1. Examine the syscheck output to determine if the file system /var/TKLC/epap/free/var/TKLC/elap/free is low on space. If so, continue to step 2a; otherwise skip to step 3.
  2. Delete unnecessary files, as follows, to free up space on the free partition:
    1. Log in to the EPAP GUI (see Accessing the EPAP GUI)
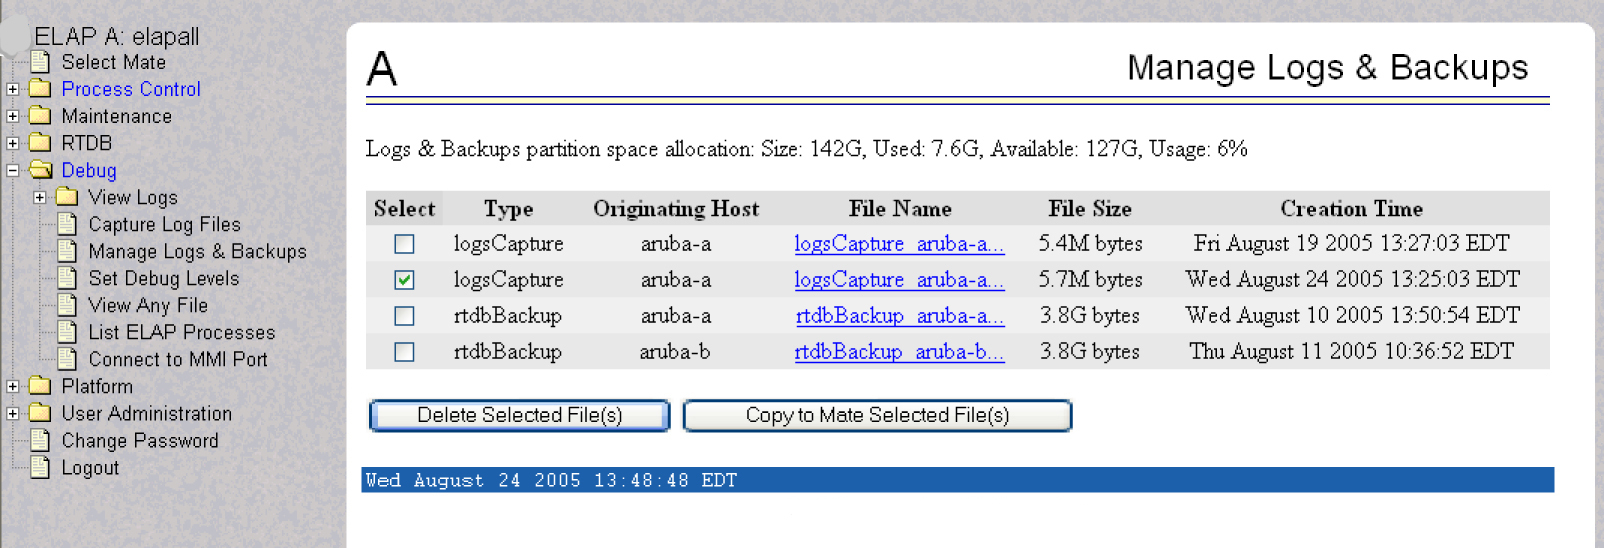
    2. Select Debug>Manage Logs & Backups.

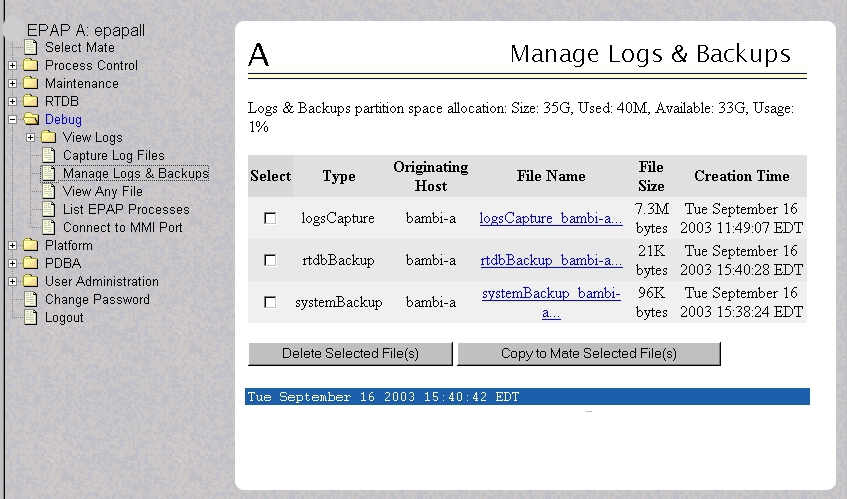
      A screen similar to Figure 4-14 displays. This screen displays the information about the total amount of space allocated for, and the amount of space currently used by logs and backups, and it lists logs and backup files that you might choose to delete, freeing up additional disk space.

      Figure 4-14 Manage Logs and Backups

      Manage Logs and BackupsManage Logs and Backups
    3. Click the checkbox of each file that you want to delete and then click Delete Selected File(s).
  3. Contact My Oracle Support, and provide the system health check output.

4.7.2 32501 5000000000000002 – Server Application Process Error

Alarm Type: TPD

Description: This alarm indicates that either the minimum number of instances for a required process are not currently running or too many instances of a required process are running.

Severity: Minor

OID: 1.3.6.1.4.1.323.5.3.18.3.1.3.2

Alarm ID: TKSPLATMI25000000000000002

Recovery

  1. Run syscheck in verbose mode (see procedure Run Syscheck Manually)
  2. Contact My Oracle Support, and provide the system health check output.
  3. Contact My Oracle Support.
  4. If a 32305 3000000000000020 - Server Platform Process Error alarm is also present, execute the recovery procedure associated with that alarm before proceeding.
  5. Log in to the User Interface screen of the EPAPGUI (see Accessing the EPAP GUI)
  6. Check the banner information above the menu to verify that you are logged into the problem EPAP indicated in the UAM.

    If it is necessary to switch to the other side, select Select Mate.

  7. Open the Process Control folder, and select the Stop Software menu item.
  8. Open the Process Control folder, and select the Start Software menu item.
  9. Capture the log files on both EPAPs (see Saving Logs Using the EPAP GUI) and contact My Oracle Support.

4.7.3 5000000000000004 - Server Hardware Configuration Error

This alarm indicates that one or more of the server’s hardware components are not in compliance with proper specifications (refer to Application B Card Hardware and Installation Guide.

Recovery

  1. Run syscheck in verbose mode.
  2. Call My Oracle Support for assistance.

4.7.4 32506 5000000000000040 – Server Default Router Not Defined

Alarm Type: TPD

Description: This alarm indicates that the default network route is either not configured or the current configuration contains an invalid IP address or hostname.

Caution:

When changing the server’s network routing configuration it is important to verify that the modifications will not impact the method of connectivity for the current login session. It is also crucial that this information not be entered incorrectly or set to improper values. Incorrectly modifying the server’s routing configuration may result in total loss of remote network access.

Severity: Minor

OID: 1.3.6.1.4.1.323.5.3.18.3.1.3.7

Alarm ID: TKSPLATMI75000000000000040

Recovery

  1. Run syscheck in verbose mode (see procedure Running the System Health Check).
  2. Contact My Oracle Support, and provide the system health check output.
  3. To define the default router:
    1. Obtain the proper Provisioning Network netmask and the IP address of the appropriate Default Route on the provisioning network.
      These are maintained by the customer network administrators.
    2. Log in to the server with username epapconfig (see Accessing the EPAP GUI).

      The server designation at this site is displayed, as well as hostname, hostid, Platform Version, Software Version, and the date. Ensure that the side displayed is the server that is reporting the problem. In the following example, it is server A.

    3. Enter option 2, Configure Network Interfaces Menu, from the EPAP Configuration Menu.
      
      MPS Side A:  hostname: mpsa-d1a8f8  hostid: 80d1a8f8
                   Platform Version: x.x.x-x.x.x
                   Software Version: EPAP x.x.x-x.x.x
                   Wed Jul 17 09:51:47 EST 2002
       /-------EPAP Configuration Menu--------\
      /----------------------------------------\
      |  1 | Display Configuration             |
      |----|-----------------------------------|
      |  2 | Configure Network Interfaces Menu |
      |----|-----------------------------------|
      |  3 | Set Time Zone                     |
      |----|-----------------------------------|
      |  4 | Exchange Secure Shell Keys        |
      |----|-----------------------------------|
      |  5 | Change Password                   |
      |----|-----------------------------------|
      |  6 | Platform Menu                     |
      |----|-----------------------------------|
      |  7 | Configure NTP Server              |
      |----|-----------------------------------|
      |  8 | PDB Configuration Menu            |
      |----|-----------------------------------|
      |  9 | Security                          |
      |----|-----------------------------------|
      | 10 | SNMP Configuration                |
      |----|-----------------------------------|
      | 11 | Configure Alarm Feed              |
      |----|-----------------------------------|
      | 12 | Configure Query Server            |
      |----|-----------------------------------|
      | 13 | Configure Query Server Alarm Feed |
      |----|-----------------------------------|
      | 14 | Configure SNMP Agent Community    |
      |----|-----------------------------------|
      |  e | Exit                              |
      \----------------------------------------/
      Enter Choice:  2
      
    4. Enter option 1, Configure Provisioning Network from the Configure Network Interfaces Menu.
      This displays the following submenu for configuring communications networks and other information.
      MPS Side A:  hostname: EPAP17  hostid: f80a110f
                   Platform Version: 6.0.2-7.0.3.0.0_86.45.0
                   Software Version: EPAP 161.0.28-16.1.0.0.0_161.28.0
                   Wed Jun 15 01:33:55 EDT 2016
      
      /-----Configure Network Interfaces Menu----\
      /--------------------------------------------\
      |  1 | Configure Provisioning Network        |
      |----|---------------------------------------|
      |  2 | Configure Sync Network                |
      |----|---------------------------------------|
      |  3 | Configure DSM Network                 |
      |----|---------------------------------------|
      |  4 | Configure Backup Provisioning Network |
      |----|---------------------------------------|
      |  5 | Configure Static NAT Addresses        |
      |----|---------------------------------------|
      |  6 | Configure Provisioning VIP Addresses  |
      |----|---------------------------------------|
      |  e | Exit                                  |
      \--------------------------------------------/
      
      Enter choice:  1
      
    5. Enter option 1, IPv4 Configuration (or option 2, IPv6 Configuration), from the Configure Network Interfaces Menu.
      MPS Side A:  hostname: EPAP17  hostid: f80a110f
                  Platform Version: 6.0.2-7.0.3.0.0_86.45.0
                  Software Version: EPAP 161.0.28-16.1.0.0.0_161.28.0
                  Wed Jun 15 01:33:56 EDT 2016
      
      /-----Configure Provisioning Network Menu-\
      /-------------------------------------------\
      |  1 | IPv4 Configuration                   |
      |----|--------------------------------------|
      |  2 | IPv6 Configuration                   |
      |----|--------------------------------------|
      |  e | Exit                                 |
      \-------------------------------------------/
      
      Enter Choice:  1
      
      The following warning appears:
      
      EPAP software and PDBA are running. Stop them? [N] 
      
    6. Type Y and press Enter.
      The EPAP A provisioning network IP address displays:
      
      Verifying connectivity with mate ...
      Enter the EPAP A provisioning network IP Address [192.168.61.90]:
      
    7. Press Enter after each address is displayed until the Default Route address displays:
      
      Verifying connectivity with mate ...
      Enter the EPAP A provisioning network IP Address [192.168.61.90]: 
      Enter the EPAP B provisioning network IP Address [192.168.61.91]: 
      Enter the EPAP provisioning network netmask [255.255.255.0]: 
      Enter the EPAP provisioning network default router IP Address: 192.168.61.250
      
    8. If the default router IP address is incorrect, correct it, and press Enter.
    9. After you have verifying or correcting the Provisioning Network configuration information, enter e to return to the Configure Network Interfaces Menu.
    10. Enter e again to return to the EPAP Configuration Menu.
  4. Run syscheck again. If the alarm has not been cleared, go to 6
  5. Run savelogs to gather all application logs, (see Saving Logs Using the EPAP GUI).
  6. Contact My Oracle Support.

4.7.5 32507 5000000000000080 – Server Temperature Warning

Alarm Type: TPD

Description: This alarm indicates that the internal temperature within the server is outside of the normal operating range. A server Fan Failure may also exist along with the Server Temperature Warning.

Severity: Minor

OID: tpdTemperatureWarningNotify 1.3.6.1.4.1.323.5.3.18.3.1.3.8

Alarm ID: TKSPLATMI85000000000000080

Recovery

  1. Ensure that nothing is blocking the fan's intake. Remove any blockage.
  2. Verify that the temperature in the room is normal. If it is too hot, lower the temperature in the room to an acceptable level.

    Table 4-3 Server Environmental Conditions

    Ambient Temperature

    Operating: 5 degrees C to 40 degrees C

    Exceptional Operating Limit: 0 degrees C to 50 degrees C

    Storage: -20 degrees C to 60 degrees C

    Relative Humidity

    Operating: 5% to 85% non-condensing

    Storage: 5% to 950% non-condensing

    Elevation

    Operating: -300m to +300m

    Storage: -300m to +1200m

    Heating, Ventilation, and Air Conditioning

    Capacity must compensate for up to 5100 BTUs/hr for each installed frame.

    Calculate HVAC capacity as follows:

    Determine the wattage of the installed equipment. Use the formula: watts x 3.143 = BTUs/hr

    Note:

    Be prepared to wait the appropriate period of time before continuing with the next step. Conditions need to be below alarm thresholds consistently for the alarm to clear. The alarm may take up to five minutes to clear after conditions improve. It may take about ten minutes after the room returns to an acceptable temperature before syscheck shows the alarm cleared.
  3. Verify that the temperature in the room is normal. If it is too hot, lower the temperature in the room to an acceptable level.

    Note:

    Be prepared to wait the appropriate period of time before continuing with the next step. Conditions need to be below alarm thresholds consistently for the alarm to clear. It may take about ten minutes after the room returns to an acceptable temperature before the alarm cleared.
  4. Run syscheck Check to see if the alarm has cleared
    • If the alarm has been cleared, the problem is resolved.
    • If the alarm has not been cleared, continue with the next step.
  5. Replace the filter (refer to the appropriate hardware manual).

    Note:

    Be prepared to wait the appropriate period of time before continuing with the next step. Conditions need to be below alarm thresholds consistently for the alarm to clear. It may take about ten minutes after the filter is replaced before the alarm cleared.
  6. Run syscheck Check to see if the alarm has cleared
    • If the alarm has been cleared, the problem is resolved.
    • If the alarm has not been cleared, continue with the next step.
  7. If the problem has not been resolved, contact My Oracle Support and provide the system health check output.
  8. If the problem has not been resolved, contact My Oracle Support.

4.7.6 32508 5000000000000100 – Server Core File Detected

Alarm Type: TPD

Description: This alarm indicates that an application process has failed and debug information is available.

Severity: Minor

OID: tpdCoreFileDetectedNotify 1.3.6.1.4.1.323.5.3.18.3.1.3.9

Alarm ID: TKSPLATMI95000000000000100

Recovery

  1. Run syscheck in verbose mode.
  2. Run savelogs to gather system information (see Saving Logs Using the EPAP GUI)
  3. Contact Customer Care Center.

    Note:

    There is a special case of heartbeat process aborting and producing core file not as a result of a bug, but as an expected and intentional response of the process to unexpected activity on the network connecting the cluster nodes. Example of such activity could be switch configuration being performed during the time cluster nodes are trying to, or already are coupled together. To recognize such a case, the investigator first needs to find out if the core file was produced by the heartbeat process:

    1. Inspect syscheck verbose output, and look for "core" module. The output would be similar to following:
           core: Checking for core files.     core: There are core files on the system:     core:     CORE DIR: /var/TKLC/core     core:         CORE: core.heartbeat.<pid>     core:         CORE: core.heartbeat.<pid>.bt *     core: FAILURE:: MINOR::5000000000000100 -- Server Core File Detected
      There, investigator finds out there is a core file named core.heartbeat.<pid>, where <pid> is the process ID of the failed heartbeat process.
    2. If heartbeat core file was found, the investigator must get the backtrace of the process from the core file by running command:
      gdb /usr/lib/hearbeat/heartbeat /var/TKLC/core/core.heartbeat.<pid>
      Once in gdb shell, entering bt. The output would be similar to the following:
      (gdb) bt #0 0x00002b872c2c0215 in raise () from /lib64/libc.so.6 #1 0x00002b872c2c1cc0 in abort () from /lib64/libc.so.6 #2 0x000000000040b20c in update_ackseq () #3 0x000000000040d225 in send_cluster_msg () #4 0x000000000040d8d7 in send_local_status () #5 0x000000000040da63 in hb_send_local_status () #6 0x00002b872b2733d7 in Gmain_timeout_dispatch (src=0x13b66bc8, func=0x40da40 , user_data=0x0) at GSource.c:1570 #7 0x00002b872b8bbdb4 in g_main_context_dispatch () from /lib64/libglib-2.0.so.0 #8 0x00002b872b8bec0d in ?? () from /lib64/libglib-2.0.so.0 #9 0x00002b872b8bef1a in g_main_loop_run () from /lib64/libglib-2.0.so.0 #10 0x000000000040e8de in initialize_heartbeat () #11 0x000000000040f235 in main ()
      The investigator is concerned in lines beginning with #0 through #5, where, in the fourth column, after the word "in", are listed function names called within the heartbeat process. If the order of called functions is the same as in the example above (i.e., raise on line #0) then abort, update_ackseq, send_cluster_msg, send_local_status, and hb_send_local_status on line #5, it is likely that the special case occurred. If such a case was recognized, the investigator can safely delete files /var/TKLC/core/core.heartbeat.<pid> and /var/TKLC/core/core.heartbeat.<pid>.bt and then clear the alarm itself by calling alarmMgr - -clear TKSPLATMI9.

    They will examine the files in /var/TKLC/core and remove them after all information has been extracted.

4.7.7 32509 5000000000000200 – Server NTP Daemon Not Synchronized

Alarm Type: TPD

Description: This alarm indicates that the NTP daemon (background process) has been unable to locate a server to provide an acceptable time reference for synchronization.

Severity: Minor

OID: tpdNTPDeamonNotSynchronizedNotify 1.3.6.1.4.1.323.5.3.18.3.1.3.10

Alarm ID: TKSPLATMI105000000000000200

Recovery

  1. Contact My Oracle Support.

4.7.8 32511 5000000000000800 – Server Disk Self Test Warning

Alarm Type: TPD

Description: A non-fatal disk issue exists.

Severity: Minor

OID: tpdSmartTestWarnNotify 1.3.6.1.4.1.323.5.3.18.3.1.3.12

Alarm ID: TKSPLATMI125000000000000800

Recovery

  1. Contact My Oracle Support.

4.7.9 32514 5000000000004000 – Server Reboot Watchdog Initiated

Alarm Type: TPD

Description: This alarm indicates that the hardware watchdog was not strobed by the software and so the server rebooted the server. This applies to only the last reboot and is only supported on a T1100 application server.

Severity: Minor

OID: tpdWatchdogRebootNotify 1.3.6.1.4.1.323.5.3.18.3.1.3.15

Alarm ID: TKSPLATMI155000000000004000

Recovery

  1. Contact My Oracle Support.

4.7.10 32518 5000000000040000 – Platform Health Check Failure

Alarm Type: TPD

Description: This alarm is used to indicate a syscheck configuration error.

Severity: Minor

OID: tpdPlatformHealthCheckFailedNotify 1.3.6.1.4.1.323.5.3.18.3.1.3.19

Alarm ID: TKSPLATMI195000000000040000

Recovery

  1. Contact My Oracle Support.

4.7.11 32519 5000000000080000 – NTP Offset Check Failed

Alarm Type: TPD

Description: This minor alarm indicates that time on the server is outside the acceptable range (or offset) from the NTP server. The Alarm message will provide the offset value of the server from the NTP server and the offset limit that the application has set for the system.

Severity: Minor

OID: ntpOffsetCheckFailedNotify 1.3.6.1.4.1.323.5.3.18.3.1.3.20

Alarm ID: TKSPLATMI205000000000080000

Recovery

  1. Contact My Oracle Support.

4.7.12 32520 5000000000100000 – NTP Stratum Check Failed

Alarm Type: TPD

Description: This alarm indicates that NTP is syncing to a server, but the stratum level of the NTP server is outside of the acceptable limit. The Alarm message will provide the stratum value of the NTP server and the stratum limit that the application has set for the system.

Severity: Minor

OID: NtpStratumCheckFailedNotify 1.3.6.1.4.1.323.5.3.18.3.1.3.21

Alarm ID: TKSPLATMI215000000000100000

Recovery

  1. Contact My Oracle Support.

4.7.13 325295000000020000000 – Server Kernel Dump File Detected

Alarm Type: TPD

Description: This alarm indicates that the kernel has crashed and debug information is available.

Severity: Minor

OID: 1.3.6.1.4.1.323.5.3.18.3.1.3.30

Alarm ID: TKSPLATMI305000000020000000

Recovery

  1. Run syscheck in Verbose mode (see Running the System Health Check).
  2. Contact My Oracle Support.

4.7.14 325305000000040000000 – TPD Upgrade Failed

Alarm Type: TPD

Description: This alarm indicates that a TPD upgrade has failed.

Severity: Minor

OID: tpdServerUpgradeFailDetectedNotify 1.3.6.1.4.1.323.5.3.18.3.1.3.31

Alarm ID: TKSPLATMI315000000040000000

Recovery

  1. Run the following command to clear the alarm.
    /usr/TKLC/plat/bin/alarmMgr –clear TKSPLATMI31
  2. Contact My Oracle Support.

4.7.15 325315000000080000000– Half Open Socket Warning

Alarm Type: TPD

This alarm indicates that the number of half open TCP sockets has reached the major threshold. This problem is caused by a remote system failing to complete the TCP 3-way handshake.

Severity: Minor

Instance: May include AlarmLocation, AlarmId, AlarmState, AlarmSeverity, and bindVarNamesValueStr

HA Score: Normal

Auto Clear Seconds: 0 (zero)

OID: eagleXgDsrTpdHalfOpenSocketWarningNotify1.3.6.1.4.1.323.5.3.18.3.1.3.32

Alarm ID: TKSPLATMI325000000080000000

Recovery

  1. Contact My Oracle Support.

4.7.16 5000000100000000 – Server Upgrade Pending Accept/Reject

Alarm Type: TPD

Description: This alarm is generated if an upgrade is not accepted or rejected after the upgrade.

Severity: Minor

OID: 1.3.6.1.4.1.323.5.3.18.3.1.3.33

Alarm ID: TKSPLATMI33

Alarm Value: 5000000100000000

Recovery

To clear this alarm, the upgrade should be accepted/rejected via the platcfg menu.

4.7.17 5000004000000000 - Platform Data Collection Error

Alarm Type: TPD

Description: Platform Data Collection Error

Severity: Minor

OID: tpdPdcError

Alarm ID: 5000004000000000

Recovery

  1. Contact My Oracle Support.

4.8 Minor Application Alarms

Minor application alarms involve the EPAP RMTP channels, RTDB capacity, and software errors.

4.8.1 6000000000000001 - RMTP Channel A Down

Channel A of the IP multicast mechanism is not available.

Recovery

  1. Check the physical connections between the local EPAPs, and the EPAPs and the Service Module cards on the EAGLE. Make sure that the connectors are firmly seated.
  2. Run syscheck (see Running the System Health Check)

    If you cannot log in, go to 3.

  3. Perform Restarting the EPAP Software.
  4. Capture the log files on both EPAPs (see Saving Logs Using the EPAP GUI”)
  5. Contact My Oracle Support.

4.8.2 6000000000000002 - RMTP Channel B Down

Channel B of the IP multicast mechanism is not available.

Recovery

  1. Check the physical connections between the local EPAPs, and the EPAPs and the Service Module cards on the EAGLE.

    Make sure the connectors are firmly seated.

  2. Run syscheck (see Running the System Health Check).

    If you cannot log in, go to 4.

  3. Perform Restarting the EPAP Software.
  4. Capture the log files on both EPAPs (see Saving Logs Using the EPAP GUI).
  5. Contact My Oracle Support.

4.8.3 6000000000000008 - RTDB 80% Full

For ELAP 7.0 or earlier, the RTDB on the EPAP or DSM is approaching capacity (80%).

The RTDB on the EPAP or DSM is approaching capacity (80%).

This error can result from one of the following conditions on the EAGLE:

  • The EPAP Data Split feature is not ON
  • The epap240m STP option is not ON (E5-SM8G-B card required)
  • The 120M DN and 120M IMSIs via split database feature is OFF at EPAP and OFF at Eagle
  • The 120M DN and 120M IMSIs via split database feature is OFF at EPAP and ON at Eagle

Recovery

  1. On the EAGLE, turn ON the optional EPAP Data Split feature to allow more room for the provisioned data.
  2. On the EAGLE, turn ON the epap240m STP option (E5-SM8G-B card required) to allow more room for the provisioned data.
  3. Turn ON the optional 120M DN and 120M IMSIs via Split database feature on the EPAP and Eagle to allow more room for the provisioned data.
  4. Contact My Oracle Support for assistance.

4.8.4 6000000000000010 - Minor Software Error

A minor software error has been detected.

Recovery

  1. Run syscheck.
  2. Contact My Oracle Support.

    Have the system health check data available.

4.8.5 6000000000000020 - Standby PDBA Falling Behind

This is an indication that there is a congestion condition affecting updates to the standby PDBA. The amount of time between an update being committed in the Active PDB and the same update being committed in the Standby PDB has reached an unacceptable level.

The EPAP attempts to automatically recover from this situation. This error can result from one of the following conditions:
  • Provisioning activity is very heavy
  • The provisioning network is experiencing errors or latency
  • Server maintenance functions (such as backups, restores, imports, exports, etc) are occurring

Recovery

  1. Periodically, verify that the level of the standby PDBA is catching up by selecting PDBA>View PDBA Status and comparing the Level of the Standby PDBA (on EPAP A in the example shown in Figure 4-15) to the Level of the Active PDBA (on EPAP B in the example).

    Figure 4-15 View PDBA Status

    View PDBA Status
  2. If the problem persists for more than two hours, run savelogs (see Saving Logs Using the EPAP GUI), and contact My Oracle Support for assistance.
  3. Login to the User Interface screen of the EPAP GUI as any user who has permission to use the Set Log Levels menu item.
  4. Select PDBA> Maintenance> Logs> Set Log Levels.
    The Set PDBA Log Info Levels screen displays, as shown in Figure 4-16.

    Figure 4-16 Set PDBA Log Info Levels

    Set PDBA Log Info Levels
  5. Verify that the Log Levels match the Log Levels of the MPS on the mated EAGLE STP.
    Figure 4-16 shows the usual settings. Correct log levels if necessary.
  6. If adjustments are necessary, it is recommended that the Command Log debug level and the Debug Log debug level are lowered before adjusting the Error Log debug level.

4.8.6 6000000000000040 - RTDB Tree Error

For ELAP 7.0 or earlier, this alarm indicates either that the depth is greater than the theoretical maximum or that some other general problem has been found with a tree. RTDB data is stored as inverse tree structures. The trees have maximum theoretical depths based on the number of records in the tree.

This alarm indicates either that the depth is greater than the theoretical maximum or that some other general problem has been found with a tree. RTDB data is stored as inverse tree structures. The trees have maximum theoretical depths based on the number of records in the tree.

Recovery

  1. Contact My Oracle Support.

4.8.7 6000000000000080 - PDB Backup failed

The PDB backup failed because of at least one of the following conditions:

  • A manual backup script was not able to create PDB backup successfully

  • A PDB backup was already in progress when Automatic PDB backup attempted to start

  • A PDB restore was in progress when the Automatic PDB backup attempted to start

To verify the exact failure condition, refer to the error string in the log file.

Note:

This alarm will also clear if the Automatic PDB/RTDB backup executes successfully during the next scheduled backup time.

Recovery

  1. To clear this alarm immediately, perform one of the following:
    • Cancel the Automatic PDB / RTDB backup via the EPAP GUI as follows:

      Note:

      Automatic PDB / RTDB Backup will have to be rescheduled if it is cancelled.
      1. Log in to the User Interface screen of the EPAP GUI (see Accessing the EPAP GUI).

      2. From the menu, select Maintenance>Automatic PDB/RTDB Backup to display the automatic backup screen.

      3. From the Automatic PDB/RTDB Backup screen, select None as the Backup Type.

      4. Select the Schedule Backup button to complete the cancellation.

        Automatic PDB/RTDB Backup will have to be rescheduled. Refer to Administration Guide to reschedule the Automatic PDB / RTDB Backup.

    • Perform a manual backup via the EPAPGUI (see Backing Up the PDB).

4.8.8 6000000000000100 - Automatic PDB Backup failed

The PDB backup failed because of at least one of the following conditions:

  • The mate machine was not reachable.

  • The SCP command to transfer of PDB backup file to mate fails

  • The transfer of Automatic PDB Backup to Mate fails

  • The transfer of Automatic PDB Backup to mate failed due to disk space shortage on mate

  • The remote machine was not reachable

  • The connection to remote host failed for SFTP of the PDB Backup file

  • The SFTP to the remote host failed for Automatic PDB Backup

  • The login or password configured for the Remote machine is wrong for the configured user

  • The Destination File Path to store the PDB Backup file in Remote machine configured by the user does not exist

  • The transfer of the Automatic PDB Backup to the remote failed due to disk space shortage on the remote

To verify the exact failure condition, refer to the error string in the log file.

Note:

This alarm will clear if the Automatic PDB / RTDB backup executes successfully during the next scheduled backup time.

Recovery

To clear this alarm immediately, cancel the Automatic PDB/RTDB backup via the EPAPGUI, as described in 1 through 4.

Note:

Automatic PDB/RTDB Backup will have to be rescheduled if it is cancelled.
  1. Log in to the User Interface screen of the EPAP GUI (see Accessing the EPAP GUI).
  2. From the menu, select Maintenance>Automatic PDB/RTDB Backup to display the Automatic PDB/RTDB Backup screen.
  3. From the Automatic PDB/RTDB Backup screen, select None as the Backup Type.
  4. Select the Schedule Backup button to complete the cancellation.

    Note:

    Automatic PDB/RTDB Backup will have to be rescheduled. Refer to Administration Guide to reschedule the Automatic PDB/RTDB Backup.

4.8.9 6000000000000200 - RTDB Backup failed

The RTDB backup failed because of at least one of the following conditions:

  • The manual backup script (backupRtdb.pl) was not able to create RTDB Backup successfully.

  • The EPAP software could not be successfully stopped in order for Automatic RTDB Backup to start.

  • Another user has already stopped the EPAP Software before the script stops the EPAP Software for Automatic RTDB Backup

  • Another user is currently stopping the EPAP Software. The Automatic RTDB Backup script cannot stop the EPAP Software.

  • The GUI Server returned an error when trying to get a lock from it for Automatic RTDB Backup.

  • Not able to connect to GUI server for Automatic RTDB Backup

  • The EPAP software was not running when it was to be stopped for Automatic RTDB Backup

  • The mate machine is not reachable.

To verify the exact failure condition, refer to the error string in the log file.

Note:

This alarm will clear if the Automatic PDB/RTDB backup executes successfully during the next scheduled backup time.

Recovery

  1. To clear this alarm immediately, perform one of the following:
    • Cancel the Automatic PDB/RTDB backup in the EPAP GUI.

      Note:

      Automatic PDB/RTDB Backup will have to be rescheduled if it is cancelled.
      1. Log in to the User Interface screen of the EPAP GUI (see Accessing the EPAP GUI).

      2. From the menu, select Maintenance>Automatic PDB/RTDB Backup to display the Automatic PDB/RTDB Backup screen.

      3. From the Automatic PDB/RTDB Backup screen, select None as the Backup Type.

      4. Select the Schedule Backup button to complete the cancellation. Automatic PDB/RTDB Backup will have to be rescheduled. Refer to Administration Guide to reschedule the Automatic PDB/RTDB Backup.

    • Perform a manual backup via the EPAP GUI as described in Backing Up the RTDB.

4.8.10 6000000000000400 - Automatic RTDB Backup failed

The RTDB backup failed because of at least one of the following conditions:

  • The mate machine is not reachable.

  • Automatic RTDB Backup file transfer to the Mate failed.

  • Unable to connect to Remote host IP Address for Automatic RTDB Backup.

  • Automatic RTDB Backup file transfer to the Remote failed.

  • The incorrect login or password configured for Automatic RTDB Backup.

  • The destination path does not exist in remote machine IP Address for Automatic RTDB Backup.

To verify the exact failure condition, refer to the error string in the log file.

Note:

This alarm will clear if the Automatic PDB/RTDB backup executes successfully during the next scheduled backup time.

Recovery

To clear this alarm immediately, cancel the Automatic PDB / RTDB backup in the EPAP GUI as described in 1 through 4.

Note:

Automatic PDB/RTDB Backup will have to be rescheduled if it is cancelled.
  1. Log in to the User Interface screen of the EPAP GUI (see Accessing the EPAP GUI).
  2. From the menu, select Maintenance>Automatic PDB/RTDB Backup to display the Automatic PDB/RTDB Backup screen.
  3. From the Automatic PDB/RTDB Backup screen, select None as the Backup Type.
  4. Select the Schedule Backup button to complete the cancellation. Automatic PDB/RTDB Backup will have to be rescheduled. Refer to Administration Guide to reschedule the Automatic PDB/RTDB Backup.

4.8.11 6000000000001000 - SSH tunnel not established

One or more SSH tunnels has been enabled in the past, but the cron job was not able to re-establish the SSH tunnel with all of the Authorized PDBA Client IP addresses.

Recovery

  • Verify that the Customer Provisioning Application (CPA) machine is up and running.
    • If the CPA machine is not running, restart it and wait for the alarm to clear.
    • If the CPA machine is running, or if the alarm does not clear, contact My Oracle Support.
  • If the alarm text is "SSH tunnel down for <IP>", verify that the port specified for SSH tunneling is not in use on the remote machine.

4.8.12 6000000000002000 - RTDB 90% Full

The RTDB on the EPAP is approaching capacity (90%).

This error can result from one of the following conditions on the EAGLE:

  • The EPAP Data Split feature is not ON
  • The epap240m STP option is not ON (E5-SM8G-B card required)
  • The 120M DN and 120M IMSIs via split database feature is OFF at EPAP and OFF at Eagle
  • The 120M DN and 120M IMSIs via split database feature is OFF at EPAP and ON at Eagle

Recovery

  1. On the EAGLE, turn ON the optional EPAP Data Split feature to allow more room for the provisioned data.
  2. On the EAGLE, turn ON the epap240m STP option (E5-SM8G-B card required) to allow more room for the provisioned data.
  3. Turn ON the optional 120M DN and 120M IMSIs via Split database feature on the EPAP and Eagle to allow more room for the provisioned data.
  4. Contact My Oracle Support for assistance.

4.8.13 6000000000004000 - PDB 90% Full

The PDB on the EPAP has exceeded 90% of purchased capacity.

Recovery

  1. Log in to the EPAP CLI as epapdev.
  2. Use the manageLicenseInfo utility to check the value of purchased capacity (see the "Current license capacity"):
    $ manageLicenseInfo –l
  3. Purchase additional provisioning database capacity licenses as needed.
  4. Use the manageLicenseInfo utility to specify the additional amount of desired PDB capacity, where "License Capacity value" is the number of additional licenses required when one license supports 0.5M data (DN, IMSI, and IMEI):
    $ manageLicenseInfo –a <License Capacity value>

For assistance or additional information, contact My Oracle Support.

4.8.14 6000000000008000 - PDB 80% Full

The PDB on the EPAP has exceeded 80% of purchased capacity.

Recovery

  1. Log in to the EPAP CLI as epapdev.
  2. Use the manageLicenseInfo utility to check the value of purchased capacity (see the "Current license capacity"):
    $ manageLicenseInfo –l
  3. Purchase additional provisioning database capacity licenses as needed.
  4. Use the manageLicenseInfo utility to specify the additional amount of desired PDB capacity, where "License Capacity value" is the number of additional licenses required when one license supports 0.5M data (DN, IMSI, and IMEI):
    $ manageLicenseInfo –a <License Capacity value>

For assistance or additional information, contact My Oracle Support.

4.8.15 6000000000010000 - PDB InnoDB Space 90% Full

The storage space in InnoDB Engine on the EPAP is approaching capacity (90%).

Recovery

  1. Purchase additional provisioning database capacity licenses.
  2. Contact My Oracle Support.

4.8.16 6000000000040000 - RTDB Client Lagging Behind

This alarm is generated if the RTDB was not up while provisioning was done at the PDB, or if there is latency in the network resulting in RTDBs receiving updates late.

Note:

This alarm may occur during import and should eventually clear when the RTDB process catches up.

Recovery

The provisioning at the PDBs can be stopped until the RTDBs reach the same level.

4.8.17 6000000000080000 - Automatic Backup is not configured

The Automatic Backup is not configured at the PDB only.

Recovery

  1. Contact My Oracle Support.

4.8.18 6000000000100000 - EPAP QS Replication Issue

The EPAP Query Server is not reachable, not associated, or disconnected from the EPAP.

Recovery

  1. Contact My Oracle Support.

4.8.19 6000000000200000 - EPAP QS Lagging Behind

The EPAP Query Server is not in synch with the EPAP and is falling behind from a threshold set by the user.

Recovery

  1. Contact My Oracle Support.

4.8.20 6000000000400000 - License capacity is not configured

The license capacity has never been set or the license capacity is set to 0.

By default, up to 120M can be provisioned if license capacity is not set. To use the EPAP Expansion to 480M Database Entries feature, additional capacity (i.e., Required Capacity - Current Purchased Capacity) must be purchased before adjusting the license capacity using the following procedure. For capacity over 255M, 480G drive modules are required.

Recovery

  1. Log in to the EPAP CLI as epapdev.
  2. Use the manageLicenseInfo utility to check the value of purchased capacity (see the "Current license capacity"):
    $ manageLicenseInfo –l
  3. Use the manageLicenseInfo utility to specify the additional amount of desired PDB capacity, where <License Capacity value> is the number of additional licenses required when one license supports 0.5M data (DN, IMSI, and IMEI):
    $ manageLicenseInfo –a <License Capacity value>
    For example, if 120M is currently provisioned and an additional 80M is desired for a new capacity of 200M, 160 should be specified for the <License Capacity value>:
    manageLicenseInfo -a 160

For assistance or additional information, contact My Oracle Support.

4.8.21 6000000000800000 - Long wait on write for PDBI update

Customers should complete the following steps in order to raise the "Long Wait on Write for PDBI Update" alarm. This will ensure the user is alerted to a PDBI write connection holding for too long:
  1. Issue the uiEdit command
    "PDBI_LONG_WAIT_ALARM_TIME" <time in seconds>
    where <time in seconds> is the time value that a PDBI connection is allowed to hold a write connection before triggering the alarm.
  2. Investigate the alarm banner on the EPAP GUI for the alarm text "Long wait on write for PDBI update"; or, identify the alarm bit 6000000000800000 from the connected EAGLE; or, find the alarm number 45121 from the SNMP NM server.
  3. If the alarm is triggered, find the PDBI connection information by issuing the grep
    "Throw alarm for connection" pdba.err.*
    command in the
    /usr/TKLC/epap/logs
    directory.
  4. Clear the alarm to release the PDBI write connection in question.

4.8.22 6000000001000000 - NE count mismatch between PDB and RTDB

Customer should schedule a cron job in “/etc/cron.d/TS.EXAP” for “/usr/TKLC/appl/bin/checkNEsanity.pl” in order to raise the alarm, when there is count mismatch between PDB and RTDB for Network Entity (NE). This cron will be scheduled only on the server having RTDB, hence don’t schedule the cron on pdbonly server.

Customer can schedule the cron considering the following conditions:
  • Cron should be scheduled once in a day.
  • Server should not be involved in any other activity at the time when this cron is scheduled, to neglect any impact.
  • It will be good to schedule the cron when the provisioning rate is very low or negligible.
  • Cron should be scheduled at some specific time of the day when scheduling for once in a day.

For example: To schedule daily once at 05:00 , Sched="daily,1,05:00"

00 05 * * * epapdev /usr/TKLC/appl/bin/checkNEsanity.pl

If the alarm is observed, follow the below mentioned recovery steps:
  • When the alarm is observed, savelogs (application logs) is automatically taken for the first time but the customer will have to take the platform logs manually from the platcfg menu. Also, customer can retake the application logs, if more recent logs are needed.
  • If we have other RTDBs connected to the same PDB and the DB on them is good, then the customer can restore the backup from one of the other connected RTDBs on this RTDB.
  • If all RTDBs connected to the same PDB are show NE mismatch then restore both PDB and RTDB from backup taken from another site having the similar database.
  • If the above two options are not feasible, then do a reload from PDB on this RTDB. This will reload the database from scratch on RTDB, from the connected PDB. This process will take time depending upon the total size of the database.

Contact support for any query.