3 Recovery Support
The information in this section describes the recommended backing up of the RTDB and presents additional recovery support procedures that may be referred to by alarms recovery actions.
Daily Maintenance Procedures
Use the Automatic PDB/RTDB Backup feature to backup all data stored in the PDB/RTDB. The manual backup procedures are included in this section in case the database backup needs to be performed manually. Storing database backups in a secure off-site location ensures the ability to recover from system failures.
This section describes the following recommended daily maintenance procedures:
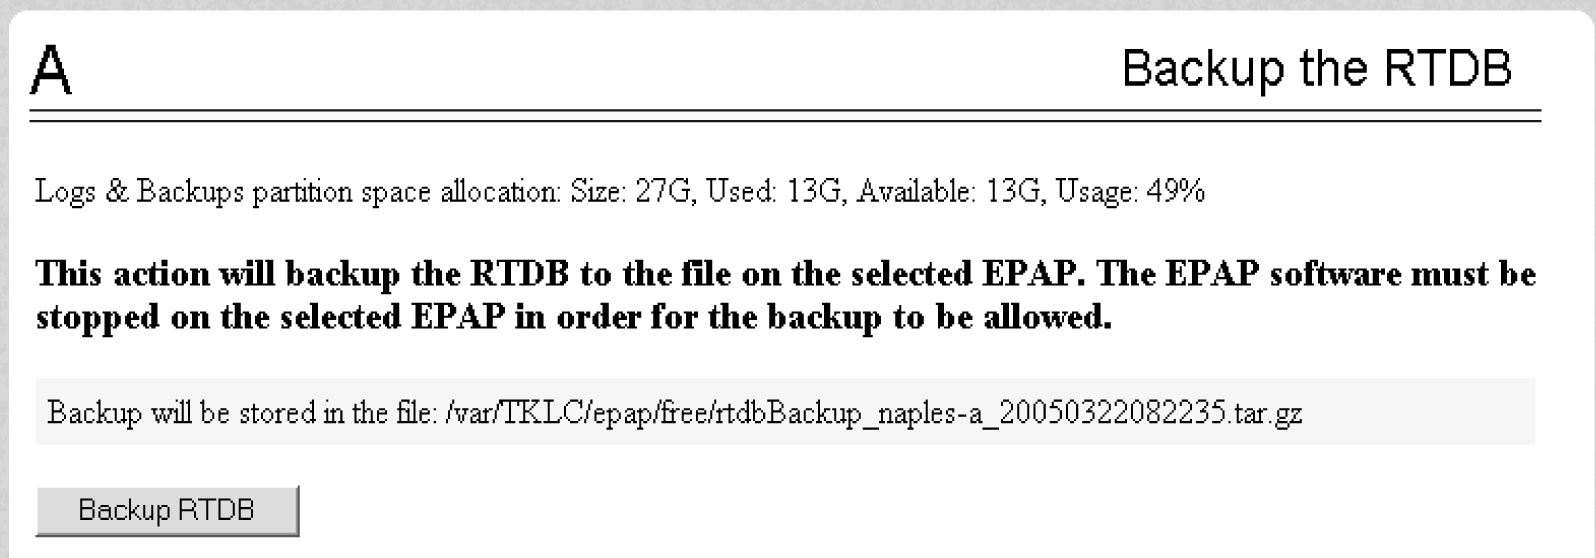
Backing Up the RTDB
Perform this procedure once each day. The estimated time required to complete this procedure is one hour.
Backing Up the PDB
Perform this procedure once each day. The estimated time required to complete this procedure is two hours. PDB provisioning can take place while this procedure is being performed, but will extend the time required.
Note:
Make sure that you perform this procedure on the same server on which you performed Backing Up the RTDB. Make sure that you performed Backing Up the RTDB first so that the RTDB backup level will be lower than the associated PDB backup level.Transferring RTDB and PDB Backup Files
Perform this procedure once each day. The time required to complete this procedure depends on network bandwidth. File sizes can be several gigabytes for each database.
- Log in to the EPAP command line interface with user name
epapdevand the password associated with that user name. - Use the Secure File Transfer Protocol (
sftp) to transfer the following files to a remote, safe location:- The RTDB backup file, the name of which was recorded in Backing Up the RTDB
- The PDB backup file, the name of which was recorded in Backing Up the PDB
System Health Check Overview
The server runs a self-diagnostic utility program called syscheck to monitor itself. The system health check utility syscheck tests the server hardware and platform software. Checks and balances verify the health of the server and platform software for each test, and verify the presence of required application software.
If the syscheck utility detects a problem, an alarm code is generated. The alarm code is a 16-character data string in hexadecimal format. All alarm codes are ranked by severity: critical, major, and minor. Alarm Categories lists the platform alarms and their alarm codes.
The syscheck output can be in either of the following forms (see Health Check OutputsHealth Check Outputs for output examples):
- Normal— results summary of the checks performed by
syscheck - Verbose—detailed results for each check performed by
syscheck
The syscheck utility can be run in the following ways:
- The operator can invoke
syscheck:- From the EPAPGUI Platform Menu (see Accessing the EPAP GUI). The user can request Normal or Verbose output.
- By logging in as a
syscheckuser (see Running syscheck Using the syscheck Login). Only Normal output is produced. - By logging in as admusr and using sudo to run syscheck on the command line (see Running syscheck from the Command line).
- By logging into the
platcfgutility and runningsyscheckin either Normal or Verbose mode. For more information, see 7.a.
-
syscheckruns automatically by timer at the following frequencies:- Tests for critical platform errors run automatically every 30 seconds.
- Tests for major and minor platform errors run automatically every 60 seconds.
Functions Checked by syscheck
Table 3-1 summarizes the functions checked by syscheck.
Table 3-1 System Health Check Operation
Health Check Outputs
System health check utility syscheck output can be
Normal (brief) or Verbose (detailed), depending on how it is initiated.
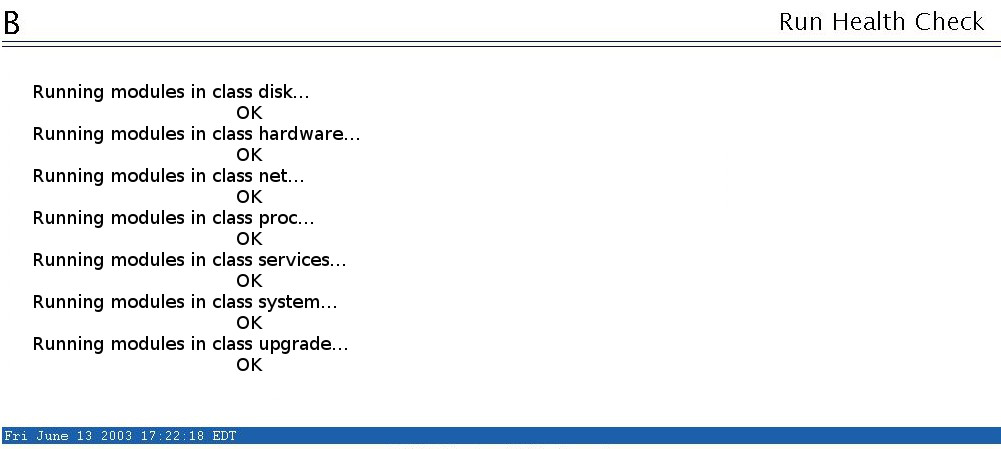
Normal Output
The following example is an output in Normal format:
[admusr@EPAP17 ~]$ sudo syscheck
Running modules in class disk...
                                 OK

Running modules in class hardware...
                                 OK

Running modules in class net...
                                 OK

Running modules in class proc...
                                 OK

Running modules in class services...
                                 OK

Running modules in class system...
                                 OK

Running modules in class upgrade...
                                 OK

LOG LOCATION: /var/TKLC/log/syscheck/fail_log
Verbose Output Containing Errors
If an error occurs, the system health check utility
syscheck provides alarm data strings and diagnostic
information for platform errors in its output. The following example is an output in
Verbose format:
[admusr@Salta-a ~]$ sudo syscheck -v
Running modules in class disk...
          fs: Current file space use in "/" is 31%.
          fs: Current Inode used in "/" is 10%.
          fs: Current file space use in "/usr" is 57%.
          fs: Current Inode used in "/usr" is 19%.
          fs: Current file space use in "/var" is 30%.
          fs: Current Inode used in "/var" is 4%.
          fs: Current file space use in "/var/TKLC" is 31%.
          fs: Current Inode used in "/var/TKLC" is 1%.
          fs: Current file space use in "/tmp" is 0%.
          fs: Current Inode used in "/tmp" is 0%.
          fs: Current file space use in "/var/TKLC/epap/db" is 88%.
          fs: Current Inode used in "/var/TKLC/epap/db" is 0%.
          fs: Current file space use in "/var/TKLC/epap/logs" is 3%.
          fs: Current Inode used in "/var/TKLC/epap/logs" is 0%.
          fs: Current file space use in "/var/TKLC/epap/free" is 7%.
          fs: Current Inode used in "/var/TKLC/epap/free" is 0%.
      hpdisk: Only HP ProLiant servers support hpdisk diagnostics.
         lsi: Could not find LSI controller. Not running test.
        meta: Checking md status on system.
        meta: md Status OK, with 2 active volumes.
        meta: Checking md configuration on system.
        meta: Server md configuration OK.
   multipath: No multipath devices configured to be checked.
         sas: Only T1200 supports SAS diagnostics.
       smart: Finished examining logs for disk: sdb.
       smart: Finished examining logs for disk: sda.
       smart: SMART status OK.
       write: Successfully read from file system "/".
       write: Successfully read from file system "/boot".
       write: Successfully read from file system "/usr".
       write: Successfully read from file system "/var".
       write: Successfully read from file system "/var/TKLC".
       write: Successfully read from file system "/tmp".
       write: Successfully read from file system "/var/TKLC/epap/db".
       write: Successfully read from file system "/var/TKLC/epap/logs".
       write: Successfully read from file system "/var/TKLC/epap/free".
                                 OK

Running modules in class hardware...
  cmosbattery: This hardware does not support monitoring the CMOS battery.
  cmosbattery: The test will not be ran.
         ecc: Checking ECC hardware.
         ecc: Correctible Error Count: 0
         ecc: Uncorrectible Error Count: 0
Discarding cache...
         fan: Checking Status of Server Fans.
         fan: Fan is OK. fana: 1, CHIP: FAN
         fan: Server Fan Status OK.
  fancontrol: EAGLE_E5APPB does not support Fan Controls
  fancontrol: Will not run the test.
  flashdevice: Checking programmable devices.
  flashdevice: PSOC OK.
  flashdevice: CPLD OK.
  flashdevice: BIOS OK.
  flashdevice: ALL Programmable Devices OK.
        mezz: Checking Status of Serial Mezzanine.
        mezz: Serial Mezzanine is OK. mezza: 1, CHIP: MEZZ
        mezz: Serial Mezzanine is OK. mezzb: 1, CHIP: MEZZ
        mezz: Server Serial Mezz Status OK.
       oemHW: Only Oracle servers support hwmgmt.
         psu: This hardware does not support power feed monitoring.
         psu: Will not run test.
         psu: This hardware does not support PSU monitoring.
         psu: Will not run test.
      serial: Running serial port configuration test
      serial: EAGLE_E5APPB does not support serial port configuration monitoring
      serial: Will not run test.
        temp: Checking server temperature.
        temp: Server Temp OK. Inlet Air Temp: +24.5 C (high = +70.0 C, warn = +66 C, hyst = +75.0 C), CHIP: lm75-i2c-0-48
        temp: Server Temp OK. Outlet Air Temp: +27.5 C (high = +70.0 C, warn = +66 C, hyst = +75.0 C), CHIP: lm75-i2c-0-49
        temp: Server Temp OK. MCH Diode Temp: +38.9 C (high = +95.0 C, warn = +90 C, low = +10.0 C), CHIP: sch311x-isa-0a70
        temp: Server Temp OK. Internal Temp: +25.1 C (high = +95.0 C, warn = +90 C, low = +10.0 C), CHIP: sch311x-isa-0a70
        temp: Server Temp OK. Core 0: +32.0 C (high = +71.0 C, crit = +95.0 C, warn = +67 C), CHIP: coretemp-isa-0000
        temp: Server Temp OK. Core 1: +32.0 C (high = +71.0 C, crit = +95.0 C, warn = +67 C), CHIP: coretemp-isa-0000
     voltage: Checking server voltages.
     voltage: Voltage is OK. V2.5: +2.44 V (min = +2.37 V, max = +2.63 V), CHIP: sch311x-isa-0a70
     voltage: Voltage is OK. Vccp: +1.08 V (min = +0.85 V, max = +1.35 V), CHIP: sch311x-isa-0a70
     voltage: Voltage is OK. V3.3: +3.28 V (min = +3.13 V, max = +3.47 V), CHIP: sch311x-isa-0a70
     voltage: Voltage is OK. V5: +4.93 V (min = +4.74 V, max = +5.26 V), CHIP: sch311x-isa-0a70
     voltage: Voltage is OK. V1.8: +1.81 V (min = +1.69 V, max = +1.88 V), CHIP: sch311x-isa-0a70
     voltage: Voltage is OK. V3.3stby: +3.29 V (min = +3.13 V, max = +3.47 V), CHIP: sch311x-isa-0a70
     voltage: Voltage is OK. V3.3: +3.29 V (min = +3.13 V, max = +3.46 V), CHIP: cy8c27x43-i2c-0-28
     voltage: Voltage is OK. V1.8: +1.81 V (min = +1.71 V, max = +1.89 V), CHIP: cy8c27x43-i2c-0-28
     voltage: Voltage is OK. V1.5: +1.50 V (min = +1.42 V, max = +1.57 V), CHIP: cy8c27x43-i2c-0-28
     voltage: Voltage is OK. V1.2: +1.20 V (min = +1.14 V, max = +1.26 V), CHIP: cy8c27x43-i2c-0-28
     voltage: Voltage is OK. V1.05: +1.04 V (min = +1.00 V, max = +1.10 V), CHIP: cy8c27x43-i2c-0-28
     voltage: Voltage is OK. V1.0: +1.00 V (min = +0.95 V, max = +1.05 V), CHIP: cy8c27x43-i2c-0-28
     voltage: Server Voltages OK.
                                 OK

Running modules in class net...
  defaultroute: Checking default route(s)
  defaultroute:   Checking static default route through device eth01 to gateway fe80::226:98ff:fe1a:9ac1...
  defaultroute:   Checking static default route through device eth01 to gateway 192.168.61.250...
  defaultroute:   Checking auto-configured default route through device eth04 to gateway fe80::226:98ff:fe1a:9ac1...
        ping: Checking ping hosts
        ping: prova-ip network connection OK
                                 OK

Running modules in class proc...
         run: Checking RTCtimeStampd...
         run: Found 1 instance(s) of the RTCtimeStampd process.
         run: Checking ntdMgr...
         run: Found 1 instance(s) of the ntdMgr process.
         run: Checking smartd...
         run: Found 1 instance(s) of the smartd process.
         run: Checking switchMon...
         run: Found 1 instance(s) of the switchMon process.
         run: Checking atd...
         run: Found 1 instance(s) of the atd process.
         run: Checking crond...
         run: Found 1 instance(s) of the crond process.
         run: Checking sshd...
         run: Found 3 instance(s) of the sshd process.
         run: Checking syscheck...
         run: Found 1 instance(s) of the syscheck process.
         run: Checking rsyslogd...
         run: Found 1 instance(s) of the rsyslogd process.
         run: Checking alarmMgr...
         run: Found 1 instance(s) of the alarmMgr process.
         run: Checking tpdProvd...
         run: Found 1 instance(s) of the tpdProvd process.
         run: Checking maint...
         run: Found 1 instance(s) of the maint process.
         run: Checking pdba...
         run: Found 1 instance(s) of the pdba process.
         run: Checking exinit...
         run: Found 1 instance(s) of the exinit process.
         run: Checking gs...
         run: Found 1 instance(s) of the gs process.
         run: Checking mysqld...
         run: Found 2 instance(s) of the mysqld process.
         run: Checking httpd...
         run: Found 12 instance(s) of the httpd process.
         run: Checking epapSnmpAL...
         run: Found 1 instance(s) of the epapSnmpAL process.
         run: Checking epapSnmpAgent...
         run: Found 1 instance(s) of the epapSnmpAgent process.
         run: Checking epapSnmpHBS...
         run: Found 1 instance(s) of the epapSnmpHBS process.
         run: Checking snmpd...
         run: Found 1 instance(s) of the snmpd process.
                                 OK

Running modules in class system...
        core: Checking for core files.
         cpu: Found "2" CPU(s)... OK
         cpu: CPU 0 is on-line... OK
         cpu: CPU 0 speed: 2660.018 MHz... OK
         cpu: CPU 1 is on-line... OK
         cpu: CPU 1 speed: 2660.018 MHz... OK
       kdump: Checking for kernel dump files.
         mem: Skipping expected memory check.
         mem: Minimum expected memory found.
         mem: 8252940288 bytes (~7871 Mb) of RAM installed.
                                 OK

Running modules in class upgrade...
   snapshots: No snapshots found. Not running test.
                                 OK

LOG LOCATION: /var/TKLC/log/syscheck/fail_log
[admusr@Salta-a ~]$
Note:
For information on alarm codes in the alarm strings and procedures to respond to alarms, see the section Alarm Categories.Running the System Health Check
The operator can run syscheck to obtain the operational platform status with one of the following procedures:
Running syscheck from the Command line
The admusr can use sudo to run syscheck from the command line. This method can be used whether an application is installed or whether the GUI is available.
Running syscheck Through the EPAP GUI
Refer to Administration Guide for more details and information about logins and permissions.
Running syscheck Using the syscheck Login
If the EPAP application has not been installed on the server or you are unable to log in to the EPAP user interface, you cannot run syscheck through the GUI. Instead, you can run syscheck from the syscheck login, and report the results to My Oracle Support.
Restoring Databases from Backup Files
This section describes how restore the RTDB or PDB or both from backup files.
Restoring the RTDB from Backup Files
To restore the EPAP’s RTDB from a backup file, contact My Oracle Support.
Note:
Back up the RTDB daily (see Backing Up the RTDB).Use the following procedure to restore the RTDB from a previously prepared backup file.
Caution:
Contact My Oracle Support before performing this procedure.-
Log into the EPAP command line interface with user name
epapdevand the password associated with that name. -
Use the Secure File Transfer Protocol (
sftp) to transfer the RTDB backup file (whose name was recorded in Restoring Databases from Backup Files) to the following location:/var/TKLC/epap/free/ -
Log into the EPAP GUI (see Accessing the EPAP GUI).
-
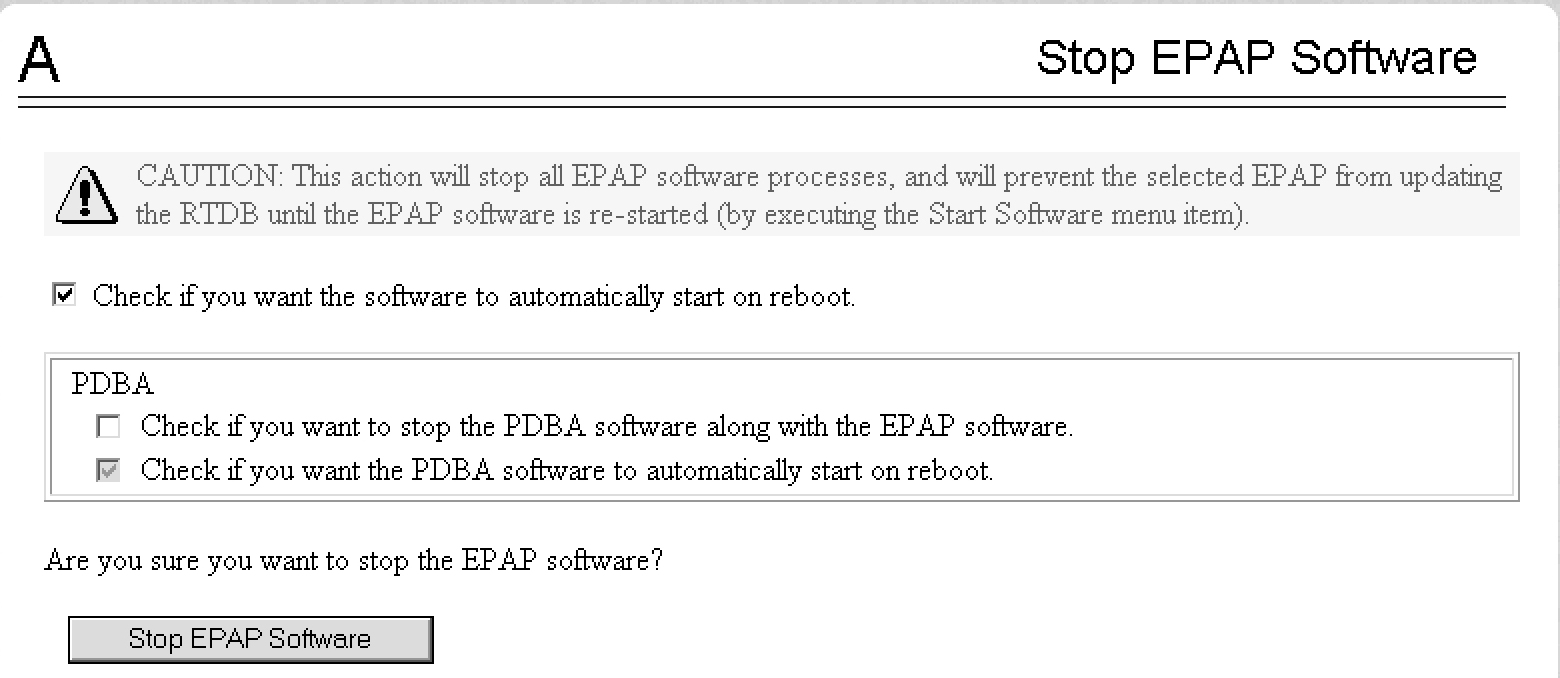
Select Process Control>Stop Software to ensure that no other updates are occurring. The screen in Figure 3-13 displays:
Figure 3-13 Stop EPAP Software

-
When you stopped the software on the selected EPAP, the screen in Figure 3-14 displays:
Figure 3-14 Stop EPAP Software - Success

-
Select RTDB>Maintenance>Restore . The screen shown in Figure 3-15 displays:
Figure 3-15 Restoring the RTDB

-
On the screen shown in Figure 3-15, select the file that was transferred in Figure 3-15. Click Restore the RTDB from the Selected File.
-
To confirm restoring a file, click Confirm RTDB Restore shown in the screen for RTDB in Figure 3-16:
Figure 3-16 Restore the RTDB Confirm

-
When restoring the file is successful, the screen shown in Figure 3-17 displays:
Figure 3-17 Restore the RTDB - Success

-
This procedure is complete.
Restoring the PDB from Backup Files
To restore the EPAP’s PDB from a backup file, contact Technical Services and Support, see My Oracle Support.
Note:
Back up the PDB daily (see Backing Up the PDB).Use the following procedure to restore the PDB from a previously prepared backup file.
Caution:
Contact My Oracle Support before performing this procedure.Text inset.
Recovering From Alarms
Alarms are resolved in order of severity level from highest to lowest. When combination alarms are decoded into their individual component alarms, the customer can decide in which order to resolve the alarms because all alarms are of equal severity. For assistance in deciding which alarm to resolve first or how to perform a recovery procedure, contact My Oracle Support.
- If the problem being investigated is no longer displayed on the EPAP GUI, perform the following:
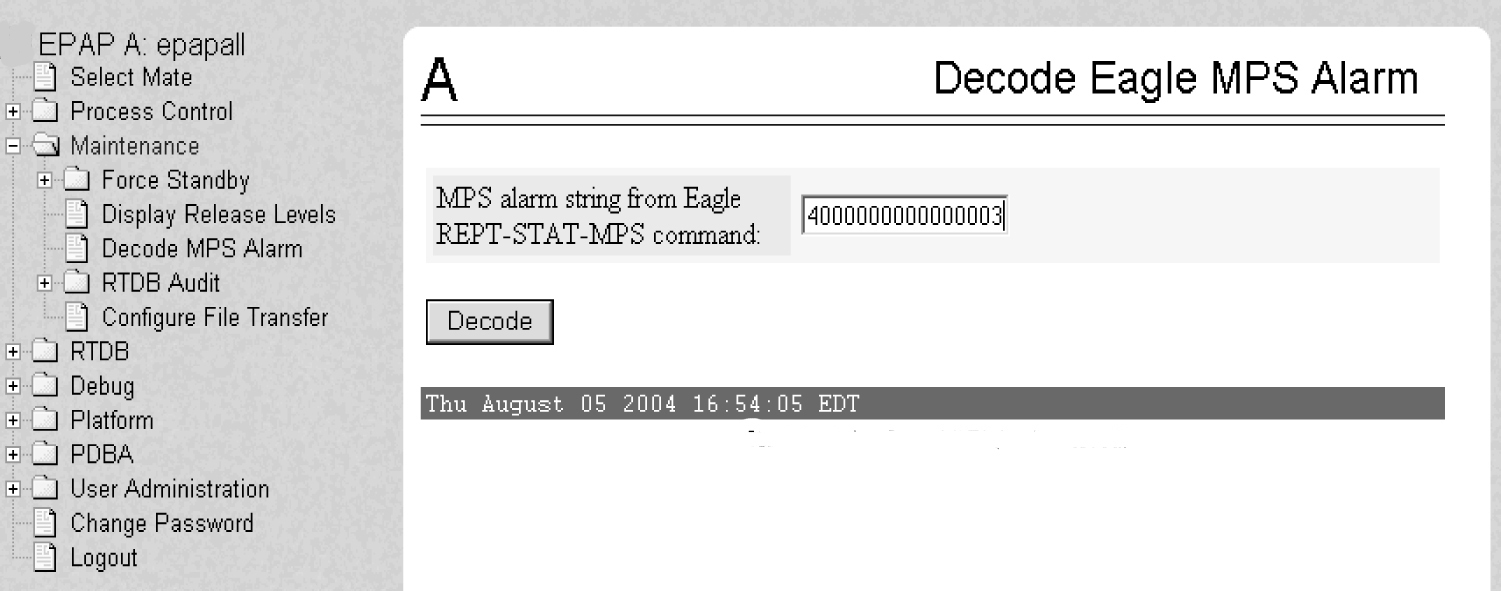
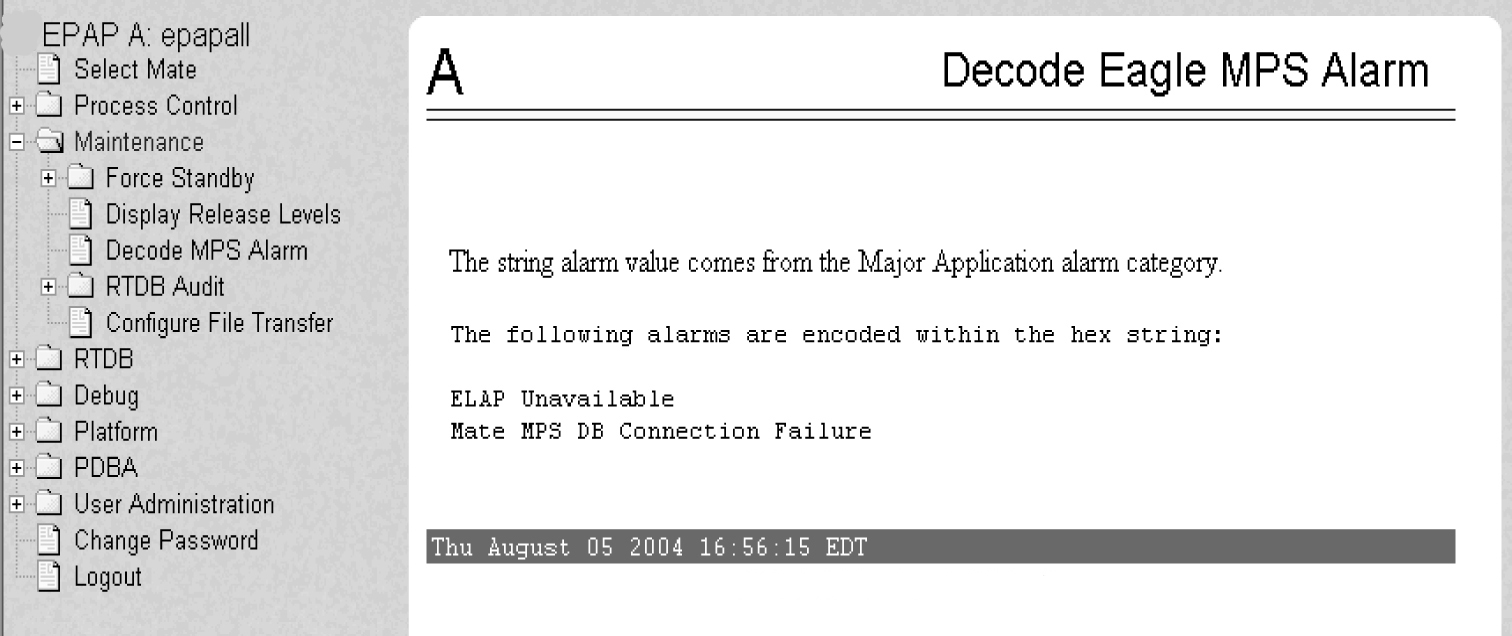
- Procedure Decode Alarm Strings
- Procedure Determine Alarm Cause
- Recovery procedure to which you are directed by procedure Determine Alarm Cause
- If the problem being investigated is being reported currently on the EPAP GUI, perform the following:
- Procedure Decode Alarm Strings
