3.10.2.5.8 Visualizing Spatiotemporal Data in OGC WMS Datasets

You can visualize OGC WMS datasets that contain spatiotemporal data.

The following instructions assume that you have enabled spatiotemporal for such a dataset and the dataset is already added to the project in the Active Project page. See Configuring Spatiotemporal for OGC WMS Datasets for more information.
  1. Click the Visualizations tab on the left pane in the Active Project page.
    This lists the various visualization options.
  2. Click and drag Map from the list to the visualization window on the right to create a map visualization.
    A default base map is displayed with no data visualization layers.
  3. Click the Data tab on the left pane in the Active Project page.
    This lists all the Datasets that are loaded for the project.
  4. Click and drag the desired spatiotemporal dataset from the list to the map view on the right.
    A single map layer is created on the map.
  5. Click the Settings icon in your map tool bar.
  6. Switch ON the Show timeline toggle and click OK.
    The Cesium Timeline widget appears at the bottom of the map visualization canvas. However, the timeline is not operational at this step.
  7. Click Menu Icon against the map layer in the Data tab of the Layers list and select Add to Timeline.
    The map layer gets added to the timeline. Although the timeline is now listening to the timeline events, it is still not operational.
  8. Select Configure Animation from the context menu of the map layer.
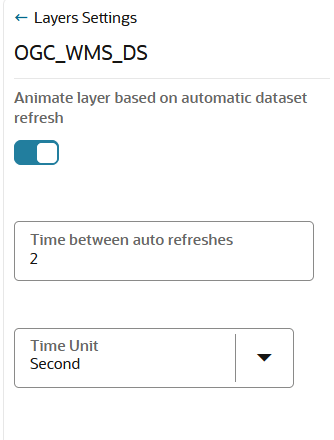
    The animation configuration dialog opens as shown:

    Figure 3-64 Configuring Animation for an WMS Dataset

    Description of Figure 3-64 follows
    Description of "Figure 3-64 Configuring Animation for an WMS Dataset"
  9. Switch ON Animate layer based on automatic dataset refresh.
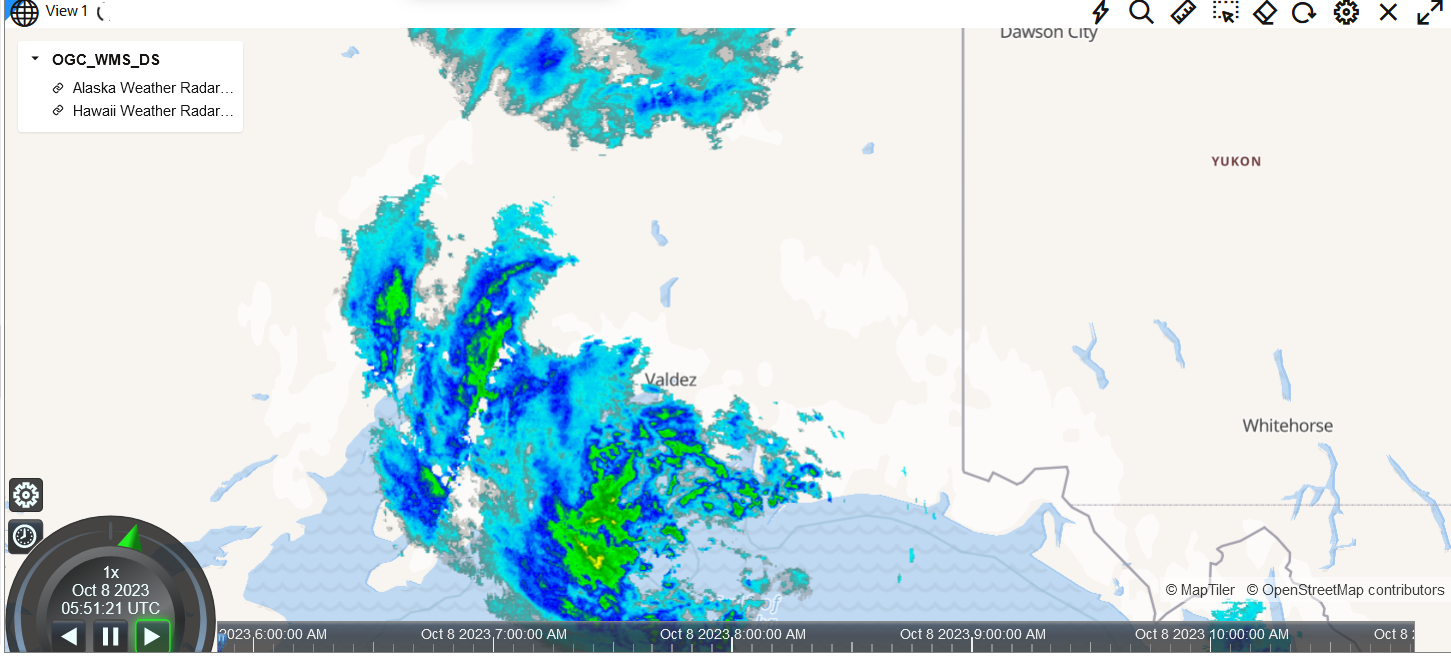
    The dataset animates with the Cesium clock events.
    The dataset will poll the WMS service to fetch the images as per the time value under the Cesium clock current time.

    Figure 3-65 Visualizing WMS Dataset with Spatiotemporal Data

    Description of Figure 3-65 follows
    Description of "Figure 3-65 Visualizing WMS Dataset with Spatiotemporal Data"
  10. Specify Time between auto refreshes to indicate the frequency of data refresh from the backend. This configuration also determines the smoothness and speed of the temporal animation.
    Also, note the following:
    • Spatial Studio displays a default value of 2 seconds for WMS datasets. The effective refresh rates depend on how fast images are fetched from the respective WMS service. Empirically, for WMS data, any data change rate less than 2 seconds is not sufficient to retrieve image and refresh the tiles. It can cause incomplete image loading before the new refresh, or the visualization may remain stuck in refresh state.
    • The parameter ignores all the tick events from the timeline if the Cesium clock current time is less than previousRefreshTime + x seconds (or any other time unit). For example, if a dataset is supposed to refresh every 30 seconds, then configure this value in Time between auto refreshes so that even if the Cesium clock continues to throw tick events for all layers, this layer will ignore any such events.
  11. Specify a Time Unit.
  12. Optionally, select custom Start Time, Stop Time, Multiplier, and so on from the timeline settings. You can also use the Cesium timeline controls and make the current time pointer slide to a different time frame.

    Note:

    Zoom Timeline to Range is disabled for an OGC WMS dataset. This is because each WMS dataset may comprise more than one image layers and it will be inaccurate to choose a time range for any one of these layers automatically. Therefore, use the Cesium timeline settings (see Configuring the Cesium Timeline Settings) to manually set the appropriate range of the timeline for the specific image layer that you wish to animate.
  13. Optionally, select Remove from Timeline in the context menu of the map layer if you wish the map layer to stop listening to the Cesium timeline.