3.10.2.5.2 Configuring the Cesium Timeline Settings

You can configure custom settings for the Cesium timeline.

Perform the following steps to configure the Cesium Timeline settings in your map visualization.
The instructions assume that you have a project linked to a spatiotemporal dataset and the project is opened on your Active Project page.
  1. Click the Settings icon in your map tool bar.
  2. Switch ON the Show timeline toggle and click OK.
    The Cesium Timeline widget appears at the bottom of the map visualization canvas.
  3. Click timeline_settings_icon on the timeline to configure the Cesium timeline settings.

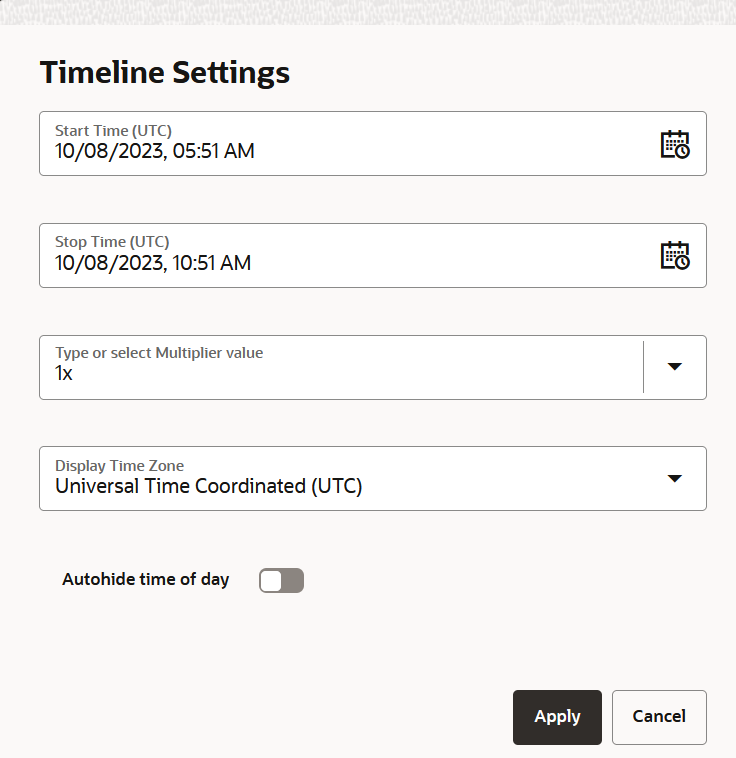
    The Timeline Settings dialog opens as shown:

    1. Select the Start Time and Stop Time to set the timeline range.
    2. Enter or select a multiplier value from the Type or select Multiplier value list box.

      You can use a preset (Second, Minutes, Hours, Days, Weeks, Month, Year) multiplier or type a value such as 15 or 15x.

    3. Select the Display Time Zone in which you want the Cesium timeline to display its current time and timeline labels.
    4. Optionally, switch ON the Autohide time of day.
      If you opt to autohide time of day, then the time values from the timeline labels are hidden if the timeline range selected is greater than a week.
    5. Click Apply.