3.10.2.5.7 Visualizing Non-Live and Non-Moving Objects Dataset

You can visualize a spatiotemporal dataset that simply contains different timestamp values in each row which are not grouped by any entity ids.

The following instructions assume that you have enabled spatiotemporal for such a dataset and the dataset is already added to the project in the Active Project page. See Configuring Spatiotemporal for Non-Live and Non-Moving Objects Dataset for more information.
  1. Click the Visualizations tab on the left pane in the Active Project page.
    This lists the various visualization options.
  2. Click and drag Map from the list to the visualization window on the right to create a map visualization.
    A default base map is displayed with no data visualization layers.
  3. Click the Data tab on the left pane in the Active Project page.
    This lists all the Datasets that are loaded for the project.
  4. Click and drag the desired spatiotemporal dataset from the list to the map view on the right.
    A single map layer is created on the map.
  5. Click the Settings icon in your map tool bar.
  6. Switch ON the Show timeline toggle and click OK.
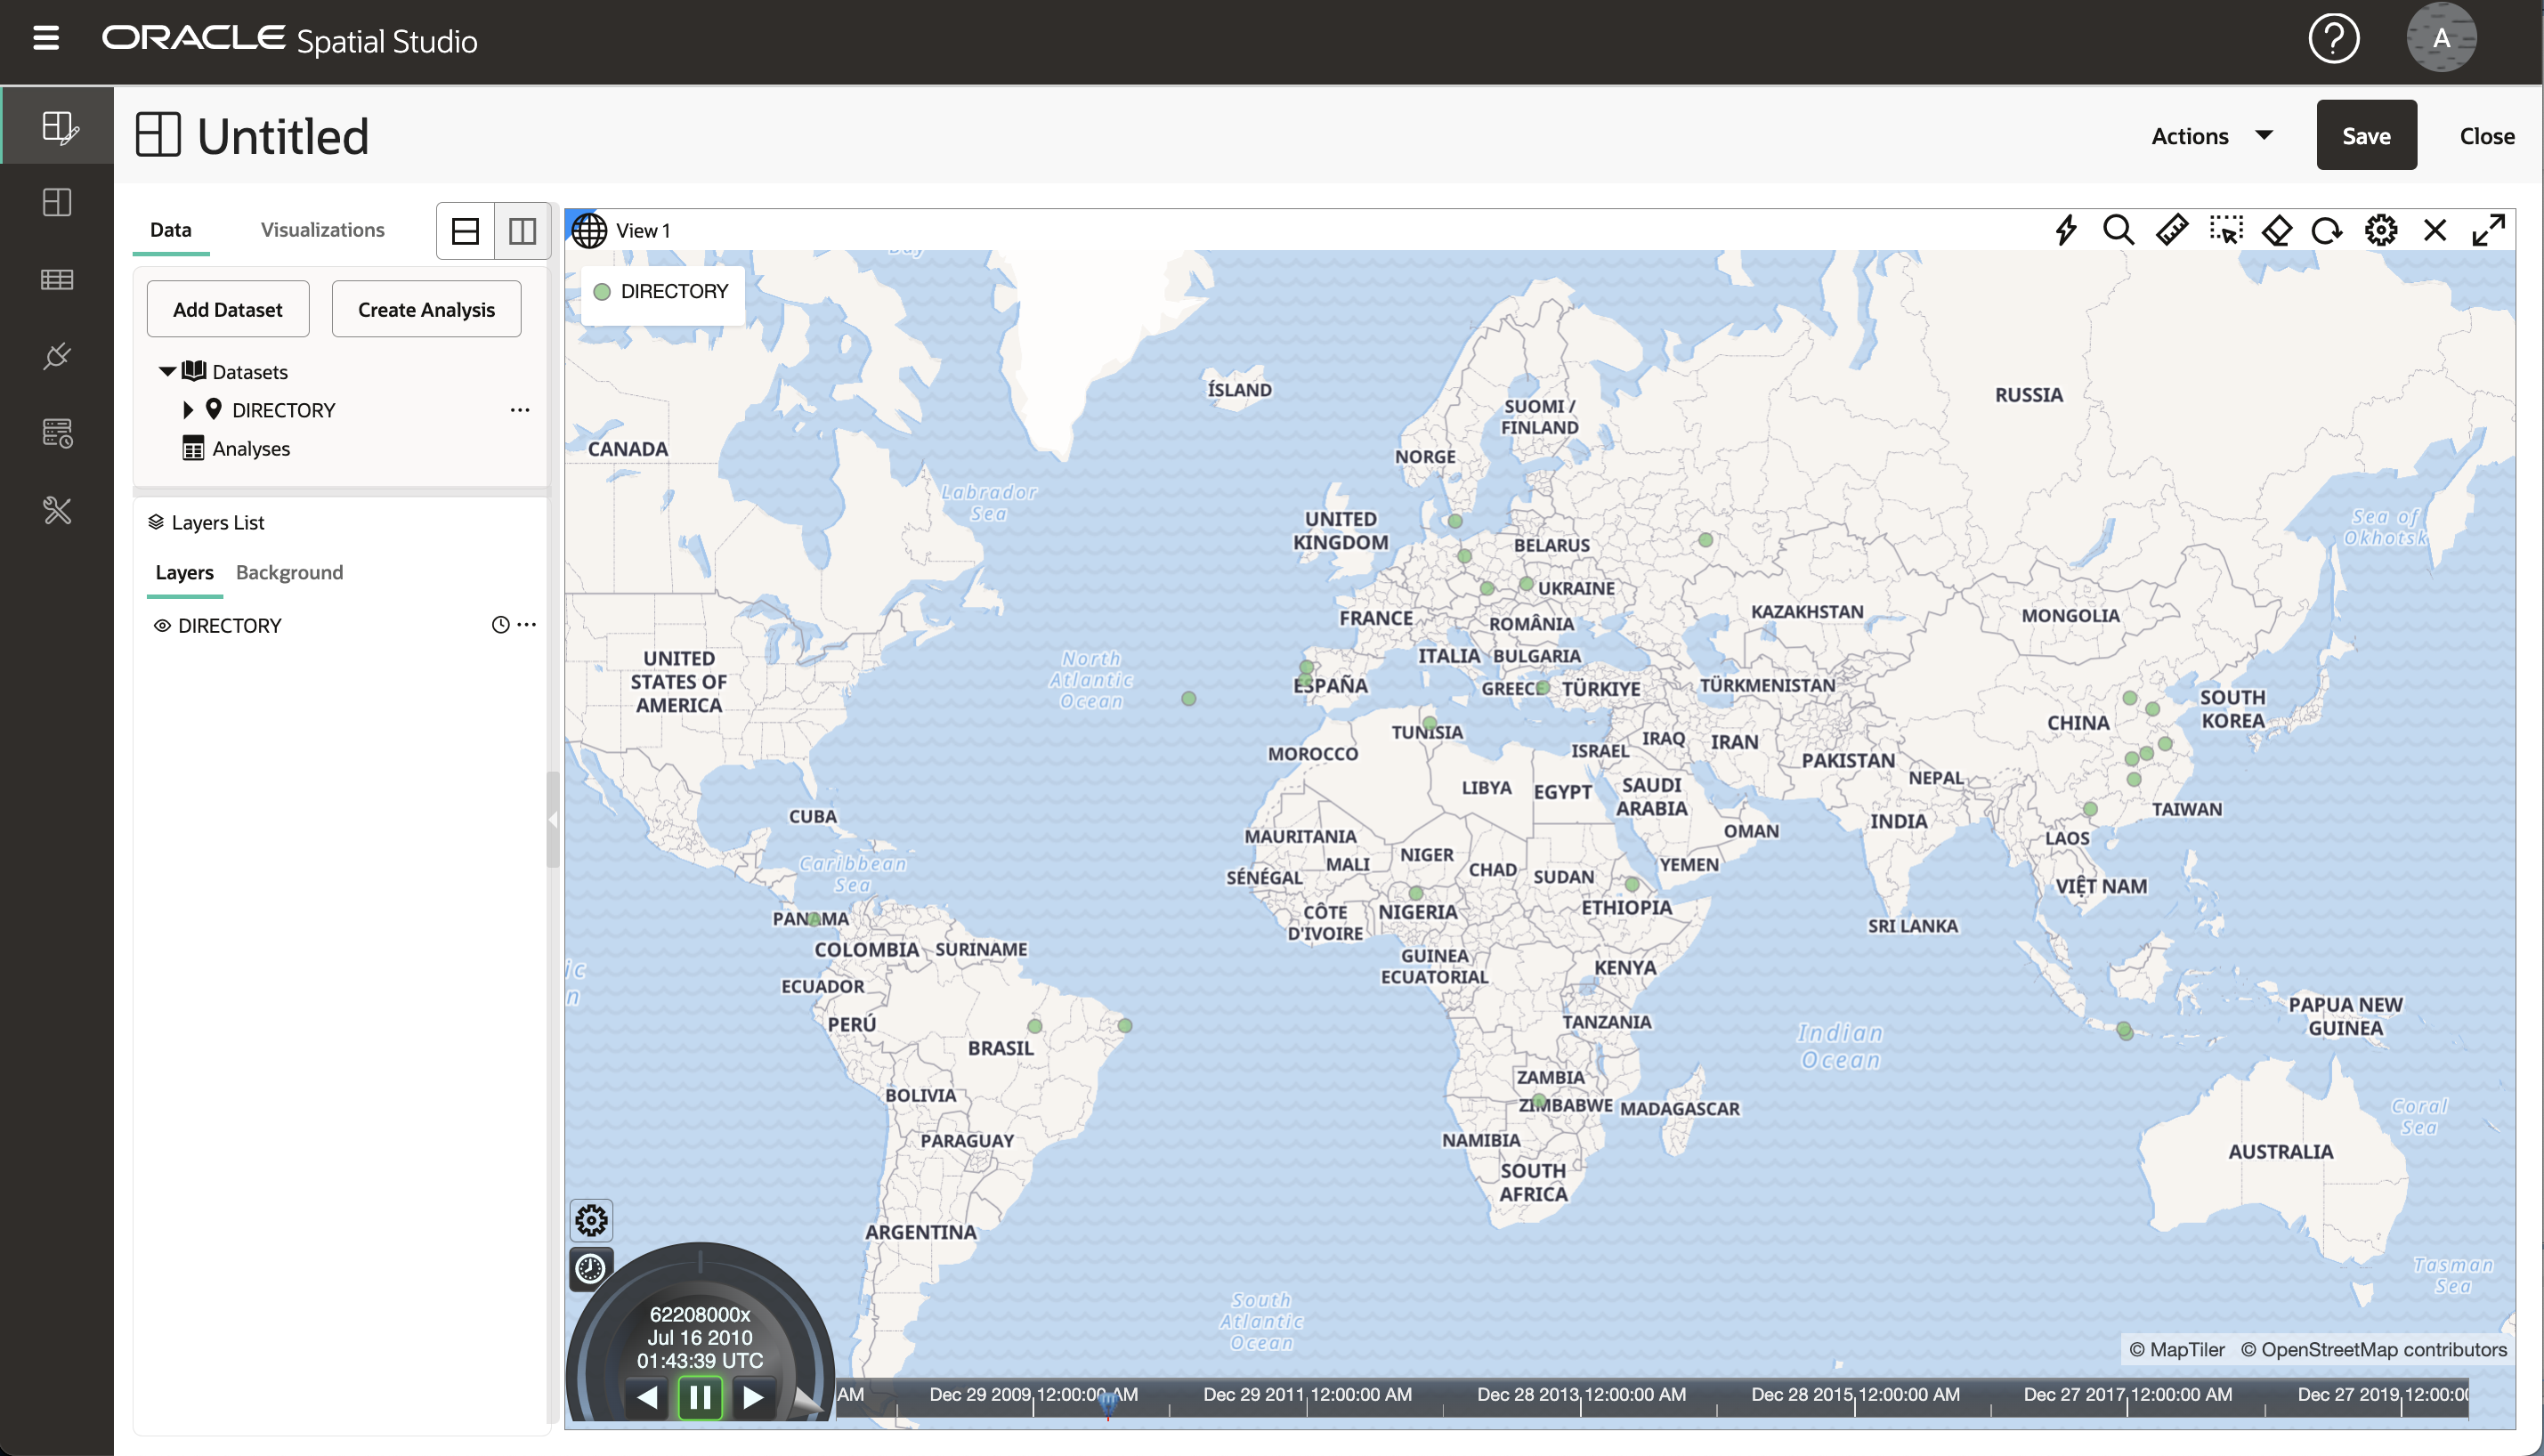
    The Cesium Timeline widget appears at the bottom of the map visualization canvas. However, the timeline is not operational at this step.
  7. Click Menu Icon against the primary layer in the Data tab of the Layers list and click Add to Timeline.
    The map layer gets added to the timeline and the timeline will range from minimum value to maximum value of the timestamp column. The current time will point to the minimum value of the timestamp column and the layer is now listening to the timeline events.

    Also, the filtering configured for the spatiotemporal settings will automatically be applied and the map layer will be filtered as per the Cesium clock current time. For example, if the Cesium clock current time is Monday, May 22, 2023 5:13 PM and the configured time unit for filtering is month, then the map visualization will show all the geometries that have the timestamps between May 1, 2023 and May 31, 2023.

    The multiplier of the timeline matches the filtering time unit selected. However, you can also change the time unit at which the dataset is currently being filtered (see Configuring Spatiotemporal for Non-Live and Non-Moving Objects Dataset).

    Figure 3-63 Applying Standard Filtering on a Map Layer

    Description of Figure 3-63 follows
    Description of "Figure 3-63 Applying Standard Filtering on a Map Layer"
  8. Select Zoom Timeline to Range in the context menu of the map layer.
    The timeline is refocused to range from minimum value to maximum value of the timestamp column and the current time will point to the minimum value of the timestamp column. This acts as a looping mechanism for a historic dataset.
  9. Optionally, select custom Start Time, Stop Time, Multiplier, and so on from the timeline settings. You can also use the Cesium timeline controls and make the current time pointer slide to a different time frame.
  10. Optionally, select Remove from Timeline in the context menu of the map layer if you wish the map layer to stop listening to the Cesium timeline.