Other Compliance 360 Dashboard Portlets
Apart from the Key Performance Indicators portlet, the dashboard includes the following portlets that help monitor data privacy compliance:
Overall Total Activities
This portlet uses a doughnut chart to compare the number of activities on customer records for your chosen time period.
You can filter the doughnut chart by time period using the following options:
-
Day - The doughnut chart compares today's total activities to yesterday's.
-
Week - The doughnut chart compares total activities for this week and last week. This filter also considers the day and preferences set in the First Day of Week field of your General Personal Preferences. For more information, see General Personal Preferences.
-
Month - The doughnut chart compares total activities for this month and last month.
The following screenshot shows the Overall Total Activities portlet:
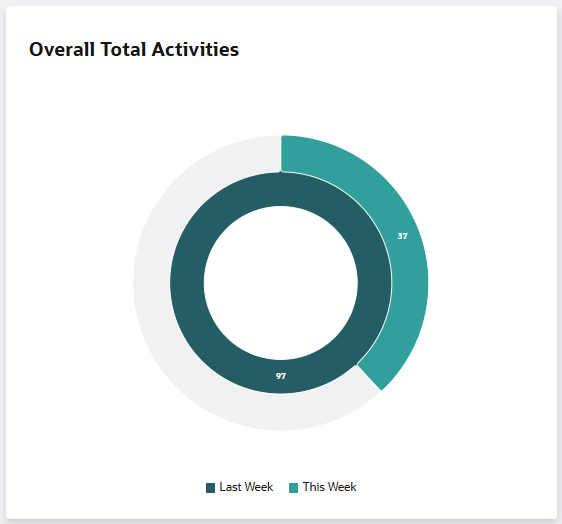
The inner ring represents the total activities from the previous period.
The outer ring represents the current period's total activities, and its color fills based on the difference from the inner ring's value.
Hover over the colored sections of the rings to see the comparative percentages.
Total Activity Trend
This portlet shows a graph of KPI updates over the past twelve months, compared to the target threshold.
Use the portlet's dropdown to select a KPI and see its 12-month trend.
The following screenshot shows the Total Activity Trend portlet:
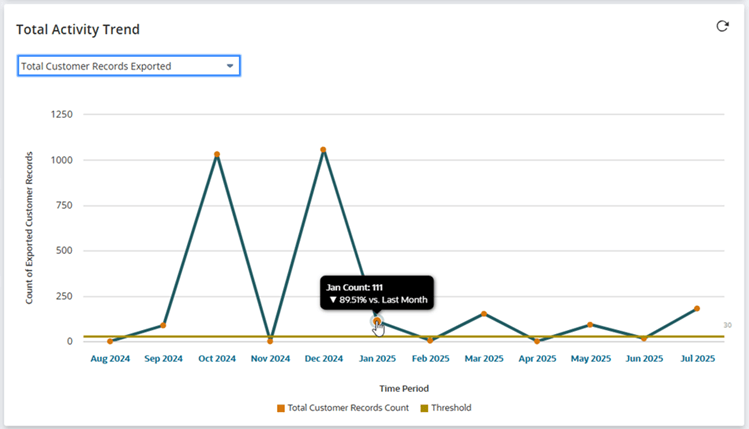
Hover over the points in the graph to see the percentage increase or decrease against the previous month.
Clicking a month also expands the graph to show the daily trend of the KPI against its daily threshold. You can also hover over the graph's points to see the percentage change from the previous day.
For more information about setting threshold limits, see KPI Settings and Daily Threshold Limits.
Quick Search
This portlet allows for a quick search of the Compliance 360 activity log.
To perform a quick search:
-
Go to Compliance 360 > Dashboard > View.
-
In the Quick Search portlet:
-
From the Search For dropdown list, select one from the following:
-
Customer - if you want to search for a particular customer record
-
User - if you want to search for a particular user in the account
-
-
In the Search field, enter the name of the customer or user that you are searching for.
-
Click Search.
You will be directed to the Compliance 360 Activity Log where the search results are listed.
-
Quick Links
This portlet provides the links to the following lists:
-
User List - lists the existing users in the account
-
Customer List - lists the existing customers in the account
Total NetSuite Logins
This portlet uses a doughnut chart to show successful NetSuite logins for the chosen time period.
You can filter the doughnut chart by time period using the following options:
-
Day - The doughnut chart compares today's NetSuite logins to yesterday's.
-
Week - The doughnut chart compares NetSuite logins for this week and last week. This filter also considers the day and preferences set in the First Day of Week field of your General Personal Preferences. For more information, see General Personal Preferences.
-
Month - The doughnut chart compares NetSuite logins for this month and last month.
The following screenshot shows the Total NetSuite Logins portlet:
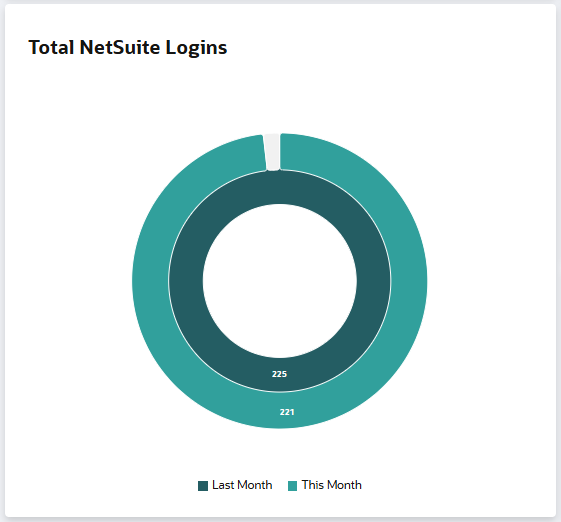
The inner ring represents NetSuite logins from the previous period.
The outer ring represents NetSuite logins from the current period, and its color fill indicates the difference from the inner ring's value.
Hover over the colored sections of the rings to see the comparative percentages.
Audit Status
This portlet displays a pie chart that compare the number of In Progress and Completed Audits based on the audit log date.
You can filter the pie chart by time period using the following options:
-
Day - The pie chart compares audit statuses for a specific day.
-
Week - The pie chart compares audit statuses for this week and last week. This filter also considers the day and preferences set in the First Day of Week field of your General Personal Preferences. For more information, see General Personal Preferences.
-
Month - The pie chart compares audit statuses for this month and last month.
Hover over the pie chart's colors to see the breakdown of each audit status compared to the total audits for each period.
Total User Activity
This portlet displays a bar graph that shows the activities performed in the account per user, including the count of each activity.
The following activities are tracked and compared per user, each represented by a different color:
-
Delete
-
Edit
-
Create
-
View
-
Export
-
Print
-
Search
-
Report
-
SuiteAnalytics
-
Messaging
-
Script Execution
Hover over the bars and colors to see the breakdown of each activity compared to the user's total activities.
You can filter the graph by time period using the following options:
-
Day - The graph compares today's user activities to yesterday's.
-
Week - The graph compares user activities for this week and last week. This filter also considers the day and preferences set in the First Day of Week field of your General Personal Preferences. For more information, see General Personal Preferences.
-
Month - The graph compares user activities for this month and last month.
Total Customer Activity
This portlet uses a bar graph to show activity counts per customer in the account.
The following activities are tracked and compared per user, each represented by a different color:
-
Delete
-
Edit
-
Create
-
View
-
Export
-
Print
-
Search
-
Report
-
SuiteAnalytics
-
Messaging
-
Script Execution
Hover over the bars and colors to see the breakdown of each activity compared to the total activities per customer.
You can filter the graph by time period using the following options:
-
Day - The graph compares today's actions to yesterday's.
-
Week -The graph compares actions for this week and last week. This filter also considers the day and preferences set in the First Day of Week field of your General Personal Preferences. For more information, see General Personal Preferences.
-
Month - The graph shows the count of actions done for current month versus last month.
Total Customer Records Activity
This portlet uses a trend chart to show the total customer records accessed over a selected time period.
You can filter the graph by time period using the following options:
-
Day - The trend chart displays customer record access over the past 10 days.
-
Week - The trend chart displays customer record access over the past 10 weeks. This filter also considers the day and preferences set in the First Day of Week field of your General Personal Preferences. For more information, see General Personal Preferences.
-
Month - The trend chart displays customer record access over the past 10 months.
Hover over the graph points to see the total customer records accessed for that time period.
Total Audit Trend
This portlet uses a bar graph to show the audit count for each month over the last 12 months.
Click on a bar or month in the graph to show the audit count and audit status for that month.