How to Start the SOA Debugger
To start the SOA debugger:
-
Start the Integrated WebLogic Server. For information about starting the Integrated WebLogic Server with the Start Server Instance option, see Section "Installing Oracle SOA Suite Quick Start for Developers" of Installing SOA Suite and Business Process Management Suite Quick Start for Developers.
-
Start the SOA debugger in either of the following ways. This is limited to single composite debugging.
-
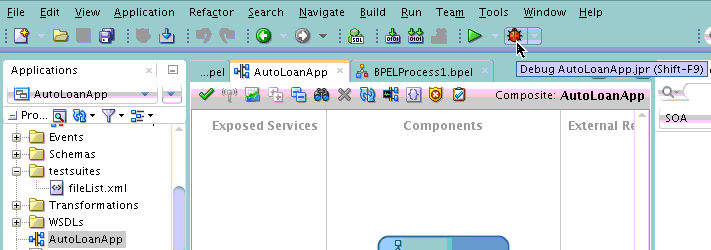
Click the debugger icon above the SOA Composite Editor, as shown in Figure 50-1.
Figure 50-1 Debugger Icon in SOA Composite Editor

Description of "Figure 50-1 Debugger Icon in SOA Composite Editor" -
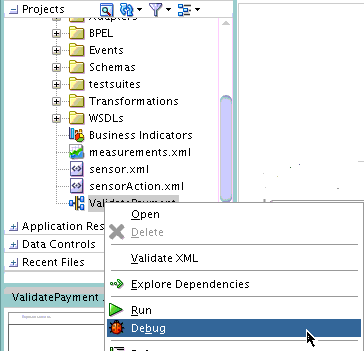
Right-click the SOA composite application in the Applications window, and select Debug. Figure 50-2 provides details.
Figure 50-2 Debug Menu Option for a SOA Composite Application in the Applications Window

Description of "Figure 50-2 Debug Menu Option for a SOA Composite Application in the Applications Window"
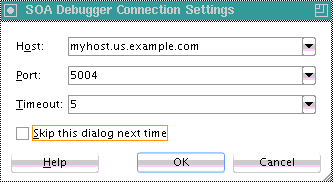
The SOA Debugger Connection Settings dialog is displayed, as shown in Figure 50-3. This dialog enables you to define the SOA debugging server to use.
Figure 50-3 SOA Debugger Connection Settings Dialog

Description of "Figure 50-3 SOA Debugger Connection Settings Dialog" -
-
Enter values appropriate to your environment, and click OK. Table 50-1 provides details.
Table 50-1 SOA Debugger Connection Setting Dialog
Field Description Host
Select the debugging server to which to connect. By default, the name of the local host is displayed. This is the embedded Integrated WebLogic Server in Oracle JDeveloper. You can also enter a remote server. When a project is imported from a different host, the host that was used there is displayed here.
Port
Enter the port on which the debugging agent listens. The default value is
5004. Debugging is automatically enabled in development environments when you install the Oracle SOA Suite Developer Quick Install. The debugger cannot be enabled in production mode or when the server is part of a cluster. For development environments, the debugger can be overridden by adding the following property settings in thesetDomainEnv.shfile.export SOA_DEBUG_FLAG="true" export SOA_DEBUG_PORT="5004"
Timeout
Specify in minutes how long the client should wait while attempting to establish a debugging session before stopping. The default value is
5minutes. For synchronous processes, you can increase the default value:-
Increase the SyncMaxWaitTime property in Oracle Enterprise Manager Fusion Middleware Control. For more information, see How To Specify Transaction Timeout Values.
-
Increase the Idle Timeout and Transaction Timeout values for the Enterprise JavaBeans property BPELDeliveryBean in Oracle WebLogic Server Administration Console. For information about accessing these properties, see the "Long Running, Synchronous Calls To Remote Web Services Error Out or Asynchronous Transactions Return with an Error after a Long Time" section of Administering Oracle SOA Suite and Oracle Business Process Management Suite.
-
Increase the Java Transaction API (JTA) timeout value located under the JTA link on the Oracle WebLogic Server Administration Console home page.
Skip this dialog next time
Select to skip this dialog the next time you begin a debugger session. The settings you previously defined are used.
You can display this dialog again by right-clicking the project in the Applications window. Select Project Properties > Run/Debug > Edit > Tool Settings > Debugger > Remote, and select the Show Dialog Box Before Connecting Debugger check box.
Note:
You can also edit these properties by right-clicking the project in the Applications window, and selecting Project Properties > Run/Debug > Edit > Tool Settings > Debugger > Remote.
A check is made to determine if the SOA composite application selected for debugging is deployed. Table 50-2 provides details.
Table 50-2 Check to Determine if the SOA Composite Application is Deployed
If the SOA Composite Application Is... Then... Deployed
The following message is displayed on the right handle of the service binding component:
Use context menu to initiate WS debugging
See Figure 50-5 for an example of this message.
You are ready to begin debugging. Go to How to Set Breakpoints and Initiate Debugging.
-
Not deployed
-
Deployed, but there has been a design change in the composite since it was deployed.
Note: Composites deployed a second time with the Overwrite any existing composites with the same revision ID check box selected do not require an additional redeployment.
-
Deployed, but you removed the Oracle JDeveloper system folder. The system folder is identified by selecting Help > About > Properties, and searching for ide.system.dir.
-
Deployed in one Oracle JDeveloper, but the ZIP file of the SOA composite application was opened in a different installation of Oracle JDeveloper.
The Deployment Action page of the Deploy Project_Name wizard is displayed, and you must deploy the composite.
-
Select Deploy to Application Server.
-
Follow the pages of the wizard to deploy the SOA composite application to an application server.
For information about deploying SOA composite applications, see Deploying the Profile.
-
When deployment is complete, go to How to Set Breakpoints and Initiate Debugging.
You are ready to begin a debugging session when the following message is displayed in the Log window:
Debugger attempting to connect to remote process at host_name 5004
Debugger connected to remote process at host_name 5004
Debugger process virtual machine is SOA Debugger.
-