Exadata Fleet Capacity
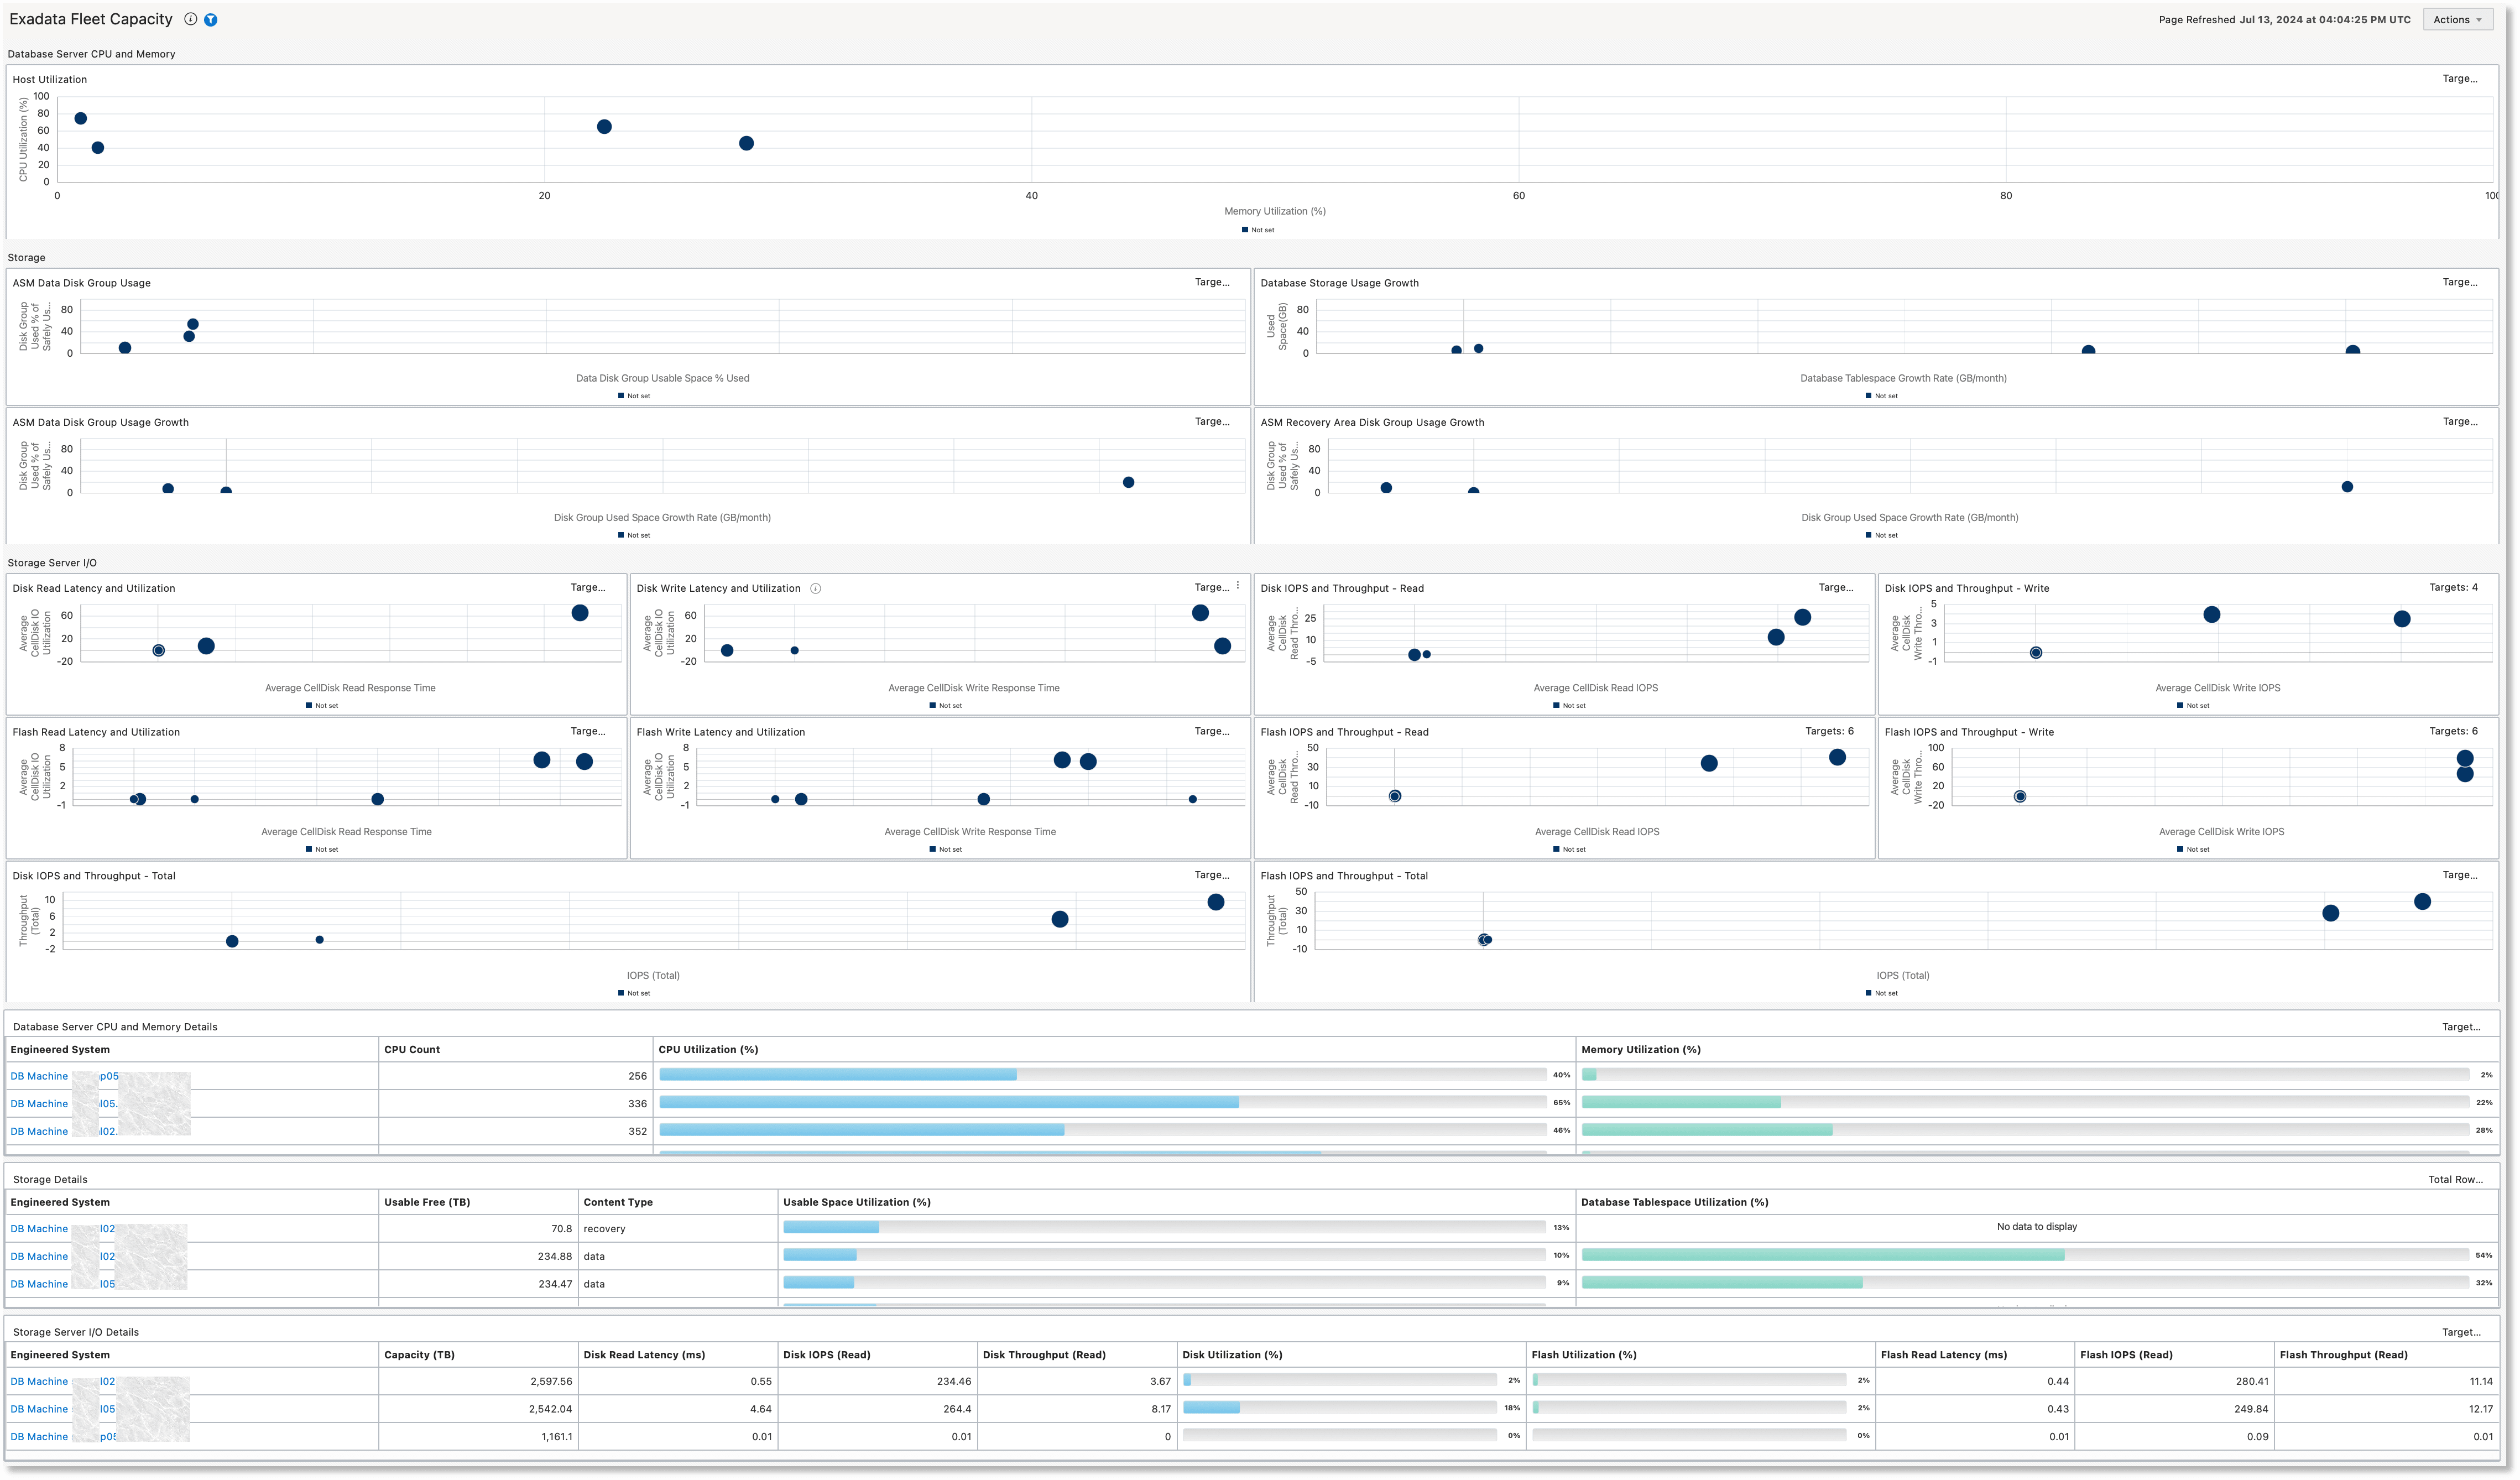
The Exadata Fleet Capacity dashboard shows individual Exadata capacity averaged over the last 31 days across the Exadata and Recovery Appliance fleet or filtered subset of the fleet, allowing comparison by system.

The dashboard includes multiple sections that provide detailed insights into specific dimensions of fleet resource capacity like host utilization, storage utilization, I/O performance, CPU, memory, disk usage, and IOPS (input/output operations per second). Detailed descriptions for each section are provided below:
- Database Server CPU and Memory
- Storage
- Storage Sever I/O
- Database Server CPU and Memory Details
- Storage Details
- Storage Server I/O Details
Database Server CPU and Memory
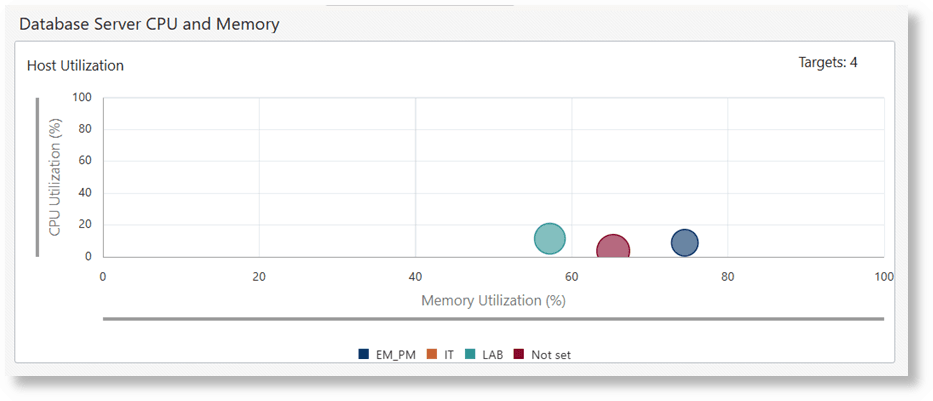
The Host Utilization bubble chart in this section visualizes the average utilization of CPU and memory across all hosts (database servers) in an Engineered Systems over the past month.

- X-axis (Memory Utilization %): Represents the memory utilization percentage, ranging from 0% to 100%
- Y-axis (CPU Utilization %): Represents the CPU utilization percentage, ranging from 0% to 100%
- Bubbles: Each bubble corresponds to a different Engineered System.
- The size of the bubble indicates the total CPU count of the database servers in an Engineered System, with larger bubbles representing Engineered Systems with a higher number of CPUs.
- The color of the bubbles is determined by the Group By filter setting.
- Tooltip: A tooltip provides detailed information for a
specific Engineered System when hovered over. For example, the Database Machine
target shown in the example above has a CPU utilization of 65.34%, memory
utilization of 22.46%, and a CPU count of 336. The lifecycle status for this
target is not set.
In all the bubble charts, the tooltip displays the values for the target property as specified in the Group By filter. The bubble color is determined by the value of the specified target property.
Storage
This section presents an overview of the storage utilization through four scatter plots, offering insights into disk space usage and growth.

-
ASM Data Disk Group Usage: The chart shows the average usage across all ASM disk groups used for storing datafiles across all the clusters in an Engineered System over the past month.
- Y-axis: Space used by disk groups as a percentage of safely usable space
- X-axis: Disk group percentage of usable space used
- Bubbles: Each bubble represents an Engineered System. The size of the bubble is proportional to the total capacity of all disk groups used for storing datafiles across all the ASM clusters in the Engineered System.
-
Database Storage Usage Growth: The chart shows the average database storage usage growth of Engineered Systems in the fleet over the past month.
- Y-axis: Used space in GB
- X-axis: Database tablespace growth rate in GB/month
- Bubbles: Each bubble represents an Engineered System. The size of the bubble is proportional to the allocated storage capacity of all the databases on the Engineered System.
-
ASM Data Disk Group Usage Growth Chart: The chart shows the average usage growth across all ASM disk groups used for storing datafiles across all the clusters in an Engineered System over the past month.
- Y-axis: Space used by disk groups as a percentage of safely usable space
- X-axis: Disk group used space growth rate in GB/month
- Bubbles: Each bubble represents an Engineered System. The size of the bubble is proportional to the total capacity of all disk groups used for storing datafiles across all the ASM clusters in the Engineered System.
-
ASM Recovery Area Disk Group Usage Growth: The chart shows the average usage across all ASM disk groups used for storing recovery files across all the clusters in an Engineered System over the past month.
- Y-axis: Space used by disk groups as a percentage of safely usable space
- X-axis: Disk group used space growth rate in GB/month
- Bubbles: Each bubble represents an Engineered System. The size of the bubble is proportional to the total capacity of all disk groups used for storing recovery files across all the ASM clusters in the Engineered System.
The disk group content type for these charts is determined by examining the value of
the ASM content.type attribute: data indicates datafiles,
recovery indicates recovery files.
Storage Sever I/O
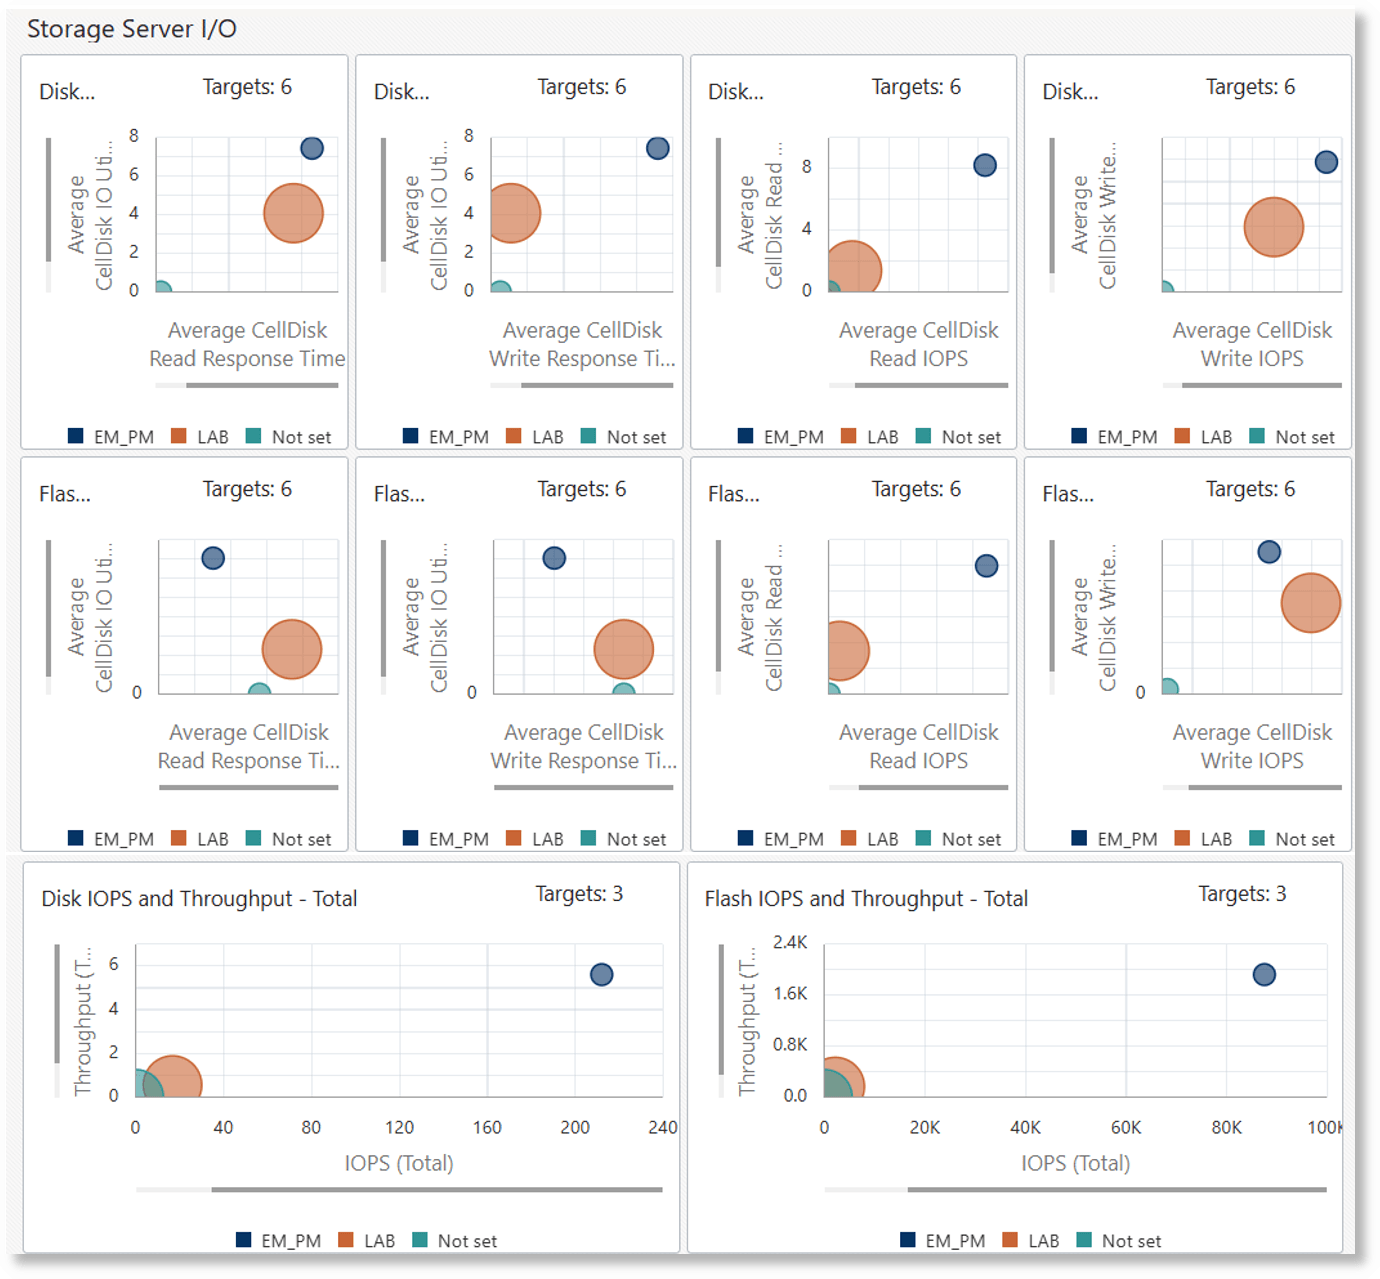
This section provides an overview of the various performance metrics related to I/O serviced by flash and hard disks across all Engineered System storage servers. Each chart provides detailed insights into different aspects of storage performance, including latency, utilization, IOPS, and throughput. Each bubble on the charts represents an Engineered System. The size of the bubble is proportional to the number of storage servers on the Engineered System.

- Disk Read Latency and Utilization: The chart shows the
average read latency and utilization values of the storage server disks over the
past month.
- Y-axis: Average Disk I/O Utilization
- X-axis: Average Disk Read Response Time
-
Disk Write Latency and Utilization: The chart shows the average write latency and utilization values of the disk storage over the past month.
- Y-axis: Average Disk I/O Utilization
- X-axis: Average Disk Write Response Time
-
Disk IOPS and Throughput - Read: The chart shows the average IOPS and throughput values of read operations on the disk storage over the past month.
- Y-axis: Average Disk Read Throughput
- X-axis: Average Disk Read IOPS
-
Disk IOPS and Throughput - Write: The chart shows the average IOPS and throughput values of write operations on the disk storage over the past month.
- Y-axis: Average Disk Write Throughput
- X-axis: Average Disk Write IOPS
-
Flash Read Latency and Utilization: The chart shows the average read latency and utilization values of the flash storage over the past month.
- Y-axis: Average Disk I/O Utilization
- X-axis: Average Disk Read Response Time
-
Flash Write Latency and Utilization: The chart shows the average read latency and utilization values of the flash storage over the past month.
- Y-axis: Average Disk I/O Utilization
- X-axis: Average Disk Write Response Time
-
Flash IOPS and Throughput - Read: The chart shows the average IOPS and throughput values of read operations on the flash storage over the past month.
- Y-axis: Average Disk Read Throughput
- X-axis: Average Disk Read IOPS
-
Flash IOPS and Throughput - Write: The chart shows the average IOPS and throughput values of write operations on the flash storage over the past month.
- Y-axis: Average Disk Write Throughput
- X-axis: Average Disk Write IOPS
-
Disk IOPS and Throughput - Total: The chart shows the average IOPS and throughput values for both read and write operations on the disk storage over the past month.
- Y-axis: Throughput (Total)
- X-axis: IOPS (Total)
-
Flash IOPS and Throughput - Total: The chart shows the average IOPS and throughput values for both read and write operations on the flash storage over the past month.
- Y-axis: Throughput (Total)
- X-axis: IOPS (Total)
Database Server CPU and Memory Details
The Database Server CPU and Memory Details table summarizes CPU and memory utilization for Engineered Systems. This table allows comparison of resource usage across different systems, which can be useful for performance monitoring, capacity planning, and identifying potential bottlenecks in CPU and memory utilization.

The table contains the following columns:
- Engineered System: Name of the Engineered System. Click the name of the target to navigate to its home page.
- CPU Count: Number of CPUs for each system
- CPU Utilization (%): Average CPU utilization usage, averaged over the last 31 days
- Memory Utilization (%): Memory utilization percentage, averaged over the last 31 days
Storage Details
The Storage Details table provides an overview of the storage details for Engineered Systems. This table allows comparison of storage utilization across different systems, which can provide insights into free space availability, content distribution, and the efficiency of space utilization in both general storage and specific database tablespaces.

The table includes the following columns:
- Engineered System: Name of the Engineered System. Click the name of the target to navigate to its home page.
- Usable Free (TB): Amount of usable free space available in TB
- Content Type: Type of content stored; for example, data or recovery.
- Usable Space Utilization (%): Percentage of usable space utilization
- Database Tablespace Utilization (%): Percentage of database tablespace utilization
Storage Server I/O Details
The Storage Server I/O Details table provides a detailed overview of I/O performance metrics for various Engineered Systems in tabular format. This table allows comparison of I/O performance and utilization across different systems, which can provide insights into storage efficiency and performance bottlenecks in both disk and flash storage.

The table includes the following columns:
- Engineered System: Name of the Engineered System. Click the name of the target to navigate to its home page.
- Capacity (TB): Storage capacity in TB
- Disk Read Latency (ms): Latency for disk reads in milliseconds
- Disk IOPS (Read): Number of input/output operations per second for disk reads
- Disk Throughput (Read): Read throughput for disk storage
- Disk Utilization (%): Percentage of disk utilization
- Flash Read Latency (ms): Latency for flash reads in milliseconds
- Flash IOPS (Read): Number of input/output operations per second for flash reads
- Flash Throughput (Read): Read throughput for flash storage
- Flash Utilization (%): Percentage of flash utilization