4.10 Use the Conda Interpreter in a Notebook Paragraph
Oracle Machine Learning Notebooks provides a Conda interpreter to enable administrators to create conda environments with custom third-party Python and R libraries. Once created, you can download and activate Conda environments inside a notebook session also using the Conda interpreter.
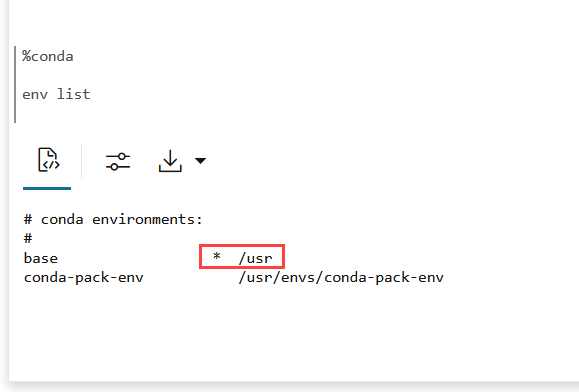
An Oracle Machine Learning notebook supports multiple languages. For this, you must create a notebook with some paragraphs to run SQL queries, and other paragraphs to run PL/SQL scripts. To run a notebook in different scripting languages, you must first connect the notebook paragraphs with the respective interpreters such as SQL, PL/SQL, R, Python, or Conda.
- Connect to the Conda interpreter
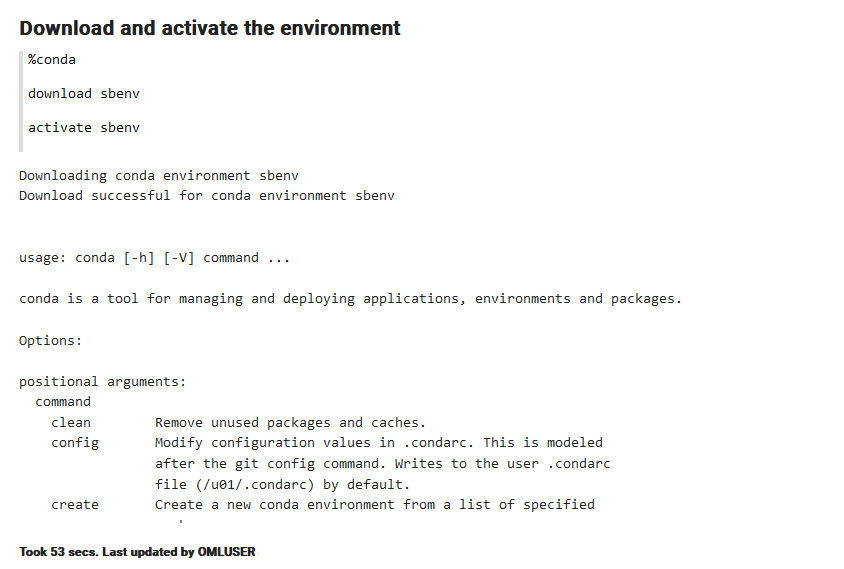
- Download and activate the Conda environment
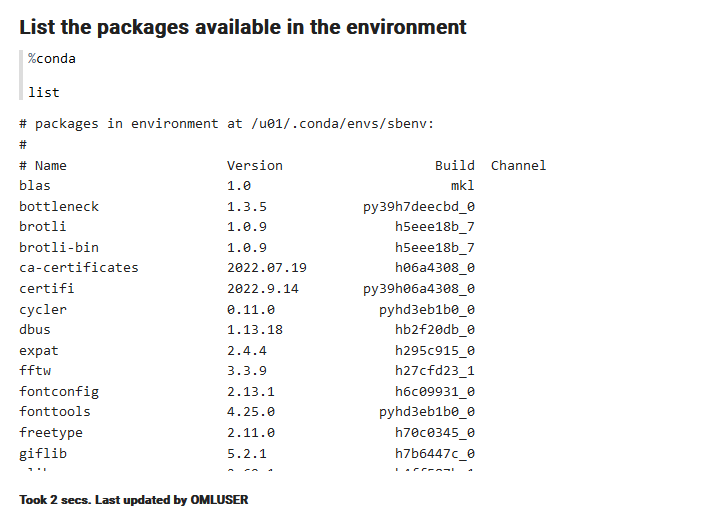
- View the list of packages in the Conda environment
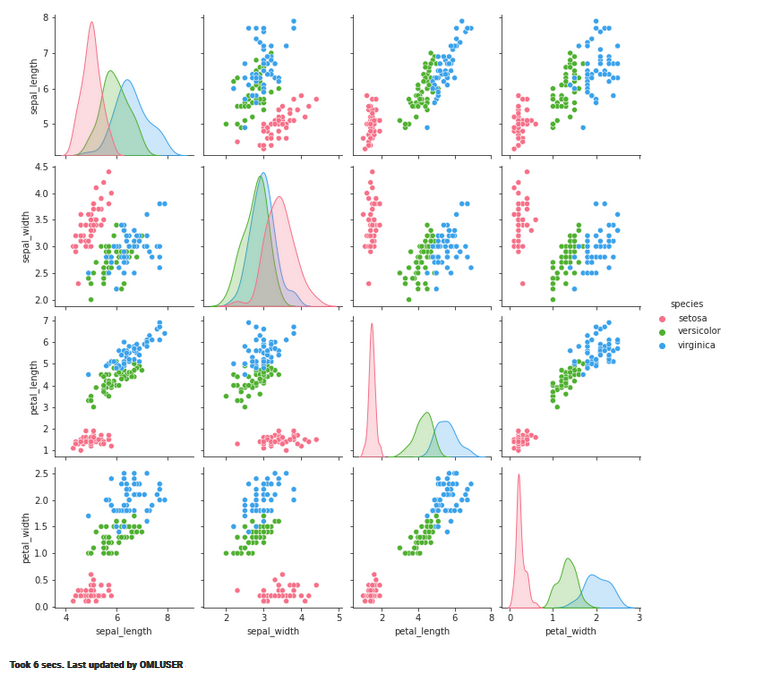
- Run a Python function to import the Iris dataset, and use the seaborn package for visualization
- About the Conda Environment and Conda Interpreter
Conda is an open-source package and environment management system that allows the use of environments containing third-party Python and R libraries. Oracle Machine Learning User Interface (UI) provide the conda interpreter to install third-party Python and R libraries inside a notebook session. - Conda Interpreter Commands
This table lists the commands for the Conda interpreter. - Create a Conda Environment for Python, Install a Python Package and Upload it to Object Storage
This topic demonstrates how to create a Conda environmentmypyenvfor Python packages, with Python 3.13.5 that is compatible with OML4Py. Here, you will also install the Python package seaborn from theconda-forgechannel, and upload the Conda environmentmypyenvto object storage. - Create a Conda Environment for R and Install R Package and Upload it to Object Storage
This topic shows how to create a Conda environmentmyrenvfor R packages, with R-4.0.5 for OML4R compatibility, install theforecastpackage, and upload the Conda environment to object storage. - Upload the Conda environments to an Object Storage bucket associated with the Autonomous AI Database
There is one Object Storage bucket for each data center region. The Conda environment is saved to a folder in Object Storage corresponding to the tenancy and database. The folder is managed by Autonomous AI Database and is only available to users through Oracle Machine Learning Notebooks. There is an 8G maximum size for a single Conda environment, and no size limit on Object Storage.
Parent topic: OML Notebooks
4.10.1 About the Conda Environment and Conda Interpreter
Conda is an open-source package and environment management system that allows the use of environments containing third-party Python and R libraries. Oracle Machine Learning User Interface (UI) provide the conda interpreter to install third-party Python and R libraries inside a notebook session.
- Standard Python
- Standard R
- Oracle Machine Learning for Python embedded Python execution from the Python, SQL and REST APIs
- Oracle Machine Learning for R embedded R execution from the R, SQL, and REST APIs
To start working in the Conda environment:
- Ensure that a Conda environment is saved to Object Storage, or update an existing
package by installing a new version.
Note:
You must be signed in as ADMIN user to create the Conda environment. The administrator manages the lifecycle of an environment, including adding or deleting packages from it, and removing environments. The Conda environments are stored in an Object Storage bucket associated with the Autonomous AI Database. - Sign into Oracle Machine Learning UI and download the Conda environment. To download the Conda environment, type:
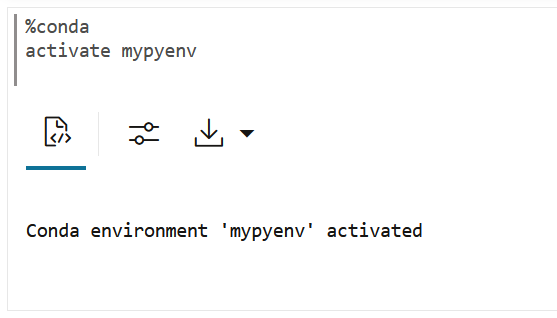
%condadownload myenv - Activate the Conda environment. To activate the Conda environment, type:
activate myenvNote:
There is only one active Conda environment at a given point in time. - Create a notebook, use the Conda interpreter to use third-party libraries in the Object Storage. To use the Conda interpreter, type
%condaat the beginning of the paragraph to connect to the Conda environment, and work with third-party libraries for Python. You can switch between the preinstalled Conda environments. For example, you can have an environment for working with Graph analysis, and another environment for Oracle Machine Learning analysis. - Deactivate the Conda environment. As a best practice, deactivate the Conda environment after you have finished working on your machine learning analysis. To deactivate the environment, type:
deactivate
Parent topic: Use the Conda Interpreter in a Notebook Paragraph
4.10.2 Conda Interpreter Commands
This table lists the commands for the Conda interpreter.
Conda Interpreter Commands
Table 4-1 Conda Interpreter Commands
| Tasks | Commands | Role |
|---|---|---|
| Create a Conda environment. | create -n <env_name> <python_version> |
|
Remove a list of packages from a specified conda environment. It is also an alias for conda uninstall.
|
remove -n <env_name> --allNote: The Conda environment is deleted from the user session. |
|
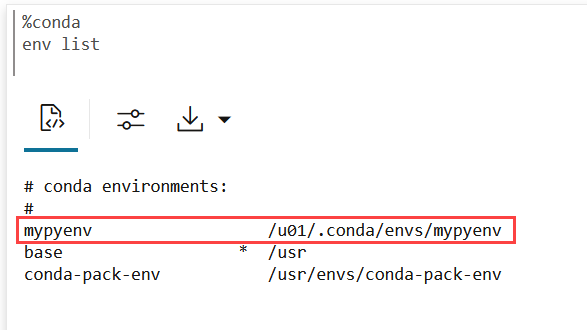
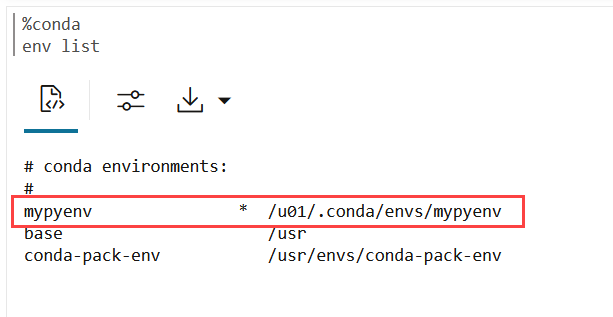
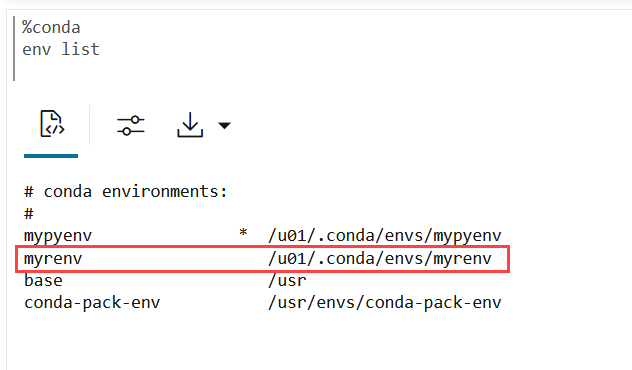
| List user-created local environment. | env list |
|
| Remove user-created local environment. | env remove -n <env_name> |
|
| List all packages and versions installed in active environment. | list |
|
| Activate a user-created local environment. | activate -n <env_name> |
|
| Deactivate the current environment. | deactivate |
|
| Install an external package from a public Conda channel. | install -n <env_name> <package_name> |
|
Uninstall a specific package from a Conda environment. It is also an alias for remove.
|
uninstall -n <env_name> <package_name> |
|
| Display information about current conda install. | info |
|
| View the command line help. | COMMANDNAME --help |
|
| Upload a Conda environment to object storage.
Note: This is an Oracle Autonomous AI Database specific command. |
upload --overwrite <env_name> --description 'some description' -t <name> <value>Note: You can provide many tags. For example:-t <name1> <value1> -t <name2> <value2> .. |
|
| Download and unpack a specific Conda environment from the object storage.
Note: This is an Oracle Autonomous AI Database specific command. |
download --overwrite <env_name> |
|
| List local environments available to the user. | list-local-envs |
|
| List all Conda environments in the object storage.
Note: This is an Oracle Autonomous AI Database specific command. |
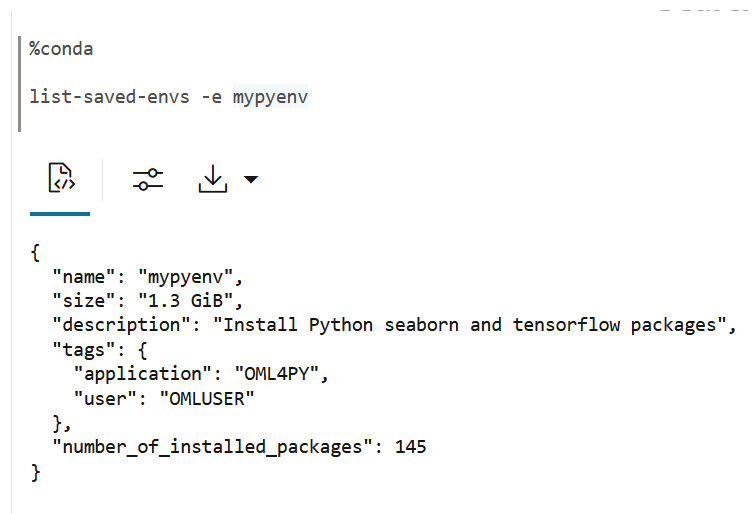
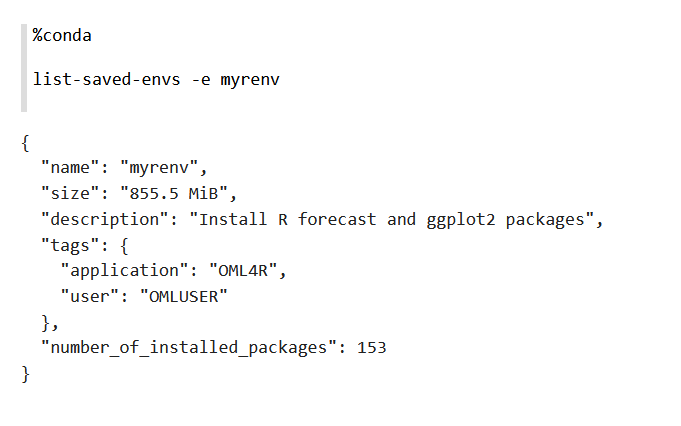
list-saved-envs --installed-packages -e <env_name> |
|
| Delete a Conda environment.
Note: This is an Oracle Autonomous AI Database specific command. |
delete <env_name>Note: The Conda environment is deleted from the Object Storage. |
|
| Update conda packages to the latest compatible version. | update |
|
Upgrade the current conda package. It is also an alias for conda update.
|
upgrade |
|
Search for packages and display associated information. The input is a MatchSpec, a query language for conda packages.
|
search |
|
Parent topic: Use the Conda Interpreter in a Notebook Paragraph
4.10.3 Create a Conda Environment for Python, Install a Python Package and Upload it to Object Storage
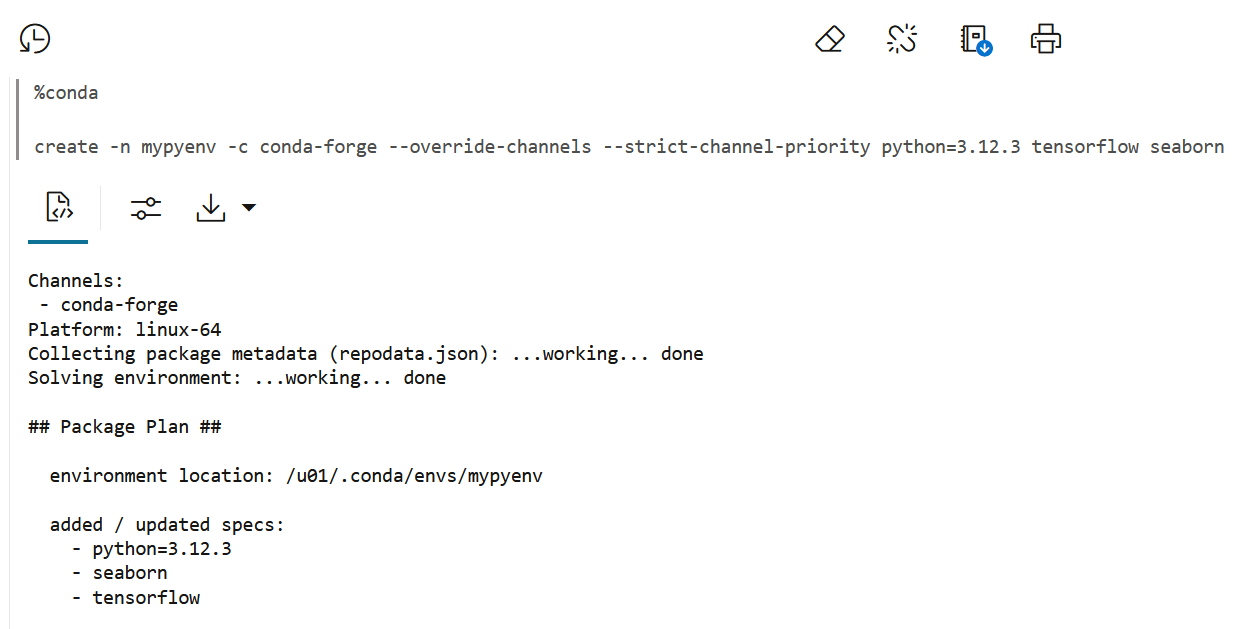
This topic demonstrates how to create a Conda environment
mypyenv for Python packages, with Python 3.13.5 that is compatible with
OML4Py. Here, you will also install the Python package seaborn from the
conda-forge channel, and upload the Conda environment
mypyenv to object storage.
conda-forge channel is a
community channel made up of thousands of contributors, and is free for all to use. You
can modify what remote channels are automatically searched. You might want to do this to
maintain a private or internal channel.
Note:
You must be signed in as ADMIN user to create the Conda environment.Note:
To avoid version conflicts, please do not install packages that are already included in OML4Py. For a complete list of pre-installed packages and their versions, see Python Libraries in OML4Py.Parent topic: Use the Conda Interpreter in a Notebook Paragraph
4.10.4 Create a Conda Environment for R and Install R Package and Upload it to Object Storage
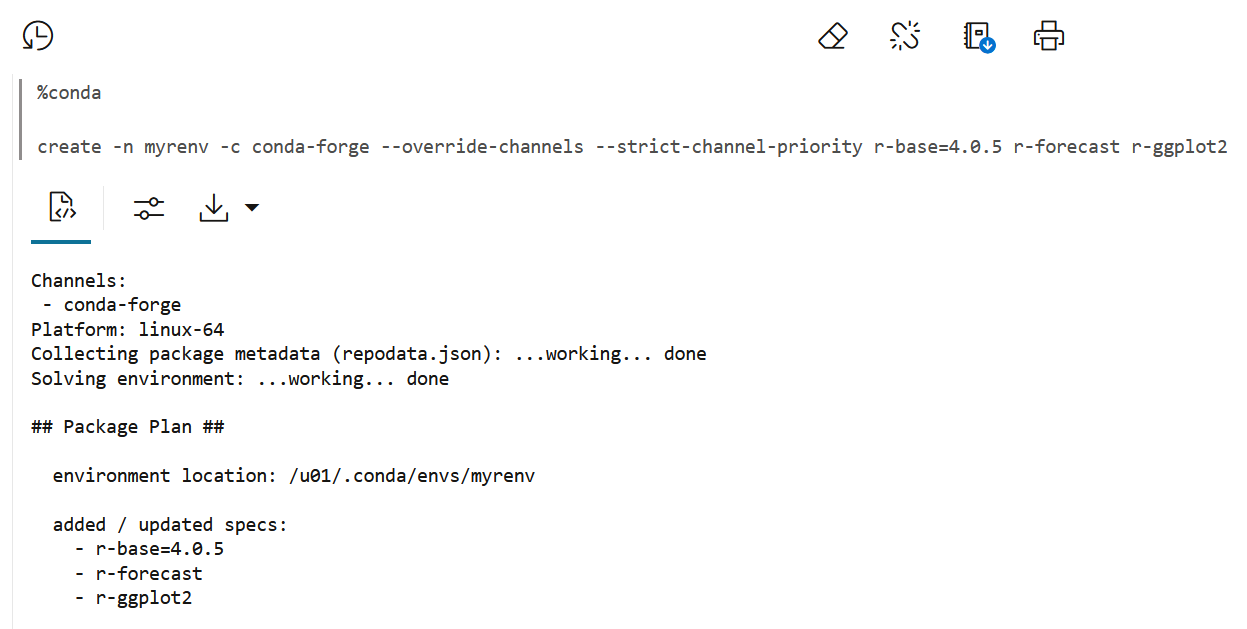
This topic shows how to create a Conda environment myrenv
for R packages, with R-4.0.5 for OML4R compatibility, install the forecast
package, and upload the Conda environment to object storage.
Note:
You must be signed in as ADMIN user to create the Conda environment.Note:
To avoid version conflicts, please do not install packages that are already included in OML4R. For a complete list of pre-installed packages and their versions, see About the OML4R Supporting Packagesmyrenv with
R-4.0.5 for OML4R compatibility, install the package forecast, and
upload the Conda environment myrenv to object storage:
Parent topic: Use the Conda Interpreter in a Notebook Paragraph
4.10.5 Upload the Conda environments to an Object Storage bucket associated with the Autonomous AI Database
There is one Object Storage bucket for each data center region. The Conda environment is saved to a folder in Object Storage corresponding to the tenancy and database. The folder is managed by Autonomous AI Database and is only available to users through Oracle Machine Learning Notebooks. There is an 8G maximum size for a single Conda environment, and no size limit on Object Storage.
upload command. You will provide environment
descriptions and tags, one for the user name and one for the application name. You will
also overwrite any environment with the same name if it exists. The application tag is
required for use with embedded execution. For example, OML4Py embedded Python execution
works with Conda environments containing the OML4PY tag.
mypyenv and myrenv to the Object Storage
associated with the Autonomous AI Database. The environments are now available for you to download and use. The environments
will remain in the Object Storage until it is deleted.
Parent topic: Use the Conda Interpreter in a Notebook Paragraph
