Viewing SOAP Web Services Operation Details
SOAP Web Services Operation Details shows these portlets:
-
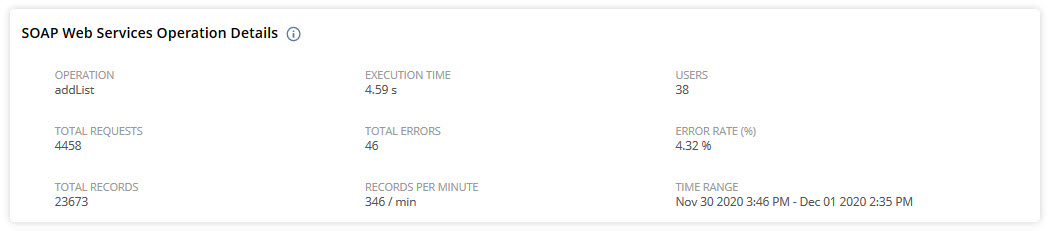
SOAP Web Services Operation Details - A summary of data for the web service operation, including total records, request counts, error rate, and execution time.
-
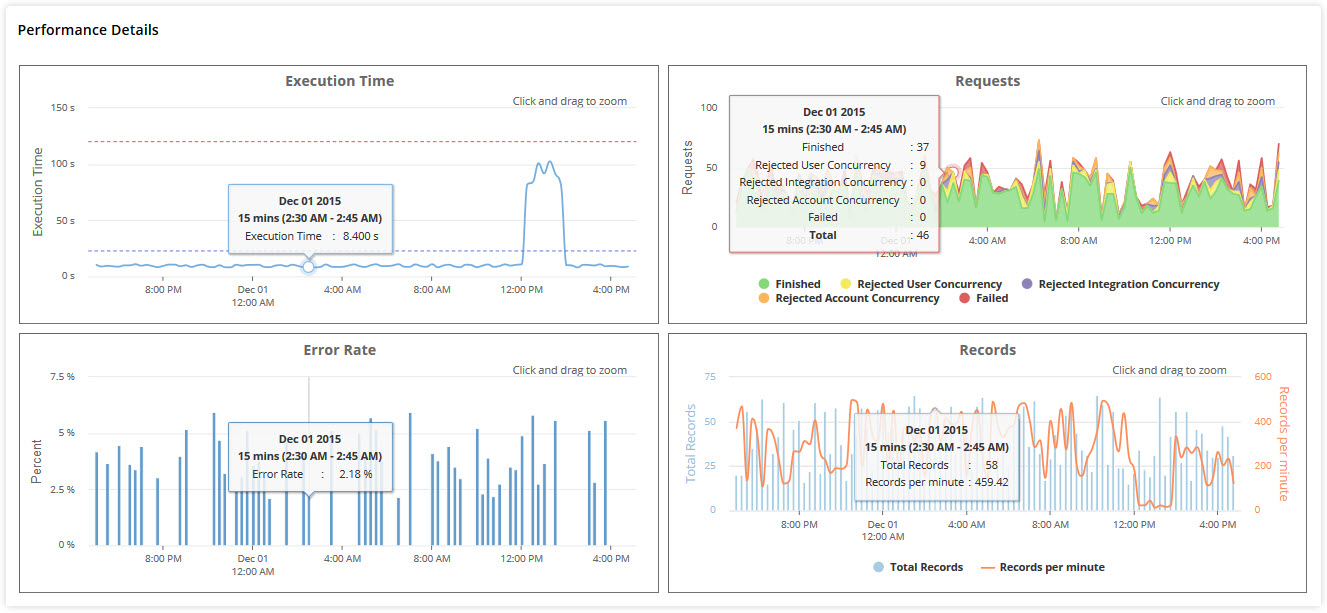
Performance Details - These four charts show execution time, error rate, requests, and records for the operation at different times. Click any data point to open the Web Services Operation Logs window. For more, see Web Services Operation Logs.
-
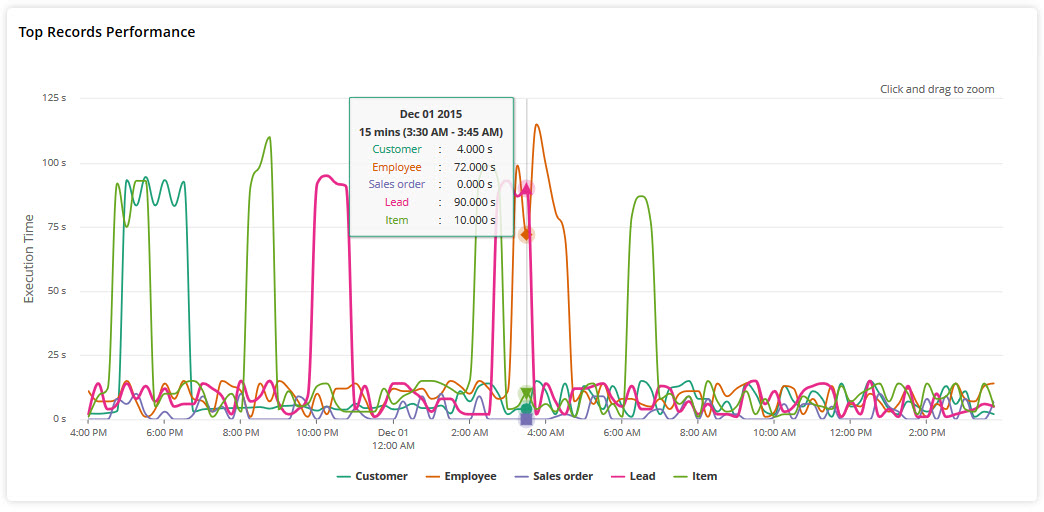
Top Records Performance - This line graph compares execution times for each record type at different times. You can see up to five record types at the same time. Click a data point to open the Web Services Record Processing Logs window. For more, see Web Services Record Processing Logs.