Monitoring Top SOAP Web Services Operations
The Top SOAP Web Services Operations portlet helps you track how your top SOAP-based web services performed.
Use this portlet to spot trends, find inconsistencies, and make smart changes to your operations.
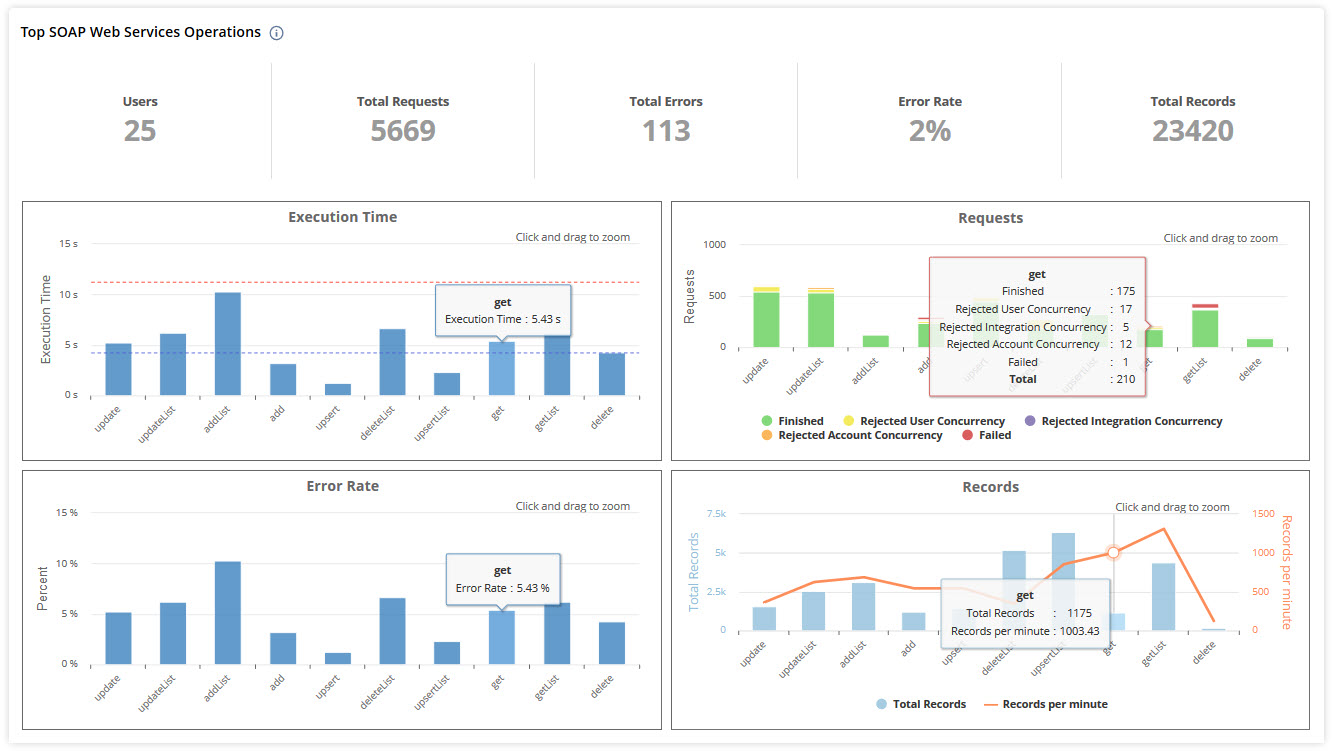
The Top SOAP Web Services Operations portlet includes overview statistics that show the following:
-
Users - The total number of users for the top operations.
-
Total Requests - The total number of requests for the top operations.
-
Total Errors - The total number of errors that occurred when the top operations ran.
-
Error Rate - The percentage of errors for the top operations (errors compared to total requests).
-
Total Records - The total number of records for the top operations.
To see more details for any operation, click a data point to open the Web Services Operation Details page. For more information, see Viewing SOAP Web Services Operation Details.
The portlet shows visual data in charts for up to 10 operations. The portlet includes these charts:
-
Execution Time - The median time (in seconds) it takes for each operation to run.
-
Requests - The total number of requests for each operation, stacked to show which finished and which failed.
-
Error Rate - The percentage of errors for each operation.
-
Records - This chart compares total records per operation with records per minute.