Viewing SOAP Web Services Logs
SOAP Web Services Operations Details shows two sets of log tables: one for operation logs and one for record processing logs.
This page only shows instances that ran long enough to help you troubleshoot issues. This tool doesn't track all operations and records your account has processed.
Web Services Operation Logs
The Web Services Operation Logs window pops up when you click a data point in the Performance Details chart.
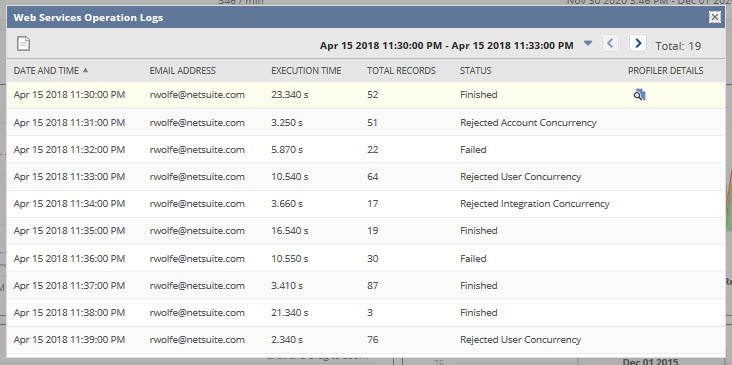
This window includes the following information:
-
Date and Time - The date and time for each instance.
-
Email Address - The user's email who ran the instance.
-
Execution Time - How long it took to run the instance.
-
Total Records - The total records accessed when the instance ran.
-
Status - The instance's status after it ran.
-
Profiler Details - Lets you click a view icon to open the Profiler Details page for the instance. Profiler Details gives you info about the timing and context of an operation, action, or request.
Web Services Record Processing Logs
The Web Services Record Processing Logs window pops up when you click a data point in the Performance Details chart.

This window includes the following information:
-
Date and Time - The date and time for each instance.
-
Email Address - The user's email who ran the instance.
-
Execution Time - How long it took to run the instance.
-
Record Type - The type of record processed.
-
Operation - The operation that was processed.
-
Profiler Details - Lets you click a view icon to open the Profiler Details page for the instance. Profiler Details gives you info about the timing and context of an operation, action, or request.