23 Working with Data Visualizations
Create, configure, and manage data visualizations using visualization templates to explore retrieved data visually.
Permissions:
To perform the tasks in this chapter, you need one of the following portal-level permissions:
-
Assets: Create, Edit, and Delete AssetsorCreate AssetsandEdit Assets(standard permissions) -
Application Integration Visualization: Manage Application Integration Visualization(advanced permissions)
See About Roles and Permissions for a Portal.
Note:
For a SQL data source, the database permissions required to view, update, or insert data using a data visualization are the same permissions that are required to view, update, or insert data into a table in the database. These permissions may includeCONNECT, SELECT, CREATE INDEXTYPE, CREATE SEQUENCE, CREATE SESSION, and CREATE TABLE. At a minimum, you will need CONNECT, RESOURCE, CREATE SESSION, and CREATE TABLE permissions to view and update the visualization, but you may require additional permissions depending on your specific use case.
23.1 About Data Visualizations
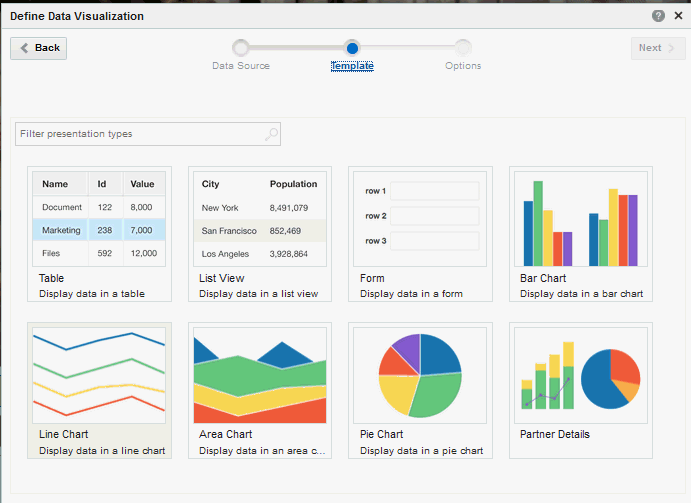
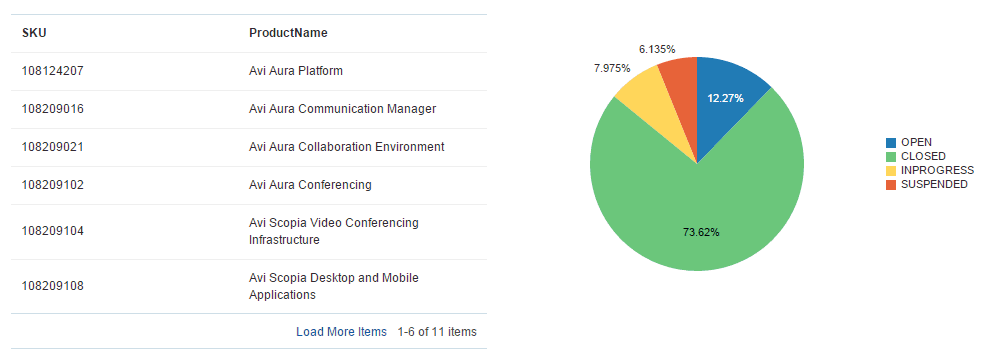
WebCenter Portal can retrieve data from a REST or SQL data source using a business object, simplifying the complexities of application integration. The retrieved data can be rendered on a portal page in a data visualization using a visualization template. For example, the data can be presented in one of the built-in visualization templates, or a developer can build a custom visualization template in JDeveloper.
The basic steps to accomplish this are:
-
Create data source. Create a REST or SQL data source from which to retrieve the data to present on the page (see Creating a REST Data Source and Creating a SQL Data Source).
-
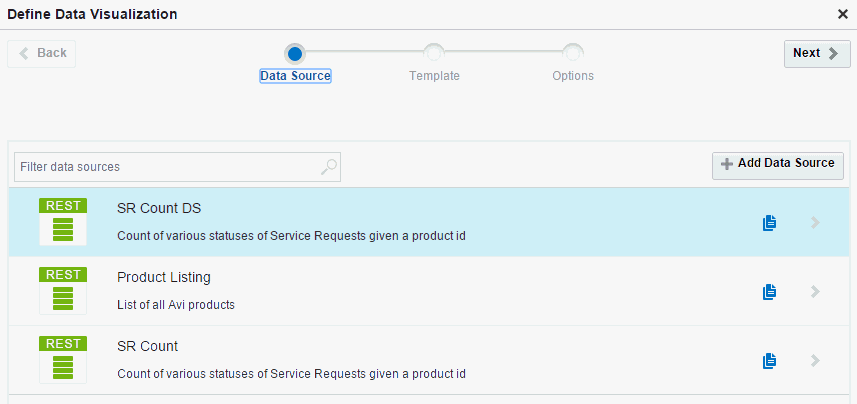
(Optional) Create business object. If you need to filter the attributes and methods retrieved from the data source, create a business object (see Creating a Business Object). If you do not create a unique business object, one is automatically created when a data source is selected in the Define Data Visualization wizard, and all the attributes and methods for the data source are added to the business object. Manually-created business objects are listed on the portal Assets page and in the Define Data Visualization wizard, but automatically-created business objects are internal and not exposed anywhere.
-
Determine visualization template. Decide if you can use one of the built-in visualization templates (see About the Built-In Visualization Templates), or if you need to work with a developer to create a custom visualization template. When a custom visualization template is uploaded to a portal, it is shown on the Assets page for the portal; it can also be made available as a shared asset, available to all portals.
-
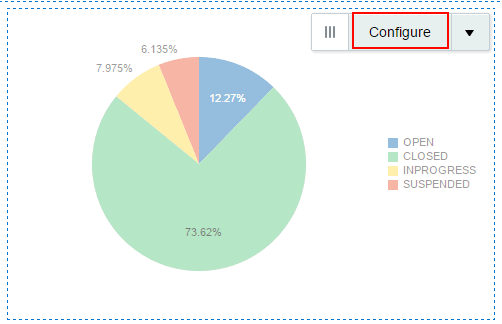
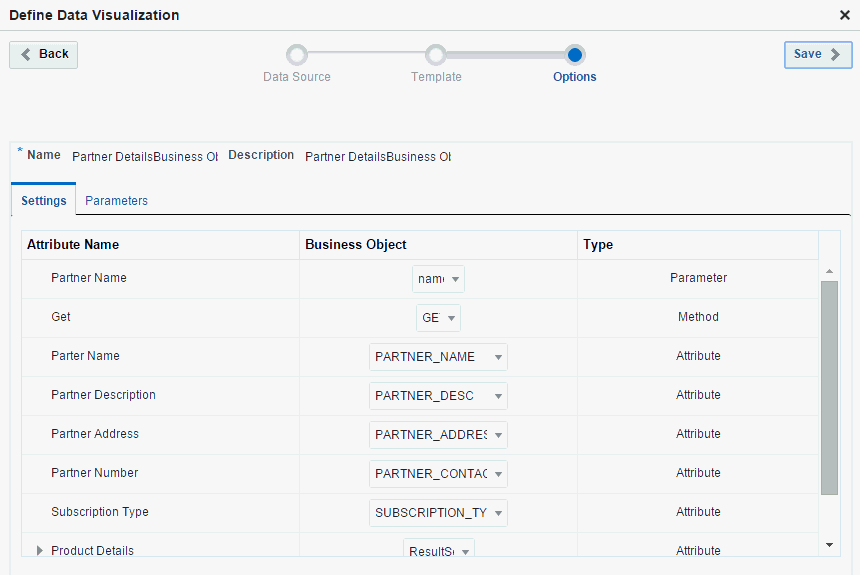
Configure data visualization. Add a data visualization component (Data Presenter Visualization) to a page, then configure the component to define the data visualization that you want to render on the page (see Configuring a Data Visualization).
Out-of-the-box, no data visualizations exist. Data visualizations can be created only at the portal level (as a portal asset), not at the application level (as a shared asset).
23.2 Adding a Data Visualization a Portal Page
To add a data visualization to page, you start by adding the default Application Integration Visualization component to the page. Then, you can configure this component to create the unique data visualization that you require. For more information, see About Data Visualizations.
To add a data visualization to a portal page:
23.3 Configuring a Data Visualization
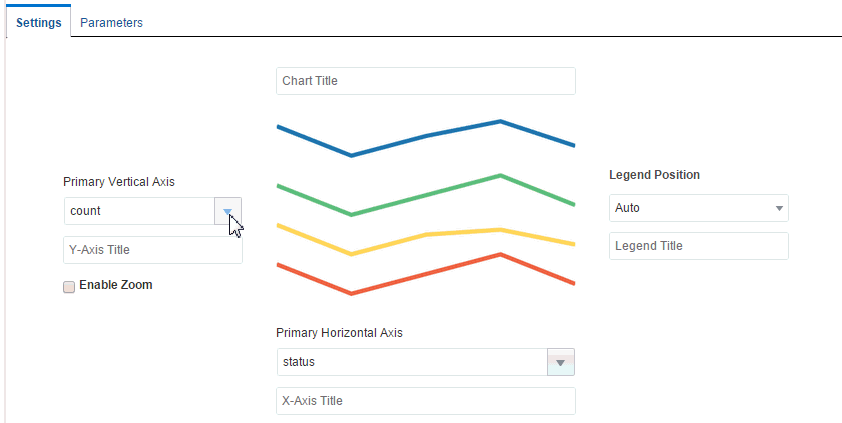
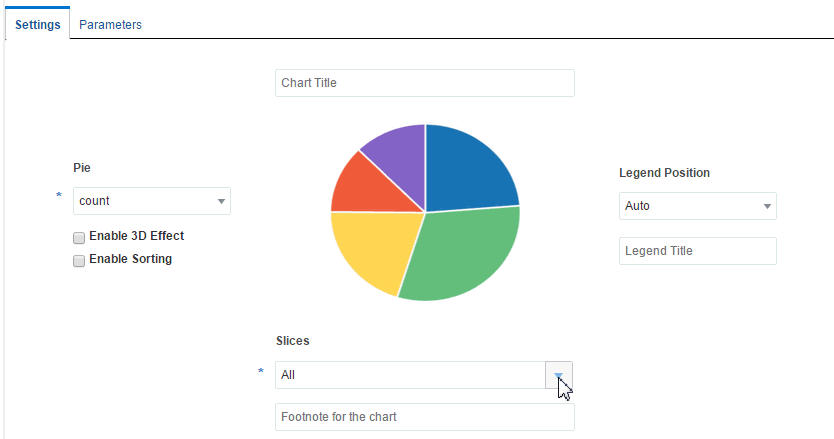
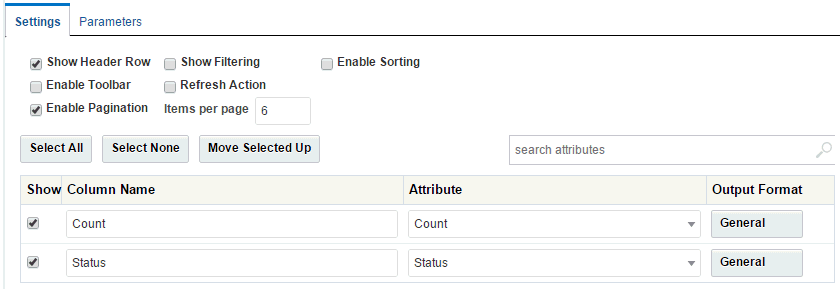
After you add a data visualization to a page, you can configure the data visualization to present the data retrieved from a data source in a visualization template.
Note:
If changes are made to a custom visualization template or the structure of data retrieved from the data source that is selected in a data visualization, you will need to configure a new data visualization to successfully generate the results of the changes on the page.To configure a new or existing data visualization:
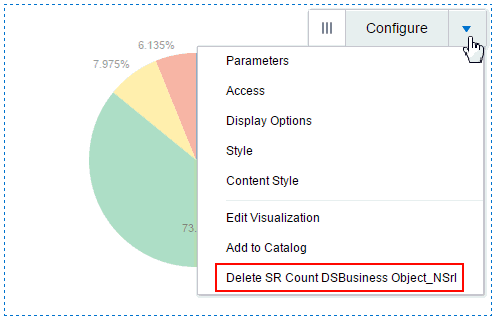
23.5 Managing Data Visualizations
See Also:
Accessing Portal AssetsThe following options are available on the Assets page to enable you to manage Data Presenter Visualization:
-
Upload—You can upload an archive file that contains a data visualization.
For more information, see Uploading an Asset.
-
Download—You can download a data visualization into an archive file.
For more information, see Downloading an Asset.
-
Actions
-
Edit Source—You can directly edit the source code of a data visualization on the Taskflow Definition, Fragment, and Page Definition tabs. Editing the source code is not recommended unless you are making a minor edit.
-
Show Properties—Each data visualization has an associated Show Properties dialog that summarizes useful information about it.
For more information, see Viewing Information About an Asset.
-
Edit Properties—Each data visualization has certain properties associated with it that control how it is displayed in the portal. You can edit these properties through the Edit Properties dialog.
For more information, see Setting Properties on an Asset.
-
-
Available—You can control whether or not a data visualization is available for use in a portal by selecting or deselecting this check box.
For more information, see Showing and Hiding Assets.
23.6 Troubleshooting a Data Visualization
While working with data visualizations, you might need to troubleshoot various issues if the data is not rendered as required.
Text Not Aligned in the List View Template
If you use a SQL data source that selects a column that has a long text value with no spaces, the output does not wrap and appears misaligned
Solution: Add spaces in the source data.
Template or Data Changes Not Shown in Data Visualization
If changes are made to a custom visualization template or the structure of data retrieved from the data source that is selected in a data visualization, the data visualization does not automatically update with the changes.
Solution: Configure a new data visualization, selecting the updated template or data source.
REST Data Source Changes Not Shown in Data Visualization
If the underlying data selected by a REST data source changes, the changes are not reflected in the data visualization on the page.
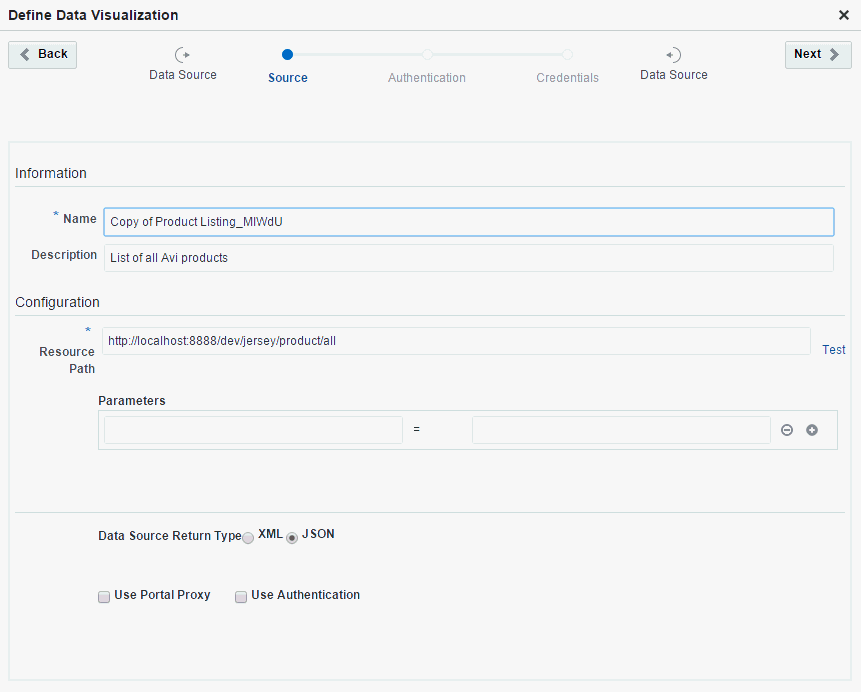
Solution: To update the data visualization with changes to the data selected by the REST data source, exist the wizard and go to the Assets page of the portal to edit the data source (see Editing a REST Data Source), where you can select Refresh Schema to refresh the data source and the associated business object with changes such as added, deleted, or renamed attributes. For more significant structural changes, you will need to re-create the data source and any data visualizations where it is used.
Parameters Lost After Modifying Resource Path URL
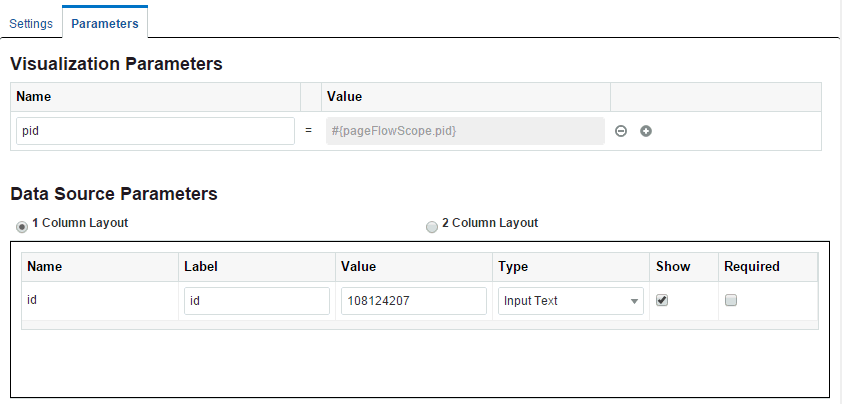
If you modify the Resource Path URL in the Define Data Visualization wizard, the list of data source parameters will be refreshed, losing any parameters you may have specified earlier.
Solution: Respecify the required data source parameters in the Define Data Visualization wizard.
Expected Visualization Templates Not Shown for Selection
The templates available for selection in the Define Data Visualization wizard do not include all expected templates, such as Table and List.
Explanation: When you provide the Resource Path URL, WebCenter Portal creates the data source based on the data returned by the URL. If the URL returns only a single record at this time (possibly due to parameter values or limited data currently available), then WebCenter Portal creates the data source with the assumption that a single record will always be returned. In this case, the wizard shows only the Form template for selection, since this template is appropriate for presenting a single data record. It does not show the Table or List templates for selection, because these templates are appropriate for repeating records of data.
Solution: If you know that the data retrieved by the data source may be repeating and you want to select the List or Table templates, then the Resource Path URL that you specify must return repeating data at the time that the data source is created. Alternatively, you can create a data source on the Assets page (see Creating a REST Data Source), and provide a Response Payload that contains repeating data. Then, if you select that data source, the wizard will present all appropriate templates for selection, including List and Table.
New visualization Template Does Not Display After Selection
If you select a custom visualization template that was just published while you are in the page editor configuring the data visualization, you may encounter an error.
Solution: Do not enter the page editor until after the custom visualization template is published.
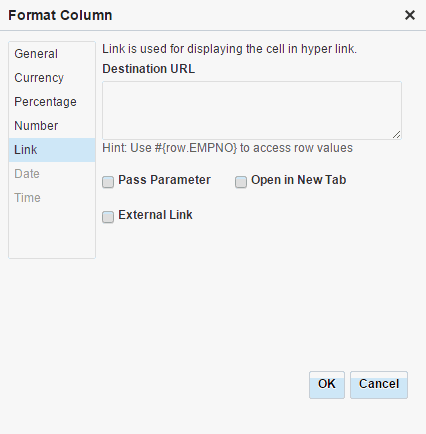
Link URL Does Not Link to Target
When you define an Output Format of Link for retrieved data, the link does not display its target when clicked in the data visualization.
Solution: Specify a full URL (beginning with http://) or a URL relative to the portal’s web address.


