Tasks Priority Report
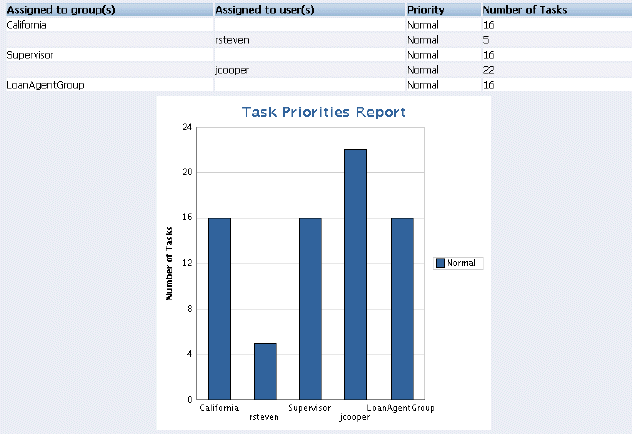
Figure 32-62 shows an example of a Tasks Priority report.
The report shows that the California group, the Supervisor group, and the LoanAgentGroup each have 16 tasks of normal priority. The users rsteven and jcooper have 5 and 22 tasks, respectively, all normal priority. Priorities (highest, high, normal, low, lowest) are distinguished by different colors in the bar chart.
