What Happens When You Create Reports
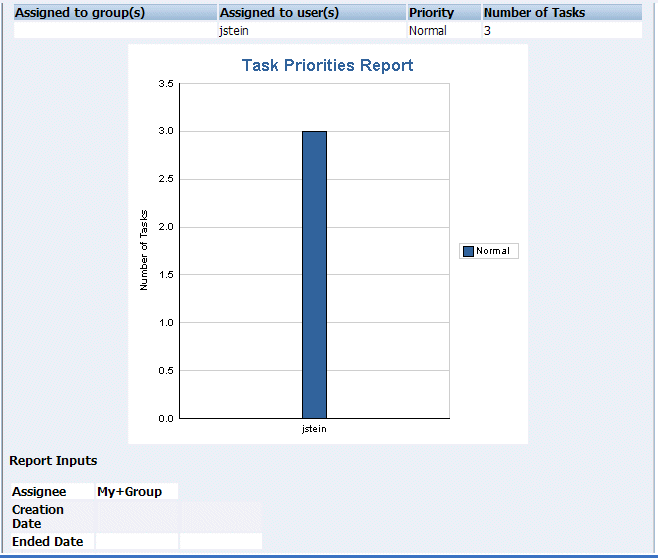
As shown in Figure 32-60, report results (for all report types) are displayed in both a table format and a bar chart format. The input parameters used to run the report are displayed under Report Inputs, in the lower-left corner (may require scrolling to view).
Figure 32-60 Report Display—Table Format, Bar Chart Format, and Report Inputs

Description of "Figure 32-60 Report Display—Table Format, Bar Chart Format, and Report Inputs"