Running the Debugger on the XSLT Map
Initiating a Debugging Session
After setting the breakpoints for your XSLT map, follow these instructions to start the SOA debugger:
Debugging a SOA Composite Application
Note:
For the debugger to step into the XSLT map, the map must be invoked by a mediator or BPEL process in your SOA composite.Working with the Debugger in the XSLT Map Editor
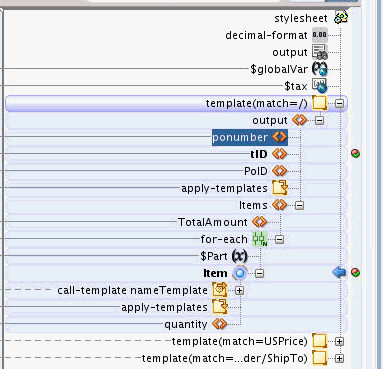
After you run the debugger, and when the debugger comes across a breakpoint in the XSLT map, the debugger stops execution at the breakpoint. A blue arrow to the left of the breakpoint bar indicates the current position of the debugger. Also, a flashing blue icon appears against the corresponding XSLT element or node.
When the debugger is stepping through the XSLT map, all valid breakpoints in the XSLT editor change to red and green dots. Breakpoints that remain a solid red are currently invalid and are ignored by the debugger.
Note:
Some processes that invoke the XSLT map have time-out limits. If the debugger ends unexpectedly after exiting an XSLT map, the invoking process may have a time-out value defined. This time-out value may need to be redefined to support debugging the full process. Check server log files for information in the event of the debugger unexpectedly aborting.The following example image shows breakpoints, as they appear during runtime. The breakpoints appear against the tID and Item elements. The debugger is currently at the Item node, as indicated by the blue arrow and flashing icon.

You can use the Step Over button in the main JDeveloper toolbar to step through the execution. The Step In button can be used to step into loops, call-template, apply-template, and apply-imports.The Step Out button can be used to step out of call-template, apply-template and apply-imports to the next XSLT statement.

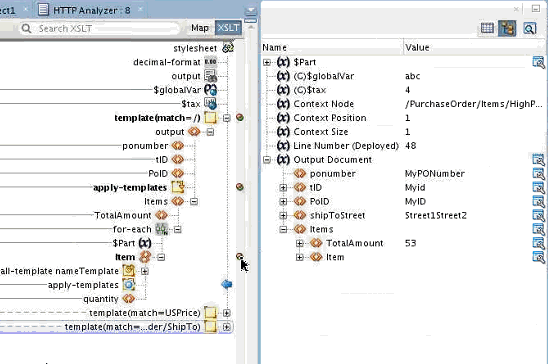
At any point during the execution, you can look at the current values of parameters and variables in the Debugger Data window. The Data window also shows you the Context Node, Context Position, Context Size, and the Output Document being built by the XSLT processing. You can also choose to add any item visible in the Debugger Data window to the Watches window.
The following image shows sample debugger data, as it appears in the Data window on the right.

You can choose to edit the XSLT when debugging. You would need to redeploy the project before you can debug again.