How to Step Through a Debugging Session
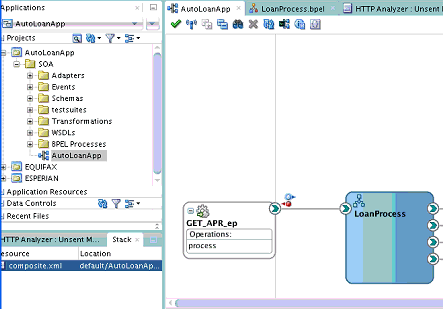
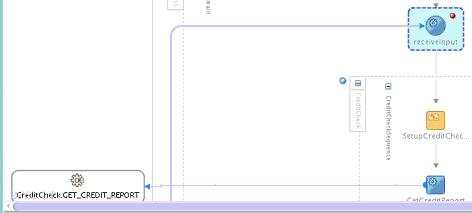
When you create a breakpoint, a corresponding frame is created in the Structure window, as shown in Figure 50-12. This frame was created for the request-reply entry point on the service binding component.
A frame is a location. A stack of frames is a bread crumb trail of the locations that lead you to your current location. This is equivalent to a stack trace. It shows you where you are and how you got there. Frames are created independent of breakpoints. When you stop at a breakpoint, all frames that have been created in the Structure window are displayed. A stack frame also contains the data that existed at that point of time. Clicking a different stack frame in the Structure pane also updates the Data tab.
For example, if you have a web service connected to a BPEL process connected to a reference, if you set a breakpoint on the reference, you see a stack that generally looks as follows:
-
Reference
-
BPEL invoke
-
BPEL scope
-
Web service
If you click the web service frame, the SOAP payload in the Data tab is displayed. If you then click the BPEL invoke frame, the various BPEL variables and other details are displayed in the Data tab.
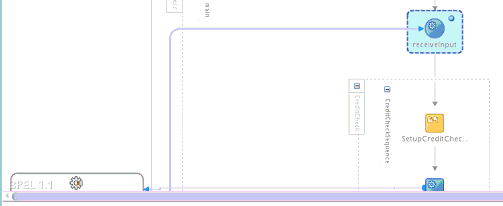
You can step over the frame and begin debugging at a different location, such as a different breakpoint (for this example, the LoanProcess BPEL process). As you proceed with debugging, the following frames are created. Frames are where variables are located.
-
Scope frame: Contains scope variables.
-
Process frame: Contains global variables.
Variables are visible to a process from the top frame through the bottom frame. Frames are displayed in the Structure window.
To step through a debugging session:


