8 Working with Dashboards
This chapter describes Oracle SOA Suite for healthcare integration dashboards, which display endpoint-level status and volume metrics on instance data. This includes endpoint status, message counts, sequencing information, and error messages.
This chapter includes the following topics:
8.1 Introduction to Dashboards
Oracle SOA Suite for healthcare integration dashboards display information about the current health of the endpoints in a healthcare integration application. You can create and configure multiple dashboards as required to monitor the status and volume metrics for the endpoints you have defined.
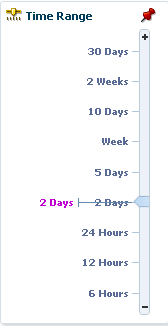
The Dashboards tab reflects changes that occur in the runtime repository, such as purging runtime instance data, new messages processed, and new error messages. You can display data for various time periods, and you can manually refresh the data in real time or set the dashboard to automatically refresh at set intervals. The available time periods are configurable in the UI settings on the Administration tab.
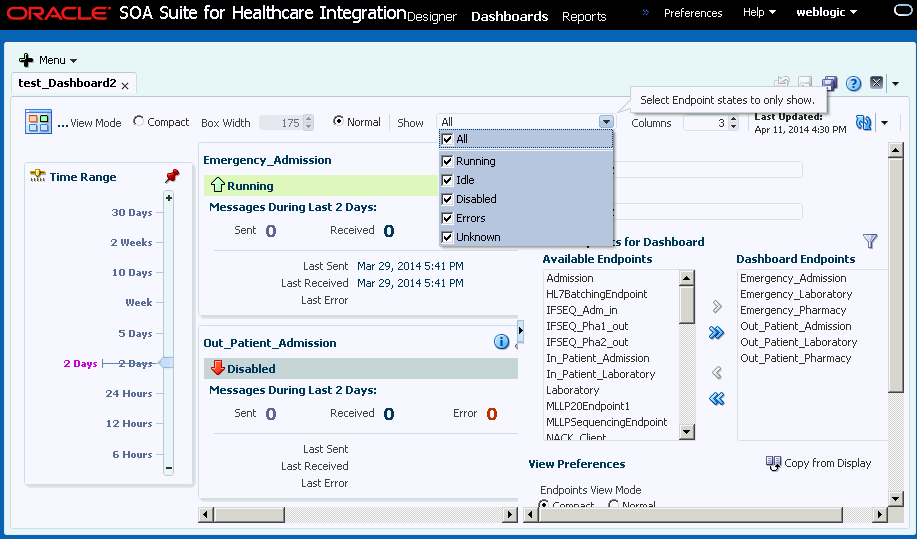
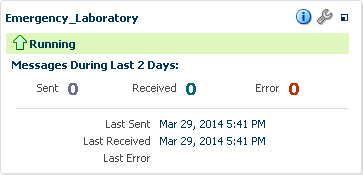
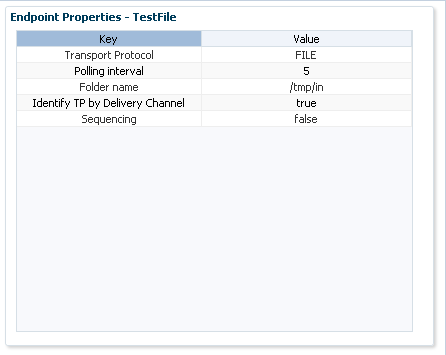
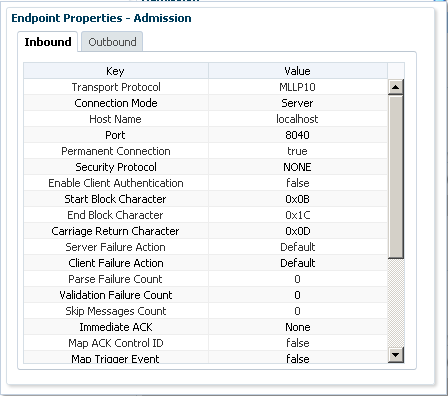
When you first open a dashboard, based on the View Mode options, Compact and Normal, a summary of all the endpoints included in the dashboard appears. For each endpoint, you can view more detailed information about not only the status and message volume but also about the endpoint's configuration. Figure 8-1 shows endpoint summaries in the Normal mode on the Dashboard page.
Figure 8-1 Endpoint Summaries on the Dashboard
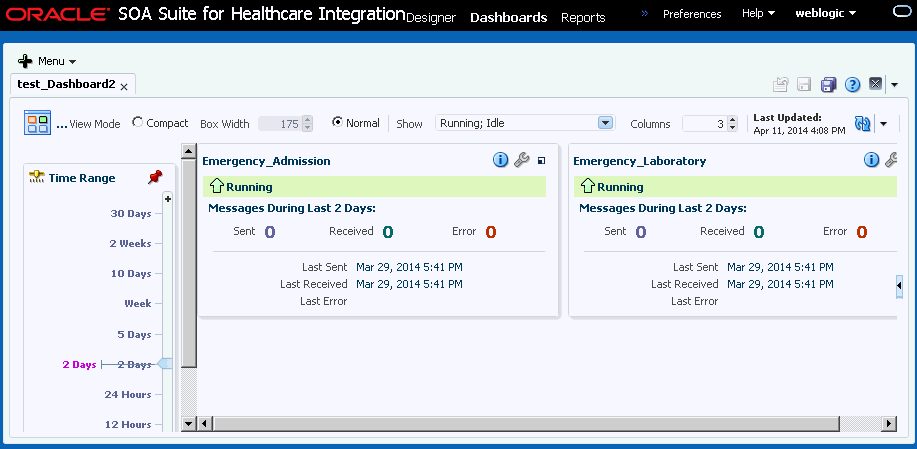
Description of "Figure 8-1 Endpoint Summaries on the Dashboard"
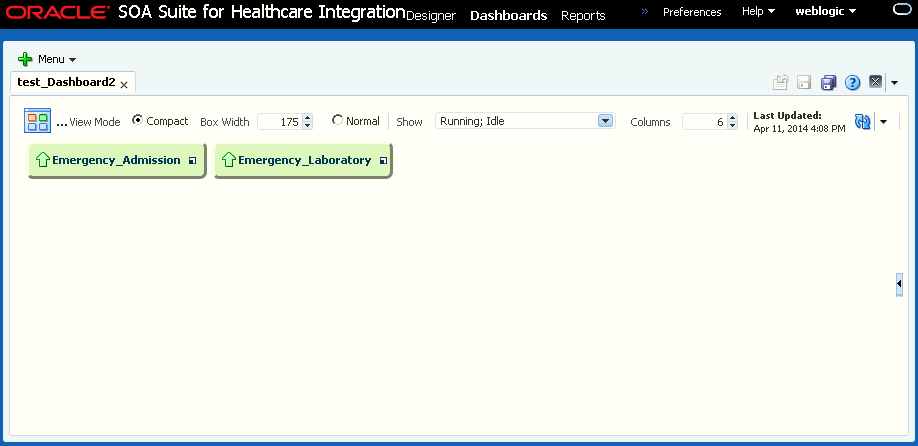
You can click the Compact option to view the Dashboard in the compact mode where only a small box filled with a color corresponding to the status and name of each endpoint. You can also adjust the width of the compact boxes to fit as many as you can. The Time Range can also be iconified to save space and it automatically reappears when you mouse over the Time Range slider icon. The Show Customizer toggle button always appears on the dashboard regardless of whether the Customizer is open or not.
Figure 8-2 shows the Dashboard page in the compact mode.
8.2 Working with System Dashboard
Using the System Dashboard, you can view the deployed healthcare composites, which is important because internal delivery channels and composites represent the internal side of the system overview. You can also enable or disable endpoints and channels by using the System dashboard. Sections on message statistics and overall recent error list completes the System Dashboard.
You can view the System Dashboard by first clicking the plus button in the upper right corner of the Dashboard tab, and then clicking System Dashboard.
8.2.1 Viewing System Data by Using Different Sections of the System Dashboard
Using the sections of the System Dashboard, you can view different types of system data pertaining to the a Oracle Healthcare instance.
Table 8-1 lists the different sections of the System Dashboard.
Table 8-1 Sections of the System Dashboard
| Section Name | Description |
|---|---|
|
Time Range slider |
The Time Range slider at top of the System Dashboard page allows you to select time intervals for which data is collected for the graphs and tables of the dashboard. Slide the pointer to select the required time interval. |
|
Refresh |
The Refresh component at the top right corner of the dashboard allows you to either manually refresh the page or set the interval for auto-refresh. To enable auto-refresh, click the down arrow adjacent to the Refresh button, select the Auto-Refresh check box, and specify the interval for auto-refresh (in seconds.) |
|
Most Active Documents |
This graph displays the most active document definitions (maximum of three document definitions at a time) and how many messages are associated with each document definition. |
|
Most Active Endpoints |
This graph displays the most active endpoints (maximum of three endpoints at a time) and how many messages are associated with each endpoint. |
|
Recent Error Trend |
This graph displays the number of errors in the specific Oracle Healthcare setup mapped against the time at which the errors occurred. |
|
Endpoints |
The Endpoints table displays a list of all endpoints in the Oracle Healthcare system along with the status, transport protocols, message counts, and queue counts associated with each of the endpoints. You can perform the following actions in this table:
|
|
Internal Delivery Channels Table |
The Internal Delivery Channels table displays a list of all the internal delivery channels in the Oracle Healthcare system along with the status, transport protocols, and delivery associated with each of the channels. Here, the channels are listed with values In this table, you can perform actions similar to the ones that you can perform in the Endpoints table. |
|
Composites Table |
The Composites table displays a list of Oracle Healthcare related composites that have been deployed in the Oracle Weblogic Server along with the status of the composites Click the View button to configure the number of columns to be displayed in the table or to detach the Composites window . |
8.3 Creating and Configuring Dashboards
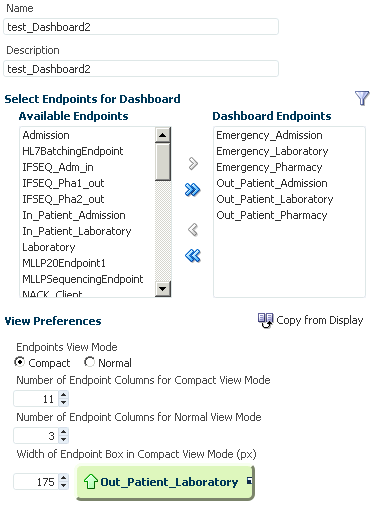
Using the Dashboards tools, you can create dashboards for any combination of endpoints you have defined.
You can configure the layout of the Dashboard page, specify a refresh rate, and change the endpoints for an existing dashboard.
8.3.1 Creating a Dashboard
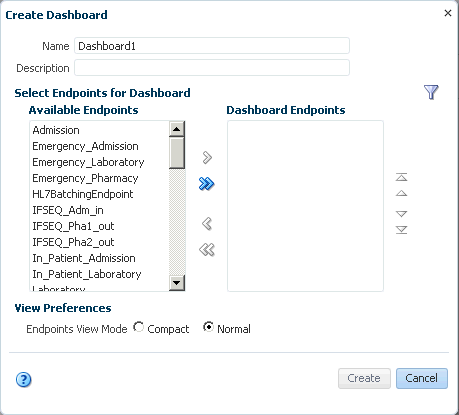
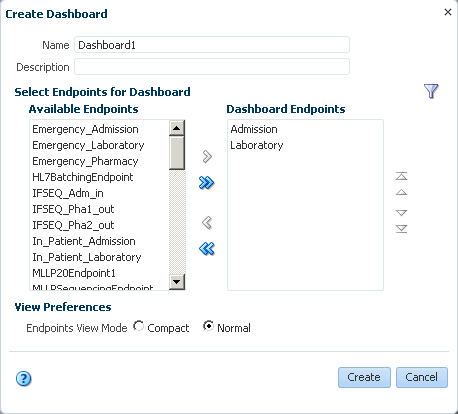
You can create multiple dashboards in Oracle SOA Suite for healthcare integration for a single endpoint or combinations of multiple endpoints.
Note:
Whenever there are any Endpoints defined, a standard dashboard called All Endpoints is available that includes all the defined endpoints. You cannot modify and save changes to this standard dashboard.
To create a dashboard
8.3.2 Selecting a Default Dashboard
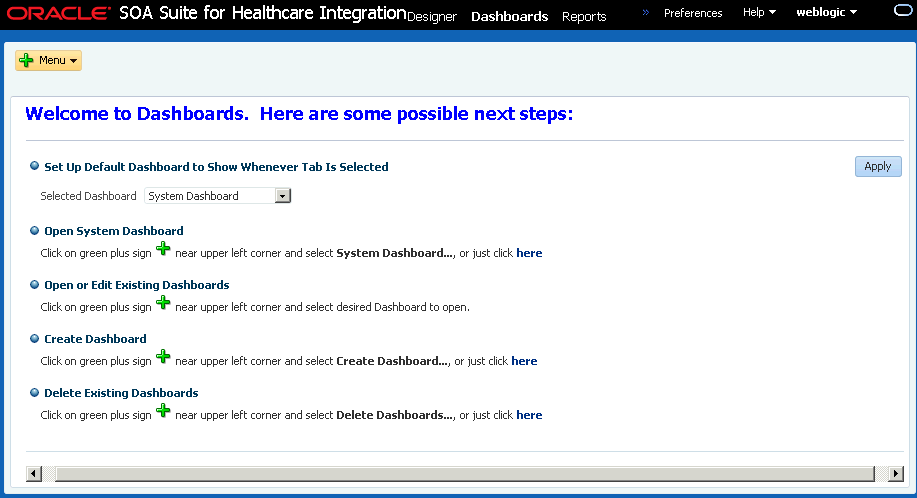
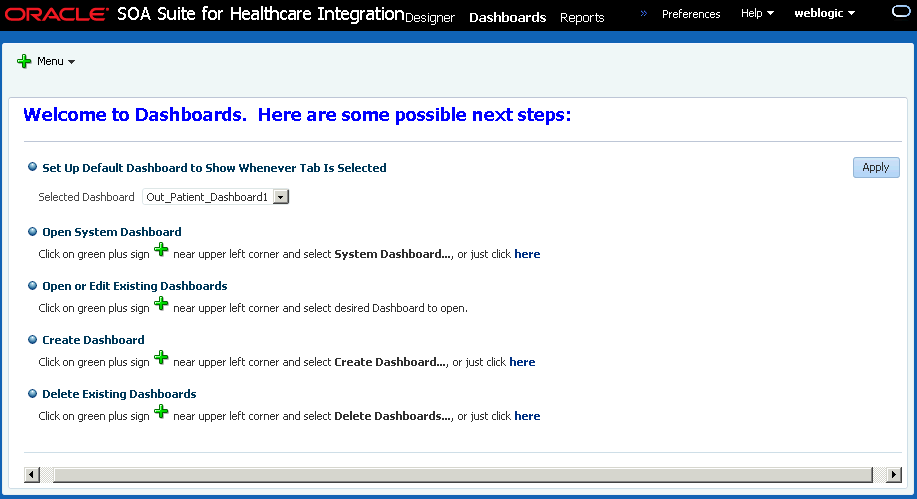
After you create dashboards you can select one that automatically appears when you click the Dashboards tab. This is the default dashboard. If you do not specify a default dashboard, you can select from the list of existing dashboards when you open the Dashboards page. If you do select a default dashboard, this dashboard appears every time you open the Dashboards page.
To select a default dashboard
8.3.3 Configuring an Existing Dashboard
After you create a dashboard, you can change the endpoints for which information is displayed, how the information appears on the dashboard, and the type of information that appears.
To configure an existing dashboard
8.3.4 Refreshing a Dashboard and Setting the Auto-Refresh Rate
You can manually refresh the dashboard at any time, but you can also specify that the dashboard be automatically updated at set intervals.
To refresh a dashboard and set the auto-refresh rate
-
If the dashboard you want to modify is not already displayed, click the plus button in the upper right of the main Dashboards page and select the dashboard to configure.
-
To refresh the dashboard, click the Refresh button in the upper right.
-
To enable the auto-refresh option, do the following:
-
Click the down arrow to the right of the Refresh button.
-
Specify the time interval in seconds to wait between automatically refreshing the dashboard, and then select Auto-Refresh.
-
To disable automatic refreshing, clear the Auto-Refresh check box.
-
8.4 Viewing Information in Dashboards
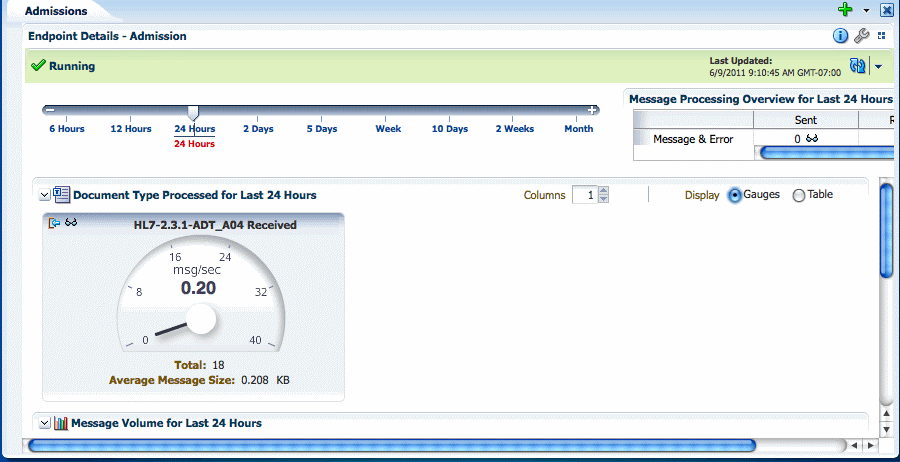
You can also view more detailed information for each endpoint, including the rate at which messages are being processed, the average message size, the number of messages sent or received, the number of errors, and any error messages. You can also access the Endpoints page directly from the dashboard so you can modify the configuration of an endpoint if required.
8.4.1 Viewing Endpoint Summary Information in a Dashboard
A dashboard has multiple views and you can navigate from each view to get a higher level of detail about a specific endpoint, error, or message.
To view endpoint summary information
8.4.2 Viewing Detailed Endpoint Information in a Dashboard
From any endpoint summary view, you can navigate into more information for a specific endpoint, such as the message processing rate, the message volume broken down by message type (sent, received, or error), and the average message size. Additional information is available for errors.
To view detailed endpoint information
8.5 Working with Sequenced Messages
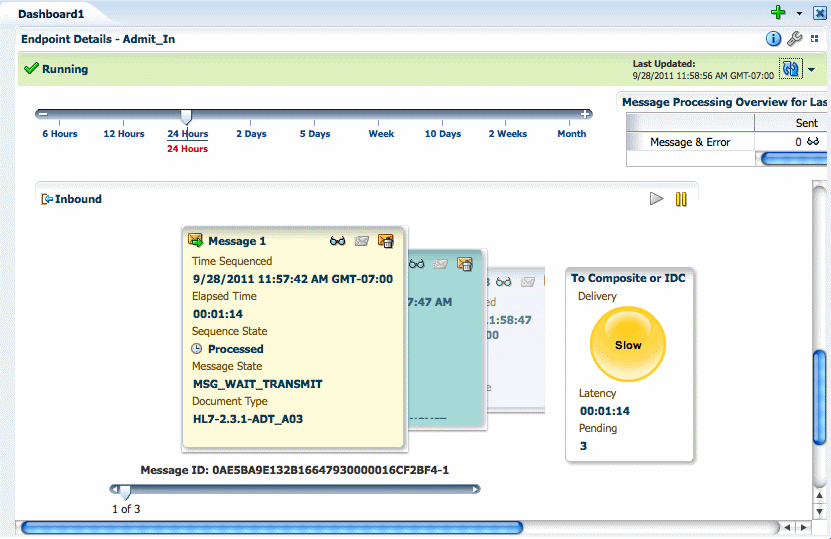
The information you can view for the queue includes the number of messages in the queue, the time a message was sequenced, the time elapsed since sequencing was initiated for the message, the sequence state, the message processing state, and the document type. There is also an indicator of the overall delivery status for the queue. Possible statuses are:
-
Paused: Indicated by a red traffic light, this means that sequencing has been manually paused or blocked when the message at the front of the queue has encountered a transport error.
-
Slow: Indicated by a yellow traffic light, this means that the elapsed time for the message at the front of the queue has exceeded the
Slow Threshold for Sequencingproperty in the UI Settings. -
Running: Indicated by a green traffic light, this indicates that sequenced messages are being processed normally.
Messages can get backed up in the queue due to sequencing errors, message errors, or message processing delays. The Sequenced Messages section gives you the information you must correct these problems. You can view information about messages in the queue to determine the cause of the stoppage. After you find the source, you can reprocess errored messages or discard messages from the queue.
To work with sequenced messages
8.6 Viewing Endpoint Error Messages
When a message for a specific endpoint generates an error, you can access information about the error from the Dashboards page.
Note:
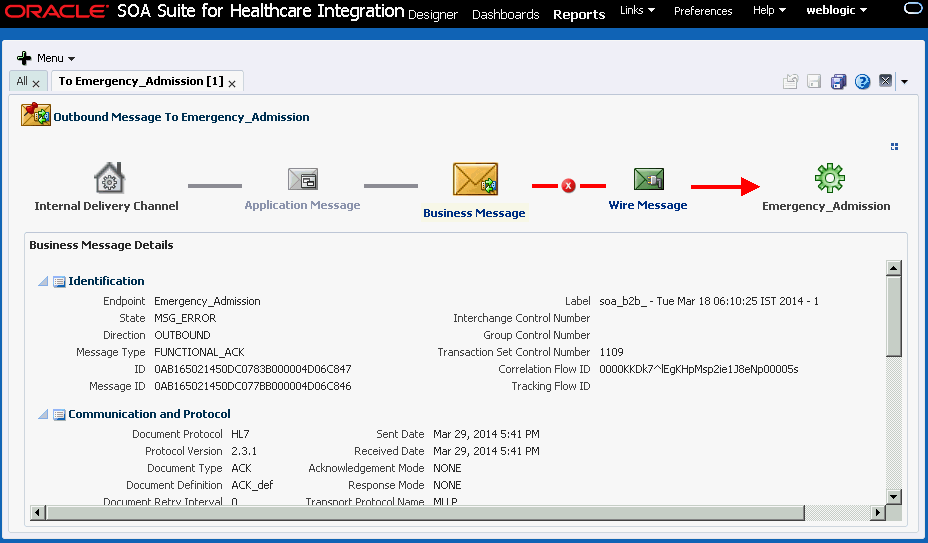
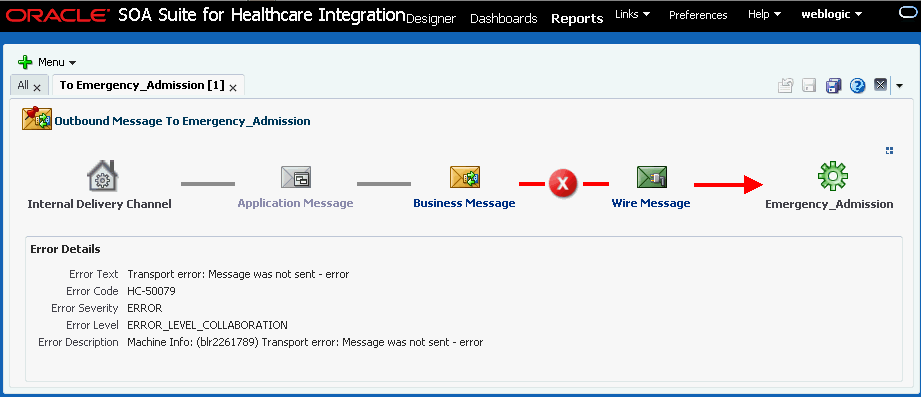
When a transport error occurs in an endpoint, the status bar for the endpoint changes to red and the status changes to Errors. This does not indicate an error in the business message processing, which is described in the following procedure, though message processing errors can include transport errors as well. Message processing errors are indicated by the number in the Error field of the endpoint summary.
To view endpoint error messages
