Use the Workbook Filter Bar
You can use the workbook filter bar to broadly limit the data on a specific canvas or all canvases in a workbook. For example, limit the data to the year 2024.
About the Workbook Filter Bar
You can add workbook filters, canvas filters, selection steps and parameters to the workbook filter bar.
These items in the filter bar are generally the first level of filtering that you add to a workbook. You can then add other levels to fine tune the data, for example, add dashboard filters that allow end users to select their own filter values, or add visualization filters that cascade selected values from one visualization to another.
Filters in the filter bar can be pinned (called workbook filters) to limit the data on all canvases in the workbook, or unpinned (called canvas filters) to limit the data on a single canvas. See Add Workbook and Canvas Filters.
Selection steps work slightly differently than filters in the filter bar, but they can also be pinned or unpinned. For more information, see About Selection Steps.
For information about using parameters in the filter bar, see Use a Parameter in the Filter Bar.
You can hide the items in the filter bar from end users for a cleaner dashboard experience (see Show or Hide the Workbook Filter Bar in Present) or you can customize the level of interactivity you want your users to have with the filter bar (see Specify Workbook Filter Options in Present and Specify Canvas Filter Actions in Present).
Filter Bar Properties
You can modify these properties found in the Filter Bar Menu for items in the filter bar, depending on whether they're workbook and canvas filters, selection steps or parameters.
| Property | Description |
|---|---|
| Limit Values By |
Specifies how the filters and selection steps in the filter bar get their selection values. See Specify Limit Values By for the Workbook Filter Bar. You can't configure this property for parameters used in the filter bar. |
| Filter Values |
Specifies whether the selected values for the filters, selection steps, and parameters in the filter bar are displayed. Options
See Display or Hide Selected Values in the Workbook Filter Bar. |
| Auto-Apply Filters |
Specifies whether the filter, selection step, and parameter value selections in the filter bar are automatically applied. Options
|
| Move to Dashboard Filter |
Converts all canvas filters in the workbook to dashboard filters. Adds a dashboard filter visualization to each canvas and moves the canvas filters for that canvas from the filter bar into the visualization. Options
See Convert Canvas Filters to Dashboard Filters. You can't convert workbook filters, selection steps, or parameters used in the filter bar to dashboard filters using this option. |
Add Workbook and Canvas Filters
When you add a filter to the filter bar, the filter applies to only the current canvas and is called a canvas filter. You can pin that filter to apply it to every canvas in the workbook and turn it into a workbook filter.
- On the Home page, hover over a workbook, click Actions, then select Open.
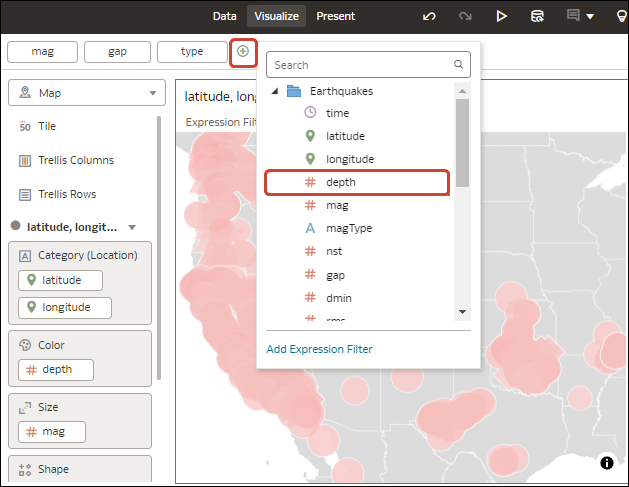
- On the Filter Bar, click Add Filter (+) and select the column you want to filter on.
- In the Filter dialog, select the data values to filter on.
- Optional: To make the filter a workbook filter that applies to all canvases, hover over the filter and click Pin to All Canvases.
- Click Save.
Add Selection Steps in the Filter Bar
Use selection steps in the workbook filter bar to select the levels or members you want to display in a table or pivot table visualization that uses a level or parent-child hierarchy.
You can create selection steps only for hierarchical data elements. A selection step affects only visualizations that use the same hierarchy as the selection step.
For more information about selection steps, including how to use the different actions and operators, see About Selection Steps.
For information about which filter bar properties apply to selection steps, see Filter Bar Properties.
For information about the Limit Values setting for selection steps, see How Filters Limit Each Other.
For information about disabling a selection step, see Disable a Filter or Selection Step.
- On the Home page, hover over a workbook, click Actions, then select Open.
- In the Data panel, drag and drop a hierarchical data element to the filter bar.
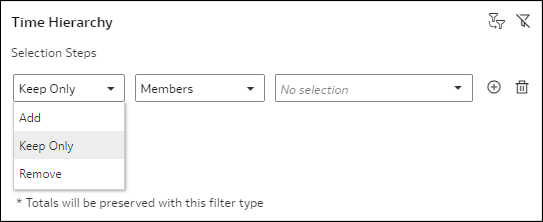
- In the Selection Steps dialog:
- Select an action from the Actions drop-down list.
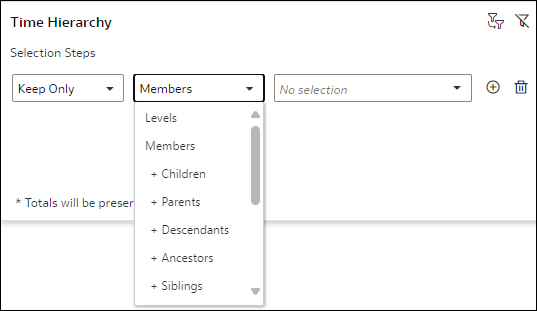
- Select an operation from the Operators drop-down list.
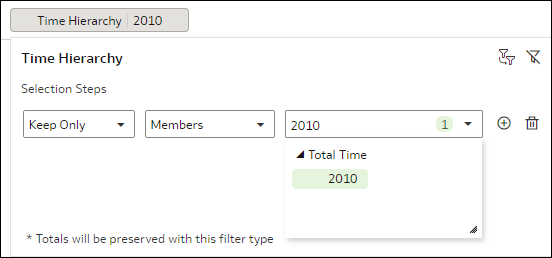
- Use Ctrl-click to select the levels or members from the Values drop-down list.
- Select an action from the Actions drop-down list.
- Optional: To quickly see the exact members selected, click the green highlighted number in the member selection drop-down list.
- Click Save.
Specify Limit Values By for the Workbook Filter Bar
Configure the Limit Values By setting for the workbook filter bar to apply to each filter and selection step that you add to it.
- On the Home page, hover over a workbook, click Actions, then select Open.
- Click Filter Bar Menu, then hover over Limit Values By
 .
. - Click an option to select it.
- Click Save.
Specify Limit Values for Workbook and Canvas Filters and Selection Steps
Configure the Limit Values setting for individual filters and selection steps in the filter bar to specify if the selections from one item determine the available selections for others.
- On the Home page, hover over a workbook, click Actions, then select Open.
- Click the filter or selection step to open the Filter or Selection Steps dialog.
- Click Limit Values and click an option to select it.
- Click Save.
Display or Hide Selected Values in the Workbook Filter Bar
You can display the selected filter, selection step or parameter values in the labels in the filter bar so that you don't have to open a dialog to check the selected values. Or you can hide the selected values to reduce clutter on the filter bar.
Use the Filter Values property to show or hide the selected values in the filter bar. For more information about this property, see Filter Bar Properties.
For a pinned workbook filter or selection step, you can change the value display settings from any canvas.
- On the Home page, hover over a workbook, click Actions, then select Open.
- On the filter bar, click Filter Bar Menu
 .
. - Hover over Filter Values and click an option to select it.
- Show All
- Hide All
- Show by Default
- Click Save.
Manually Apply Selections in the Workbook Filter Bar
As you select filter, selection step or parameter values in the filter bar, Oracle Analytics automatically applies them. You can change this behavior when you want to manually apply the selections instead.
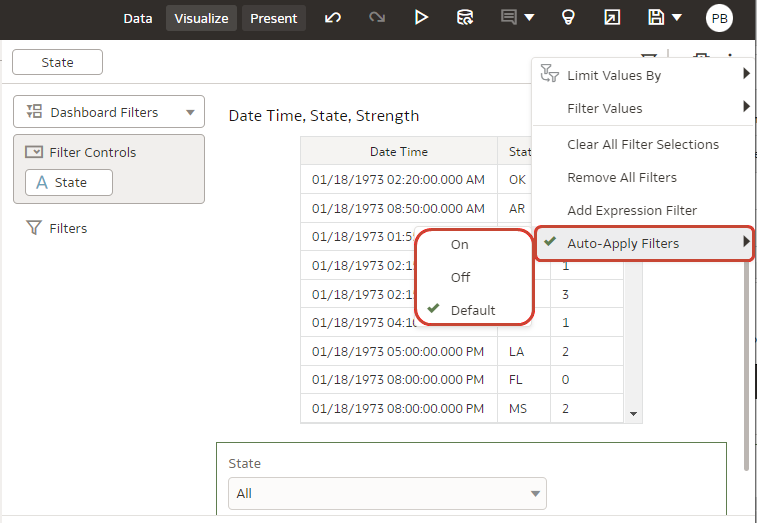
Use the Auto-Apply Filters property in the Filter Bar Menu to specify if you want to manually apply all selections. When you set this property, it applies to all items in the filter bar across all canvases.
When set to Off, you can select values and then click the Apply button when you want to apply the selections.
For more information about this property, see Filter Bar Properties.
- On the Home page, hover over a workbook, click Actions, then select Open.
- On the filter bar, click Filter Bar Menu, hover over Auto-Apply Filters, and then click an option to select it.
- Click Save.
Convert Canvas Filters to Dashboard Filters
Convert canvas (unpinned) filters in the filter bar to dashboard filters when you want to use the functionality, style, layout, and personalization options that dashboard filters provide. Convert filters to avoid manually adding dashboard filters and deleting existing canvas filters.
For more information about this property, see Filter Bar Properties.
- On the Home page, hover over a workbook, click Actions, then select Open.
- On the filter bar, click Filter Bar Menu
 .
. - Hover over Move to Dashboard Filter and click a layout option to select it.
- Click Save.
Use a Parameter in the Filter Bar
Adding a parameter to the filter bar allows you to set the parameter value for the whole workbook or an individual canvas.
Note:
Adding a parameter as a workbook (pinned) or canvas (unpinned) filter in the filter bar functions as a column selector, it doesn't filter the data.- On the Home page, hover over a workbook, click Actions, then select Open.
- In the Data panel, click Parameters.
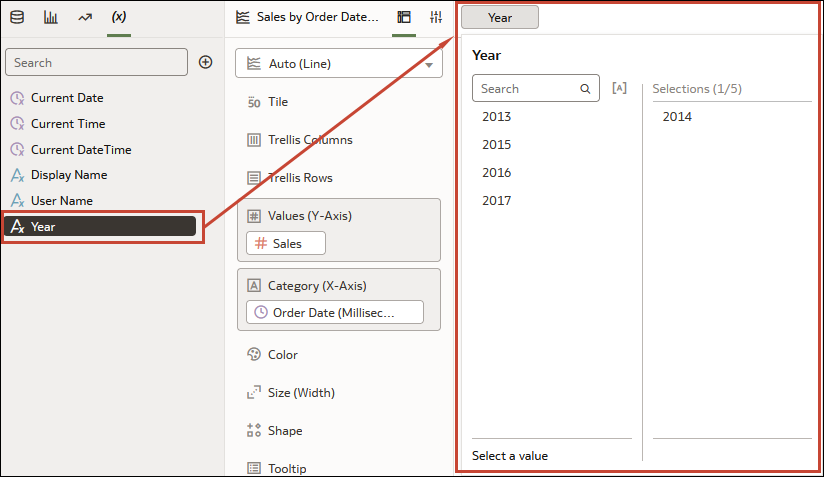
- Drag and drop a parameter to the filter bar.
- Click Save.
