Use Visualization Filters
You can add visualization filters to individual visualizations to filter them without affecting the rest of the workbook.
About Visualization Filters
Visualization filters filter the data for only one visualization.
As an author, you usually add and set workbook and canvas filters in the filter bar to broadly limit the data in your workbook, see Use the Workbook Filter Bar. You can then add and configure dashboard filters on each canvas to allow consumers to select their own filter values to view the data in the visualizations on that canvas, see Use Dashboard Filters.
Oracle Analytics offers another, narrower filter scope in the form of visualization filters which you can add so that a user can select the values they want to see in that particular visualization without affecting the rest of the workbook. You can also set visualization filters yourself and then hide them from the consumer, see Show or Hide a Visualization Filter in Present.
Add Visualization Filters
Add visualization filters to a visualization to filter the data in that visualization only, without affecting anything else in the workbook.
- On the Home page, hover over a workbook, click Actions, then select Open.
- Click a visualization to select it.
- Click Grammar to open the Grammar pane.
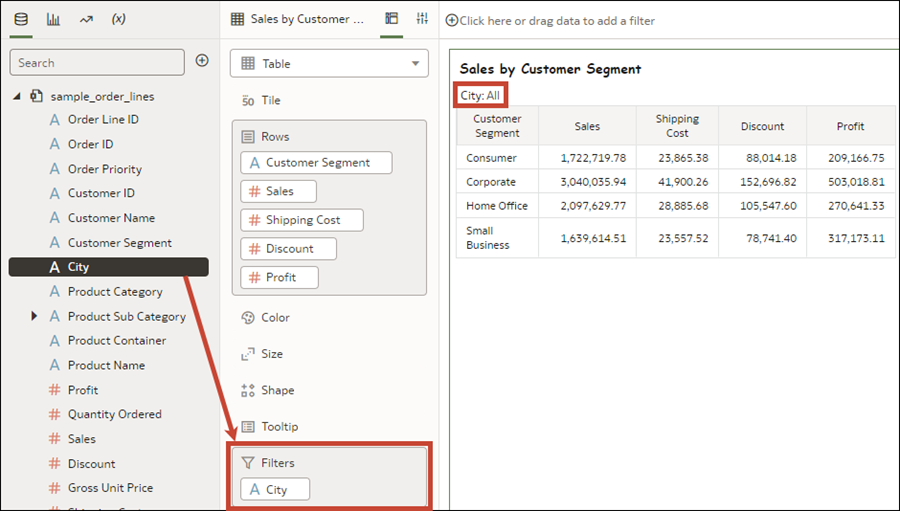
- In the Data Panel, click Data, and drag and drop one or more columns to Filters in the Grammar panel to create the visualization filters.
- Click Save.
Use a Visualization as a Filter
You can use the data selections from one visualization to filter all other visualizations on the canvas, depending on the visualization type.
- On the Home page, hover over a workbook, click Actions, then select Open.
- Hover over the visualization that you want to use as a filter.
- Click the Use as Filter icon
 to activate.
 - Click Save.
