Understanding Flow Analytics
Learn about Oracle Communications Unified Assurance Flow Analytics. This section is intended for trained Unified Assurance administrators and consultants to plan, run, and support a Flow Analytics deployment.
About Flow Analytics
Unified Assurance Flow Analytics is a complete solution to collect and analyze network data, and provide real-time visibility into what is consuming network bandwidth.
Flow Analytics lets you:
-
See which users, devices, and applications are using the most bandwidth.
-
Discover traffic patterns and device performance.
-
Prioritize business-critical applications.
-
Validate the effectiveness of class-based quality service (CBQoS) policies.
Flow Analytics Architecture
Flow Analytics, like all Unified Assurance solutions, includes components in three architectural layers: collection, database, and presentation. The majority of Flow Analytics resides in the collection layer on a dedicated server. If your environment includes multiple data centers or multiple managed customers exporting flows, Oracle recommends installing separate collection servers in each data center to get as close to the exporting devices as possible and prevent raw flow data from consuming bandwidth traversing WAN links.
The architectural layers provide the Flow Analytics end-to-end functionality as follows:
-
Collection layer: Devices send flow data to the collection servers for processing. See Flow Collector in Unified Assurance Implementation Guide for more information about the microservice that collects flow data.
-
Database layer: Flows are stored in the Historical database. For information about scalability and redundancy, as well as an architecture diagram that includes all Analytics components, see Historical Database Scalability and Redundancy
-
Presentation layer: Users interact with flow diagrams in OpenSearch Dashboards inside the Unified Assurance UI. You can see the default dashboards from the navigation menu by selecting Analytics, then Flow, and then Dashboard. The overview dashboard has several tabs allowing you to drill into different visualizations of flow data.
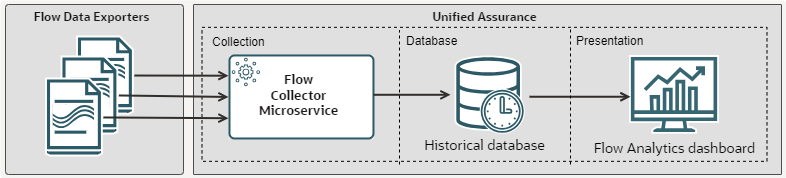
Description of illustration flow-analytics-architecture-diagram.png
Installing and Configuring Flow Analytics
Installing Flow Analytics involves the following steps:
-
As part of installing Unified Assurance, run AnalyticsWizard. See Overview in Unified Assurance Installation Guide for information about the different Unified Assurance installation configurations.
-
Set up a microservice cluster. See Microservice Cluster Setup in Unified Assurance Implementation Guide.
-
Optionally, enable flow data enrichment. See Enriching Flow Data.
-
Deploy the Flow Collector microservice. See Flow Collector in Unified Assurance Implementation Guide.
-
Set up anomaly detection. See Anomaly Detection for Flow Analytics.
Enriching Flow Data
Flow records can be enriched with additional data beyond what is sent by the devices that export flows. By default, enrichment is not enabled.
To enable enrichment, add the following files to the cluster node running the Flow Collector microservice:
-
Manual host name resolution: $A1BASEDIR/etc/flow/hostname/user_defined.yml
Example contents:
'192.0.2.1': 'host1' '192.0.2.2': 'host2' -
GeoIP autonomous systems: $A1BASEDIR/etc/flow/maxmind/GeoLite2-ASN.mmdb
-
GeoIP locations: $A1BASEDIR/etc/flow/maxmind/GeoLite2-City.mmdb
-
Devices and network interfaces: $A1BASEDIR/etc/flow/metadata/netifs.yml
Example contents:
10.0.0.1:
  1:
    ifName: lo
    ifDescr: lo
    ifAlias: lo
    ifType: 24
    ifSpeed: 10000000
    tags:
      - router_mgmt
    metadata:
      sec.zone.name: network
  3:
    internal: false
    ifName: eth0
    ifDescr: eth0
    ifAlias: internet
    ifType: 6
    ifSpeed: 1000000000
    cirIn: 200000000
    cirOut: 12000000
    tags:
      - verizon
    metadata:
      sec.zone.name: internet

10.0.0.2:
  501:
    ifName: vlan
    ifDescr: vlan
    ifSpeed: 1000000000
  502:
    ifName: ge-0/0/0
    ifDescr: ge-0/0/0
    ifSpeed: 1000000000
To enable DNS resolution, set the value of the FLOW_PROCESSOR_ENRICH_IPADDR_DNS_ENABLE configuration parameter to true in the Flow Collector microservice's helm chart. You can use either the Helmcharts microservices user interface or the a1helm install command with the --set configData flag.
See Flow Collector in Unified Assurance Implementation Guide for more information about Flow Collector configuration parameters.
Anomaly Detection for Flow Analytics
Flow Analytics anomaly detection automatically identifies a variety of performance, availability, and security conditions.
Setting Up Flow Anomaly Detection for Flow Analytics
An OpenSearch alerting monitor catches identified anomalies and sends them to the Unified Assurance WebHook Aggregator service to insert events into the Event database. Multiple anomalies are sent in batches at the same time and separated into unique events in the aggregator rules.
To set up anomaly detection for Flow Analytics:
-
Copy the latest version of the webhook's include rules for OpenSearch from the RO_LOCKED branch to your default branch. To find the rules:
-
From the Configuration menu, select Rules. See Rules for information about this UI.
-
Expand the following folders:
Core Rules (core)/Default read-only branch (RO_LOCKED)/collection/event/webhook/vendor
-
Open the opensearch.include.rules file.
-
Copy the file content.
-
Expand the same path in the default read-write branch:
Core Rules (core)/Default read-write branch (default)/collection/event/webhook/vendor
-
Open or create the opensearch.include.rules file.
-
Paste the copied content from the read-only branch.
-
Click Submit.
-
-
Start the anomaly detectors applicable to your environment and use cases. When you start anomaly detectors, they begin training the machine learning model on your indexes. You can run them on a range of historical data to train the model initially, and then set them to run continuously.
To run anomaly detectors on historical data:
-
From the main navigation menu, select Analytics, then Events, then Home.
-
From the OpenSearch menu, under OpenSearch Plugins, select Anomaly Detection.
-
From the list on the left, select Detectors.
-
Click a detector.
-
Select the Historical analysis tab.
-
Click Run historical analysis.
-
Select a time range. Oracle recommends a range of at least two months.
-
Click Run historical analysis.
After the model has trained on the historical data, you can start the detectors to run on live data by clicking Start detector on the Real-time results tab.
-
Anomaly Detectors for Flow Analytics
Flow Analytics includes anomaly detectors for the following areas:
-
Network availability. See Network Availability Anomaly Detectors.
-
Network performance. See Network Performance Anomaly Detection.
-
Network security. See Network Security Anomaly Detectors.
To see the anomaly detectors and dashboards:
-
From the main navigation menu, select Analytics, then Flow, then Dashboards.
-
From the OpenSearch menu, under OpenSearch Plugins, select Anomaly Detection.
-
Do one of the following:
-
To see the anomaly dashboards, select Dashboard.
See Step 5: Observing the results in the OpenSearch anomaly detection documentation for information about interacting with anomaly dashboards.
-
To see the list of anomaly detectors, select Detectors.
You can filter the list by entering flow in the Search bar.
-
Network Availability Anomaly Detectors
Flow Analytics includes the following anomaly detectors for network availability:
-
High DHCP broadcast messages
-
Low DHCP relayed messages, responses, and request/response ratio
-
Low DNS responses and request/response ratio
-
Low LDAP request/response ratio
-
Low NTP responses, request/response ratio, and symmetric messages
-
Low RADIUS AUTH request/response ratio
-
Failed TCP sessions (edge, inbound, outbound, private)
These anomaly detectors are prefixed with flow_codex_avail.
Network Performance Anomaly Detectors
Flow Analytics includes the following anomaly detectors for network performance:
-
Unusual Destination ASN Traffic Volume
-
Unusual Source ASN Traffic Volume
-
Unusual Network Interface Egress Traffic Volume
-
Unusual Network Interface Ingress Traffic Volume
These anomaly detectors are prefixed with flow_codex_perf.
Network Security Anomaly Detectors
Flow Analytics includes the following types of anomaly detectors for network performance:
-
Access anomalies. See Network Security Access Anomalies.
-
Activity anomalies. See Network Security Activity Anomalies.
-
Amplification attacks. See Network Security Amplification Attack Anomalies.
-
Flood attacks. See Network Security Flood Attack Anomalies.
-
Reconnaissance anomalies. See Network Security Reconnaissance Anomalies.
Network Security Access Anomalies
Brute force access attempt anomalies indicate potential brute force login attacks.
Flow Analytics detects fast and slow edge, inbound, outbound, and private brute force access attempts for:
-
Direct and distributed CLI access
-
Direct and distributed remote desktop access
These anomaly detectors are prefixed with flow_codex_netsec_bruteforce.
Network Security Activity Anomalies
Flow Analytics detects rarely occurring network traffic, which can indicate malicious activity, such as malware exfiltration or communication with a command and control server. Although it does not always indicate malicious activity, these anomalies warrant further investigation.
The following network security activity anomalies are detected:
-
Rare Client-Side Autonomous System: Client-side traffic to or from a rare autonomous system.
-
Rare Server-Side Autonomous System: Server-side traffic to or from a rare autonomous system.
-
Rare Conversation (inbound): Rare inbound public to private conversations.
-
Rare Conversation (outbound): Rare outbound private to public conversations.
-
Rare Conversation (private): Rare private conversations.
-
Rare Country (inbound): Inbound traffic from a rare country.
-
Rare Country (outbound): Outbound traffic to a rare country.
These anomaly detectors are prefixed with flow_codex_netsec_rare.
Network Security Amplification Attack Anomalies
Flow Analytics detects reflection-based volumetric distributed denial-of-service (DDoS) attacks.
In this type of attack, an attacker sends requests to open services that act as reflectors, with the target IP address forged as the source. The reflector services send large responses to the target, resulting in amplified traffic to target servers or networks. The volume of data and traffic overwhelms the target, making the server and surrounding infrastructure unavailable.
Inbound and edge UDP amplification attacks are detected. These anomaly detectors are prefixed with flow_codex_netsec_ddos_udp_amplify.
Network Security Flood Attack Anomalies
Flow Analytics detects distributed and direct DOS flood attacks. In this type of attack, an attacker sends high volumes of requests directly to target servers. The volume of traffic overwhelms the target, making the server and surrounding infrastructure unavailable to legitimate traffic.
The following flood attacks are detected:
-
TCP DDoS Attack: A DDoS attack consisting of high volumes of TCP traffic from multiple sources to a TCP listener.
These anomaly detectors are prefixed with flow_codex_netsec_ddos_tcp.
-
ICMP Flood DDoS Attack: A DDoS attack consisting of high volumes of ICMP echo-request packets from multiple sources.
These anomaly detectors are prefixed with flow_codex_netsec_icmp_flood_ddos.
-
ICMP Flood Direct Attack: A DoS attack consisting of high volumes of ICMP echo-request packets from a single source.
These anomaly detectors are prefixed with flow_codex_netsec_icmp_flood_direct.
-
SYN Flood DDoS Attack: A DDoS attack consisting of high volumes of initial connection synchronization request (SYN) packets from multiple sources.
These anomaly detectors are prefixed with flow_codex_netsec_syn_flood_ddos.
-
SYN Flood Direct Attack: A DoS attack consisting of high volumes of SYN packets from a single source.
These anomaly detectors are prefixed with flow_codex_netsec_syn_flood_direct.
Network Security Reconnaissance Anomalies
Flow Analytics detects reconnaissance anomalies, which can indicate an attacker gathering network information to prepare for subsequent attacks. Detecting this kind of attack can give you an early warning of potential threats before a full attack occurs.
The following reconnaissance anomalies are detected:
-
Direct and distributed fast and slow port scans (edge, inbound, outbound, and private): Requests were sent to a very high number of ports, compared to other clients, in a specific time period.
These anomaly detectors are prefixed with flow_codex_netsec_port_scan.
-
Direct fast and slow ICMP scans (edge, inbound, outbound, and private): A high number of ICMP echo requests were sent in a specific time period.
These anomaly detectors are prefixed with flow_codex_netsec_icmp_scan.