Scalability and Redundancy
Oracle Communications Unified Assurance is a highly scalable platform that can range from a single server to dozens of horizontally scalable, inter-dependent servers. A single instance of Unified Assurance supports your organization's growing needs without requiring you to install and integrate additional instances.
Each tier of the Unified Assurance product is scalable and redundant through several means. This chapter describes each tier and component of the software.
Presentation Tier Scalability and Redundancy
The presentation tier consists of the internal presentation servers and optional external presentation servers for use in secured environments such as demilitarized zones (DMZs).
Internal Presentation Server Scalability and Redundancy
The internal presentation servers encompass the web user interface, the API, rules repository, image repository, package repository, dashboard integrations, and message bus. The first server installed is considered the primary presentation server, and you can install one additional redundant internal presentation server. The internal presentation servers are considered stateful because the Unified Assurance management database is collocated with them.
Redundancy of the internal presentation servers is provided as follows:
-
The Unified Assurance database is configured with MySQL multi-source replication. Unique table IDs are separated into even and odd pairs between the servers. This allows for a repair of a split-brain scenario to be conflict free and provide eventual consistency.
-
RabbitMQ message bus redundancy is enabled by configuring federation to replicate exchanges between both servers.
-
Package installation is mirrored between servers based on the configured roles but installed independently.
-
Configurations outside of the database and repositories are synchronized with Unison, a bi-directional application that uses the rsync protocol. Unison may encounter conflicts after the repair of a split-brain scenario but will never overwrite data until the authoritative files are manually identified.
-
As a best practice, the WebFQDN is defined in DNS to a Virtual IP (VIP) that can fail over between the two servers. You can achieve this by:
-
Using KeepAlived in the same data center and network
-
Setting up a load balancer in Layer4 mode instead of Layer7 to perform failover.
Unified Assurance uses TLS client certificate authentication and must terminate the secure session instead of the load balancer offloading this responsibility. The load balancer needs to perform cross data center failover and must also be redundant.
-
The following figure illustrates a redundant deployment for the internal presentation servers using a load balancer.
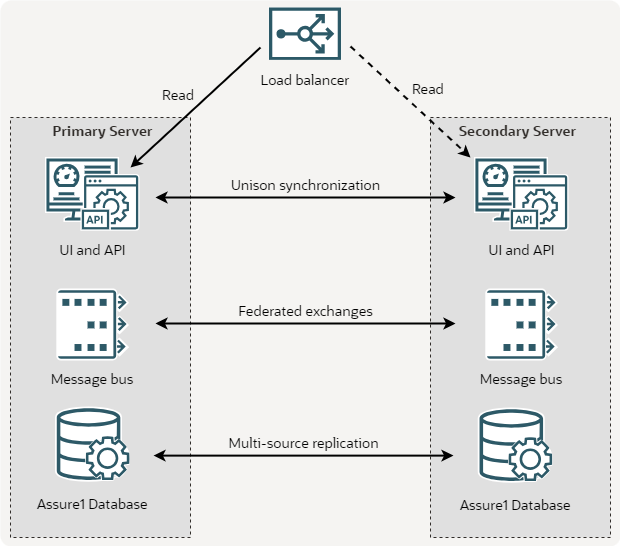
Description of illustration presentation-redundancy.png
Users access the internal presentation servers by the web fully qualified domain name (WebFQDN) configuration option. In a single server development instance, the WebFQDN is commonly the same as the HostFQDN, but you can set the WebFQDN to any valid FQDN as a vanity URL. You must be careful when choosing a WebFQDN that is different than the HostFQDN, especially when redundancy is enabled. As a best practice, redundant pairs should share a WebFQDN.
Your internal and external presentation servers can share the same WebFQDN, or they can use a different one. In redundant environments with a VIP, the redundant pair of internal presentation servers should share a WebFQDN, and the redundant pair of external presentation servers should share a WebFQDN, but the internal and external WebFQDNs can be different.
In environments without a VIP, the internal presentation servers can each have a separate WebFQDN, but several components (SVN, API calls, image repository, package repository) can only support a single destination. Because of this, you can only achieve partial presentation server failover with separate WebFQDNs, so changes should be minimized.
External Presentation Server Scalability and Redundancy
If you have multitenant configurations, or you need to scale the presentation layer beyond two servers, you can install one or more external presentation servers. These servers do not contain the stateful Unified Assurance management database and are a good fit to be deployed in a DMZ for public exposure.
Redundancy of the external presentation servers is the same as that for internal presentation servers, without the MySQL multi-source MySQL replication, which only applies to the database.
Database Tier Scalability and Redundancy
The database tier consists of the following databases, each of which supports scalability and redundancy in different ways:
-
The Event database
-
The Historical database
-
The Metric database
-
The Graph database
Event Database Scalability and Redundancy
The Event database is stored in the MySQL Relational Database Management System (RDBMS).
-
Scalability: The Event database uses sharding for scalability. Shards are usually divided in several ways, including regulator separation, regional separation, or spreading processing load across several databases. When you shard the Event database, you must configure the event collectors for a specific shard ID, which is defined for each database instance or pair of redundant instances.
-
Redundancy: The Event database uses MySQL multi-source replication for redundancy. Unique event IDs are separated into even and odd pairs between the servers. This allows repairing split-brain scenarios to be conflict free and provides eventual consistency.
Historical Database Scalability and Redundancy
The Historical database is stored in OpenSearch, and includes index templates for Observability Analytics, Flow Analytics, and Log Analytics.
-
Scalability: You scale OpenSearch by adding additional servers to existing clusters. You do this when you run Analytics Wizard on the new server, after installing Unified Assurance.
Flow Analytics scalability is achieved using the microservice cluster. You can have Flow Collector pods running on multiple clusters with flow data exporters sending data to different clusters to balance the load.
-
Redundancy: Redundancy for the Historical database is handled in different ways for different indexes. In all cases, the redundant Historical database clusters both operate simultaneously but independently, each receiving events, flows, and logs from their corresponding primary and secondary services. A cluster is considered healthy when at least two out of three nodes are running. The services that send data to the Historical database (MySQL Replication Data Importer, the Flow Collector microservice, and Fluentbit) automatically find an active node to send data to. This allows you to achieve high availability within the cluster
-
For Observability Analytics redundancy, the Historical database uses the Event database, which synchronizes events between the primary and secondary Event databases by multi-source replication. The primary MySQL Replication Data Importer synchronizes events and journals from the primary Event database to the primary Historical database, and the secondary instances follow the same pattern.
If the primary Historical database goes down, the primary MySQL Replication Data Importer cannot insert events. It stops processing events, and retries every thirty seconds. The secondary Historical database continues to receive events from the secondary Event database. When the primary comes back online, the primary MySQL Replication Data Importer starts synchronizing events from the Event database from the point where it left off.
If the primary Event database goes down, it fails over to the secondary Event database. The primary Historical database remains online, but MySQL Replication Data Importer stops getting events, while the secondary Historical database continues to get events from the secondary Event database. When the primary Event database comes back up, all events that occurred while it was down are synchronized to it from the secondary Event database, and MySQL Replication Data Importer begins getting events from the point where it left off.
-
For Flow Analytics redundancy, you deploy the Flow Collector microservice to redundant collection servers. Each flow data exporter sends the same data to both primary and secondary Flow Collectors. If the primary Historical database is down, the primary Flow Collector tries three times to send the data, then discards it. The secondary Flow Collector continues to send the data to the secondary Historical database. When the primary database comes back up, the primary Flow Collector starts inserting data from that point. Any flow data that the primary Flow Collector received while the database was down is lost on the primary Historical database, but present on the secondary.
-
For Log Analytics redundancy, the Historical database uses redundant instances of Fluentbit. Two instances run on each Unified Assurance server, sending identical log data to the Fluentd services on the primary and redundant OpenSearch clusters. If at least two nodes on a cluster are running, Fluentbit continues to read log data and send it to Fluentd on that cluster. If one or no nodes are running, that instance of Fluentbit stops reading log data. Because the redundant instance continues to read and send logs to the redundant cluster, no data is lost. When the cluster stability is restored, Fluentbit resumes reading logs and sending them to the cluster, starting from where it left off.
-
The following figure illustrates a deployment for the Historical database with three-node redundant clusters, receiving event data from the Event databases, and receiving log and flow data from other Unified Assurance servers. Each Historical database node, along with every other server in the environment, would also have redundant instances of Fluentbit running to collect logs and send them to Fluentd instances on both clusters, but these have been omitted from the figure for simplicity.
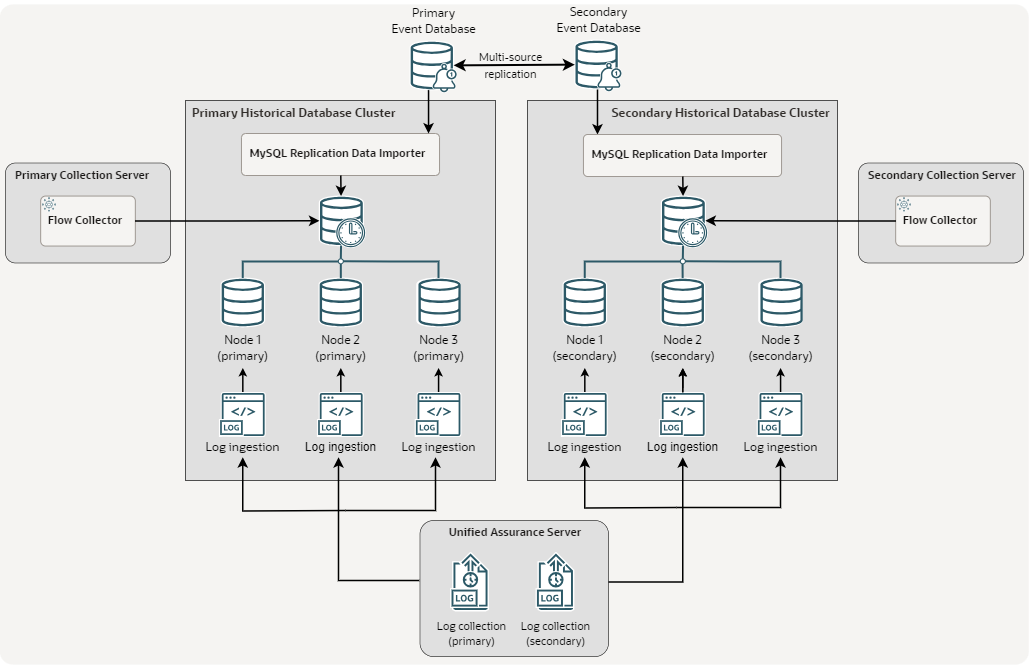
Description of illustration historical-database-redundancy.png
Metric Database Scalability and Redundancy
The Metric database is stored in InfluxDB, a time-series database.
-
Scalability: The Metric database uses sharding for scalability.
You implement sharding by metric by configuring devices with a specific shard ID, which is defined for each database instance or pair of redundant instances. Unlike with event collectors, metric collectors and pollers send metrics to the appropriate shard without needing to be configured in Unified Assurance directly. Each Unified Assurance server has an instance of Telegraf, which polls the local system and batches metrics to the appropriate Metric database instance.
-
Redundancy: You implement redundancy for the Metric database by linking Kafka message buses to the ingestion pipeline.
The Telegraf instance on each server sends metrics to the Kafka message bus instead of directly to InfluxDB. Telegraf fails over to the redundant Kafka server as needed. You install an additional Telegraf instance on each metric server to read from both primary and redundant Kafka message buses and batch insert those metrics into the local InfluxDB server. This redundancy handles failovers and split-brain scenarios to provide eventual consistency of data between both InfluxDB servers.
The following figure illustrates a redundant deployment for the Metric database.
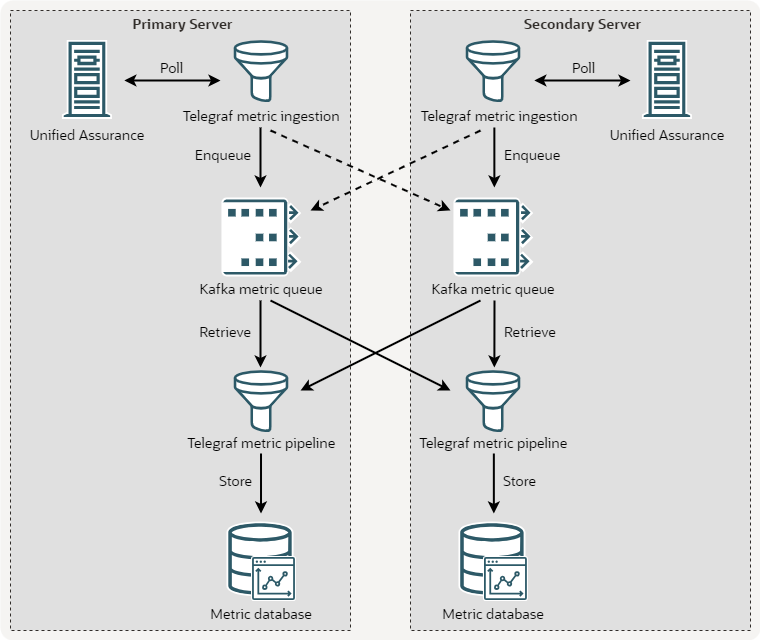
Description of illustration metric-database-redundancy.png
Graph Database Scalability and Redundancy
The Graph database is stored in Neo4j, a NoSQL document and graph database.
-
Scalability: You scale the Graph database by using Neo4j's clustered architecture, which provides flexible horizontal and vertical scaling solutions and in-memory graph caching.
-
Redundancy: The clustered architecture also handles redundancy of up to two servers. These two redundant servers can cluster locally or across data centers. Each server has unique cluster IDs for all documents, vertices, and edges. This allows for a repair of a split-brain scenario to be conflict free and provide eventual consistency.
SOA Collection and Processing Tiers Scalability and Redundancy
The service-oriented applications (SOA) on the collection and processing servers are managed by a local instance of the Unified Assurance Broker. The Broker is responsible for making sure enabled services are always running every minute, and starting jobs based on their cron schedules. You can add multiple collection and processing servers to a single Unified Assurance instance to horizontally scale the processing and analytics of data.
About General Broker Failover
Each Broker sends a heartbeat message to the Rabbit MQ message bus broadcasting to all other Brokers every second. Each Broker knows the state of every other Broker, alive or dead. The following considerations determine when to make failover or clustering changes:
-
When a Broker starts, it waits to catch up on heartbeats from other Brokers. If the Broker was cold started (from the server booting up), it waits 60 seconds. If the Broker was warm started (from an update) and the server has been running for some time, the Broker waits 5 seconds.
-
While the Broker is running, if it does not detect heartbeats from any Broker partnering in application redundancy for 30 seconds, the Broker initiates failover.
About Job Failover
You can configure redundant scheduled jobs for failover. Use the Jobs UI to apply the same application configuration for both jobs. When configuring the redundant job, you choose its corresponding primary job. The primary and redundant jobs must be the same application type and located on separate servers.
The primary job will always be run if the Broker running that job is online. If the redundant Broker for the job cannot reach its primary Broker, the redundant job is run. In a split-brain scenario, where Brokers may still be running but unable to communicate with each other, both jobs will run. How conflicts are handled is up to each application; the default jobs are configured to minimize conflicts.
About Service Failover
You can configure redundant services for failover. Use the Services UI to apply the same application configuration for both services. When configuring the redundant service, you choose its corresponding primary service.
Unlike redundant jobs, both services run at the same time. Each application requests its state from the local Broker and handles failover internally. The active service (usually the primary) will perform all the work necessary, just like a standalone service. The standby service (usually the redundant) will configure itself and hold off on processing data. If the standby service passively receives data, it logs the collection, buffers a small configured amount, and the discards the oldest data. If the standby service actively collects data, it does not perform any action during its poll time. When the redundant Broker for the server cannot reach its primary Broker, the redundant server becomes active, and collection or polling proceeds as normal.
During rolling maintenance or updates, the primary Broker can tell the redundant service to immediately become active. In this case only, the primary Broker stays running while its primary service is stopped.
About Clustering Services
You can cluster services to spread the responsibility for work across multiple applications. You can only cluster services for applications that actively poll data.
Clustered applications can be running anywhere, with several on the same server or separate servers. Use the Services UI to apply the same application configuration for both services. Each service has a cluster ID, which is a numeric value appended to the name of the application binary. You can run multiple clusters of the same application type on separate cluster IDs. Services in a cluster communicate with their local Brokers to determine the current number of applications in the cluster. This number of members determines how the work is divided among members (for example, split processing based on devices). When members join or leave the cluster, the division of work is recalculated for the next poll cycle.
Microservice Collection and Processing Tiers Scalability and Redundancy
Microservices run in the Kubernetes container orchestration platform. You can configure microservices to run as independent pods, in deployments, stateful sets, or daemon sets. The Kubernetes declarative model attempts to run the count and location of microservices if possible based on resources. When multiple servers are added to a cluster, if there is a server outage, failover is automatically handled by moving the microservices to another server if possible. The details are numerous and can be configured in great detail. For more information, see the Kubernetes documentation. To understand more about microservices in Unified Assurance, see Understanding Microservices.