Navigating Vision
You navigate the Oracle Communications Unified Assurance Vision map using zoom controls, the menu bar, layer visibility controls, and the context menu.
Navigating the Map
To navigate the map:
-
Pan around the map by doing one of the following:
-
Click and drag the map.
-
Use the arrow keys on your keyboard.
-
-
Use the zoom controls and home button at the top left of the map to zoom in and out and return the map to the default zoom and location.
-
Right-click the map to see the available options for the context. See the following for information about context menu options:
-
Click the colored filters at the bottom of the map to filter events based on severity.
You can hold Ctrl and click to select multiple severity filters at the same time.
-
Click or right-click events on the map to interact with them. See Understanding Events on the Map and Interacting with Events on the Map.
Using Context-Sensitive Buttons
The buttons beneath the zoom controls appear and change depending on context when you interact with events on the map. Buttons that can appear are:
-
 The pause button, which indicates that events on the map are paused. Click it to resume events.
 -
 The End Measuring Mode button. See Measuring Distances.
 -
 The same icon represents either the End Geofencing Mode or the Draw Free Form button, depending on the context. See Seeing Severity for Events within a Geographic Zone and Selecting Multiple Markers in a Free-Form Boundary.
 -
The E or C button, which indicates whether you can select events (E button) or custom markers (C button). You can only select one type of marker at a time. Click the button to switch which type of marker to select.
Using the Menu Bar

Description of illustration menu-bar.png
The menu bar, which appears at the top of every page in Vision, contains the following buttons:
-
Home View: Returns you to the map from any screen. It also reloads the map if it is currently open.
-
Settings: Opens the settings page. Refer Managing Settings for details.
-
Dashboards: Displays a list of available dashboards in a menu. Select a dashboard to view it. See Dashboards for details.
-
Attribution: Displays information about versioning and third-party software used within Vision, and attribution for map tiles used in the current session.
-
Search: Extends a search bar and pauses the map. You can search any currently displayed events, event layers, and custom layers. See Searching the Map for details.
-
Error Message: Displays a list of the ten most recent error or warning messages, with the most recent at the top. The icon is red when there are unread messages. To display all messages, click the menu button in the top right corner of the list.
Searching the Map
You can search the events and custom layers currently displayed on the map by name, address, IP address, latitude, or longitude.
To search the map:
-
Click Search on the menu bar.
Events on the map are paused.
-
Enter at least three characters. The search updates dynamically as you type.
You can optionally limit your search to specific fields by entering <field>:<value>, where <field> is one of the following:
-
NAME: Searches the name field only.
-
ADDRESS: Searches the address field only.
-
IPADDRESS: Searches the IP address field only.
-
METADATA: Searches the metadata field. It is a JSON object and you can use it to search multiple selected attributes.
For example, enter NAME: London in the search bar to search for anything with a name field containing the string London.
-
-
Select an item from the results list to pan and zoom the map to that item.
Note:
In the settings menu, the search bar filters the data in the table that is currently displayed. See Searching the Data for information.
Controlling Layer Visibility
You can control which layers are visible on the map by using the sidebar menu.
Layers are organized by type in the tabs labeled in the following figure:
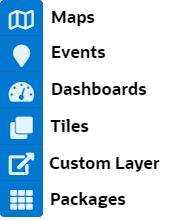
Description of illustration sidebar.png
Click a tab to see which layers of that type are available:
-
Maps: Select which base map to use. For example, you can choose a satellite map or an Open Street Map.
See Maps for information about configuring the base map.
-
Events: Select which event layers are visible.
See Layers for information about configuring Vision event layers.
-
Dashboards: Select which dashboard layers are visible. This tab only appears when at least one dashboard layer has Show on map set to true. If multiple dashboards contain the same links, those links will only be displayed on the map once.
See Dashboards for information about configuring Vision dashboards.
-
Tiles: Select which overlay tile layers appear on the map. Legends also appear for some tile layers. For example, the Rain Classic tile adds a precipitation overlay and legend to indicate what the colors mean.
See Maps for information about configuring map tiles.
-
Custom: Select which custom layers appear on the map. This tab only appears when at least one custom layer has Display Layer set to True.
See Custom for information about configuring custom layers.
-
Packages: Select the packages that appear on the map. Packages with Use Package set to true appear on this tab.
See Packages for information about package settings.
If there are no layers available for a tab, a notification appears on the tab. A warning icon appears beside layers with issues. Hover over the layer to see a tooltip with information about the issue.
Measuring Distances
-
Right-click the map where you want to create a starting pin and select Measure Distance
The End Measuring Mode button also appears below the zoom controls.
-
Click the map to create additional pins.
The right-hand side of the screen shows the total distance between the start and end points.
-
Hover over the line between the points to see a green ball. Click and drag this ball to add another pin to the line.
-
Click a pin to delete it.
Measuring mode redraws the line between the remaining pins.
-
Drag pins around the screen as required.
-
Turn off measuring mode in one of the following ways:
-
Click the End Measuring Mode button.
-
Right-click the map and select End Measuring Mode.
-
Showing Coordinates
To show coordinates, right-click the map in the desired location and select Show Coordinates. A box on the map displays the latitude and longitude at the location of the right-click.
Filtering Events by Severity
You can filter events by severity using the severity filter bar. Each colour in the severity filter bar indicates a specific level of severity. Click a severity to see the events currently on the map matching that severity. You can hold ctrl and click to select multiple severities.
The counts in the severity filter bar include markers from all layers, even those that are not currently active.
See Interacting with Events on the Map for more information about selecting layers. See Understanding Events on the Map for more information about the severity filter bar.