Dashboards
Overview
You can access a specific dashboard by clicking the dropdown menu on the menu bar, then within the dropdown pick the relevant dashboard from the list, as shown in the following figure. When you click an item from this dropdown, the selected dashboard will replace the current view.
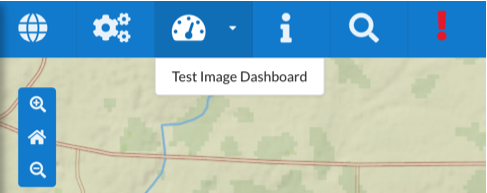
Description of illustration dashboard-dropdown-menu.png
When selecting a dashboard from the dropdown, if the dashboard is configured to be a logical (image) dashboard this will be displayed, otherwise the geographical dashboard will be displayed. You can switch between the logical view and geographical view using the buttons along the bottom of the dashboard. See Interacting with a Dashboard.
Dashboards are also available to view on the main map view, they will always display in their geographical format. If there are any available they will be in the dashboards layer controller, see Controlling Layer Visibility. Selecting a dashboard in the layer controller will be displayed on the map.
Description of illustration dashboard-on-map.png
A Logical Dashboard uses an image as its background and allows the user to configure the position of items displayed in the dashboard. This differs from a Geographical Dashboard where the position of the items in the dashboard are determined by their geographic location.
The following image shows an example of a logical dashboard.
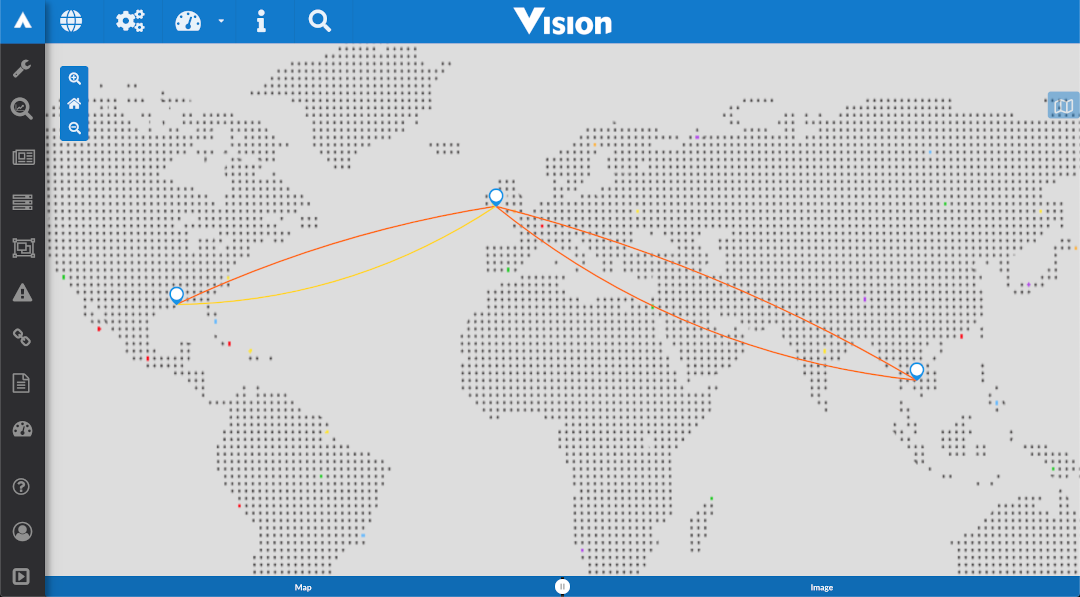
Description of illustration logical-dashboard-example.png
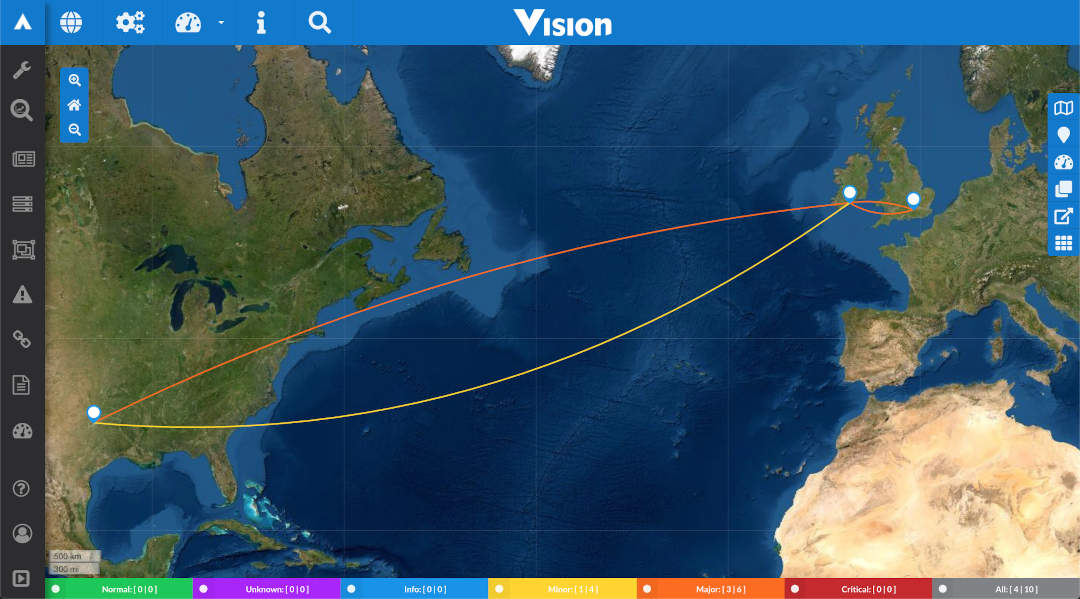
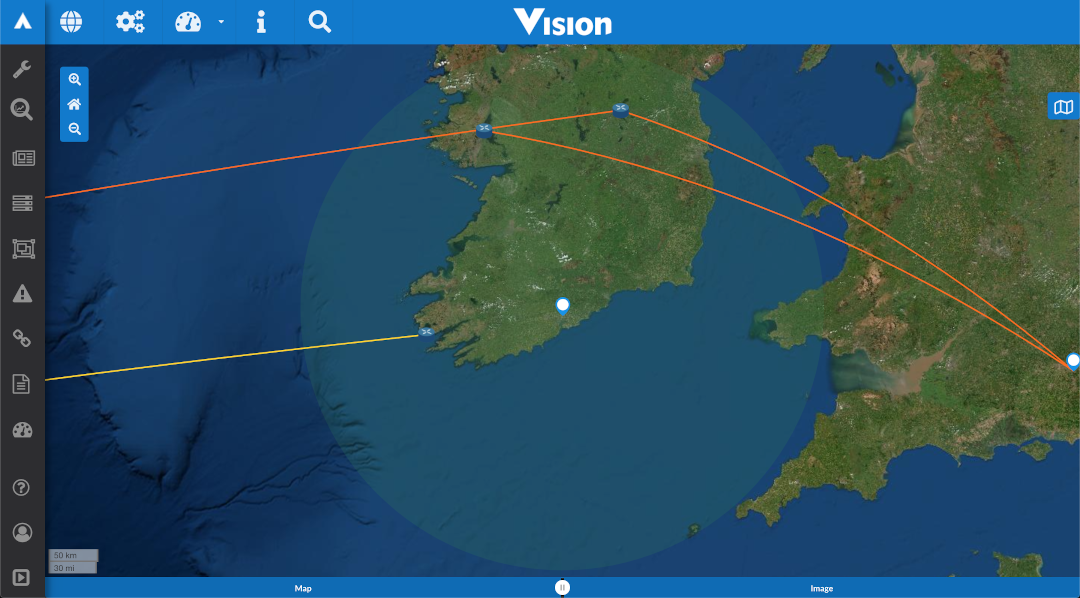
The following image shows an example of a geographical dashboard.
Description of illustration geographical-dashboard-example.png
Interacting with a Dashboard
Navigating the Dashboard
When using a dashboard, you can click and hold the map with your mouse or use the arrow keys on your keyboard to pan around the screen.
At the top-left of the map you find the following zoom controls:
-
The Home button returns the map to the default zoom level and location.
-
The Plus and Minus buttons zoom in and out.
You can also zoom in and out by using the scroll wheel on your mouse.
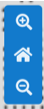
Description of illustration zoom-control.png
In the geographical view, the Maps tab allows you to select from all configured base maps. For example, you can choose a Satellite map or the OSM (Open Street Map). This tab is disabled for Logical Dashboards.
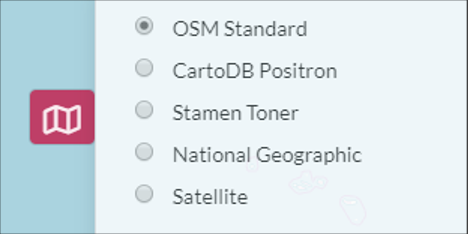
Description of illustration maps-tab.png
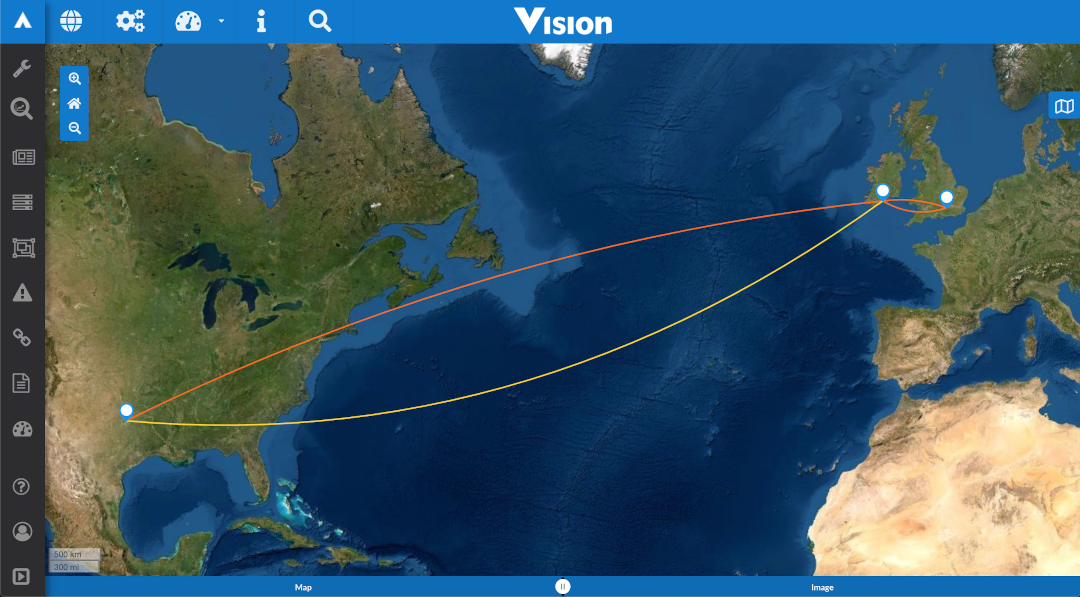
The buttons along the bottom of the screen allow you to switch between the Geographic (Map) and Logical (Image) view of the current dashboard if both are available.

Description of illustration dashboard-view-control.png
Viewing the Data on a Dashboard
When viewing a dashboard - either logical or geographic - you will see any number of links between entities. In a logical dashboard the blue markers have a pixel location set, the red markers are a transformed value based on the entities latitude and longitude and have not been configured for the logical dashboard. See Configure a Dashboard for details.
Both marker colors are shown in the following figure.
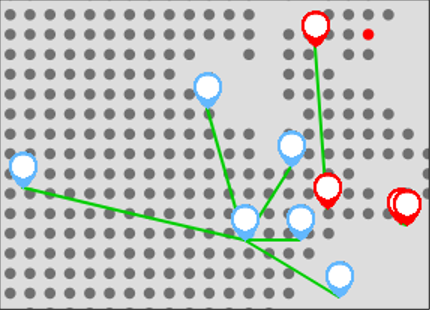
Description of illustration logical-dashboard-marker-types.png
When you hover over a marker a tooltip displays that contains the entity name for that marker. See the following figure.
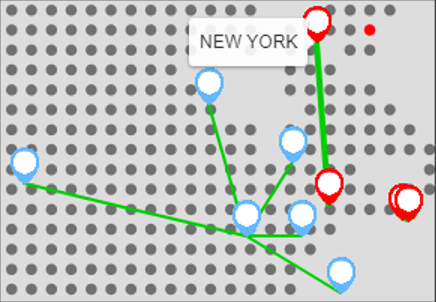
Description of illustration dashboard-marker-tooltip.png
Click an entity marker to see the expanded view for that marker. This expanded view shows the devices at that location that have a link connected to them. Hover on a device marker (dark blue) to display a tooltip with the name of the entity and the device. This can be seen in the following figure.
Description of illustration dashboard-expanded-marker.png
Click the entity marker to collapse the expanded view.
Hover on a link to display a tooltip containing the CID (the Circuit ID of the link) and Bandwidth for that link. This can be seen in the following figure.
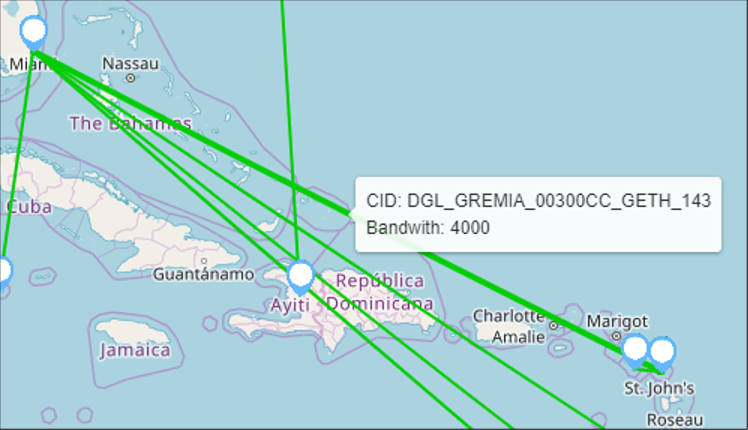
Description of illustration dashboard-link-tooltip.png
Click a link to display a pop-up containing information about that link, to see what information is displayed in the popup see sections General Tab, Source Tab, Events Tab, Weather Tab.
Only one pop-up can be open at any given time. When you click on another marker, any currently opened pop-up will close. You can still pan around the map using left-click and hold. You can also still zoom using the scroll wheel or the Zoom menu.
When the map is in a paused state, a pause button appears under the zoom control. Click it to unpause the map. Switching to the other type of dashboard will also unpause the map. This button can be seen in the following figure.

Description of illustration dashboard-controls-pause.png