16 Using the Overview Tab
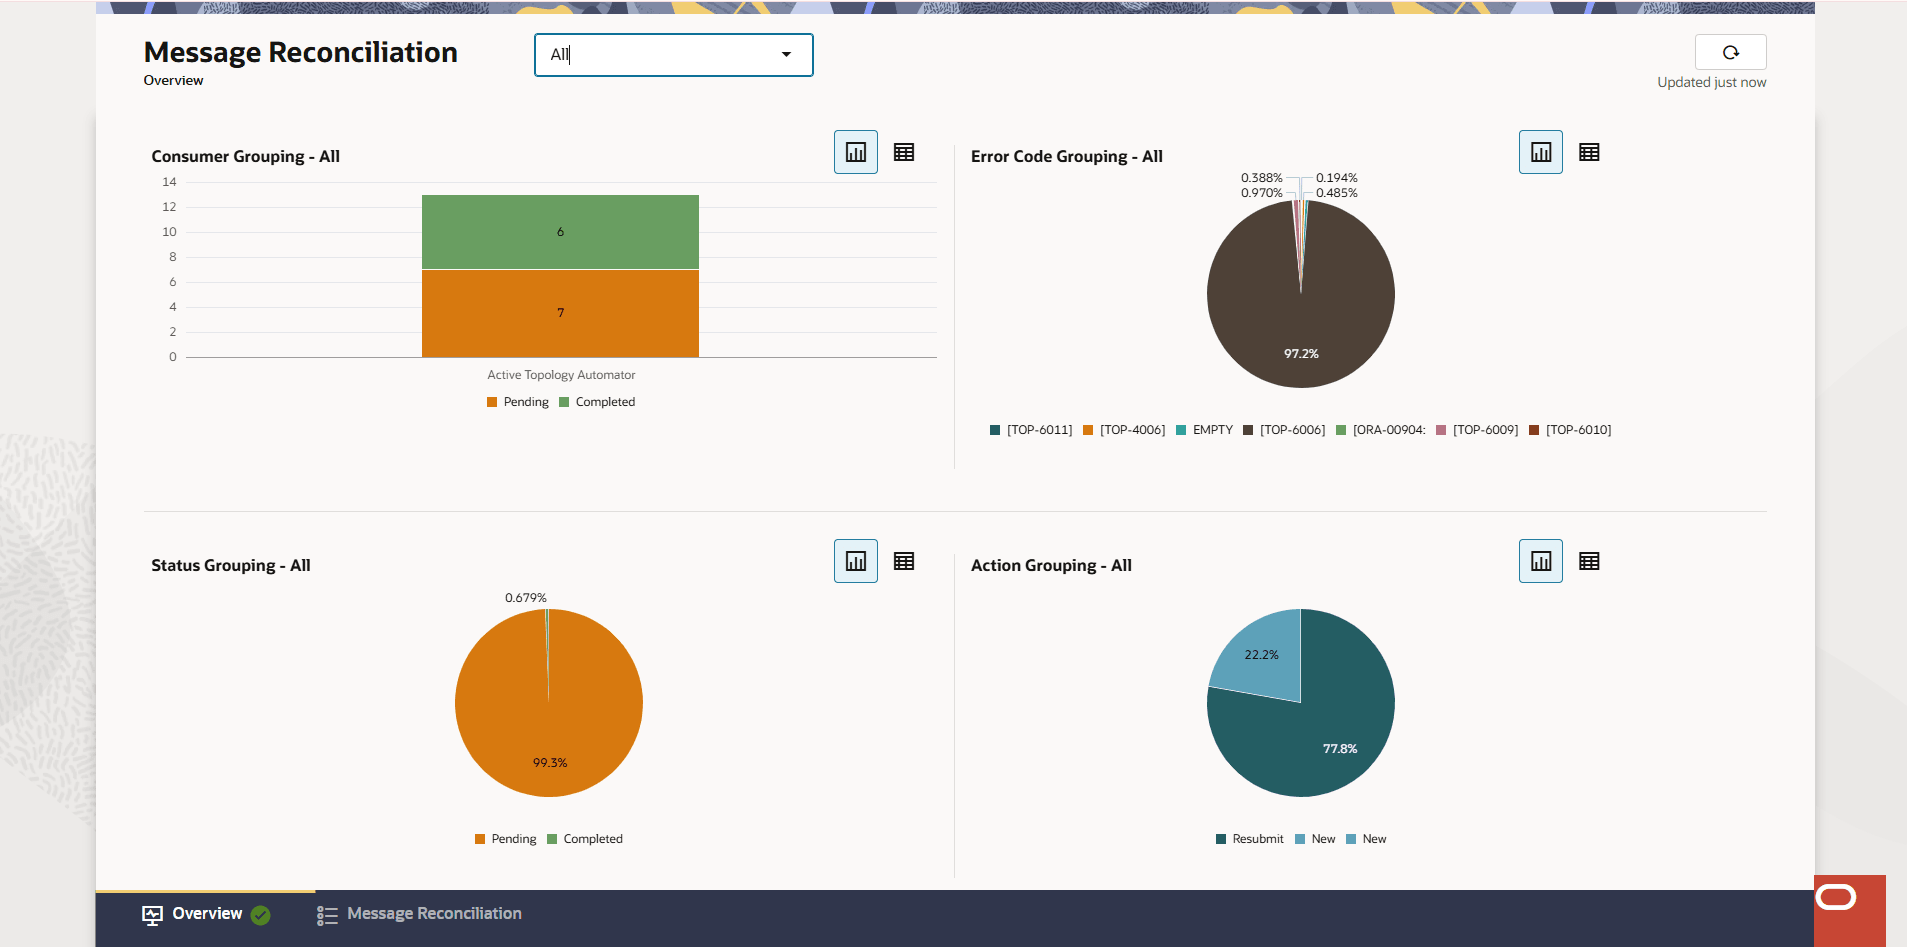
The Overview tab provides a summary of all fallout events grouped by consumer, error code, status, and actions.
You use the Overview tab to:
- View the categorized display of the fallout events summary.
- Switch the fallout events summary between a table view and a chart view.
- Select a consumer from the drop-down to see the fallout events summary
for that consumer.
Note:
Select All from the dropdown list to see the fallout events summary for all consumers. - Update the fallout events information with the latest data by clicking the refresh icon on the upper-right corner.
The following image illustrates the Overview tab of Message Reconciliation.
About the Fallout Events Groups
The fallout events information is displayed in the following groups:
- Consumer Grouping
- Error Code Grouping
- Status Grouping
- Action Grouping
About Consumer Grouping
Consumer Grouping shows the number of events for each consumer, grouped by state, in the form of a bar chart.
Hover over the graph to view the following details:
- Series: Provides the fallout event status name.
- Group: Provides consumer name of the fallout events.
- Value: Provides the total number of fallout events for the corresponding status.
About Error Code Grouping
Error Code Grouping shows the percentage of events for each type of error code in the form of a pie chart.
Hover over the graph to view the following details:
- Error Code: Provides the fallout event error code.
- Count: Provides the total number of fallout events for the error code.
About Status Grouping
Status Grouping shows the number of events in each status, such as Pending or Completed, in the form of a pie chart.
Hover over the graph to view the following details:
- Status: Provides the fallout event status.
- Count: Provides the total number of fallout events for the status.
The valid values for Status are:
- Pending
- Failed
- Completed
- In Progress
About Action Grouping
Action Grouping shows the number of events for each type of action, such as Resubmit, Rebuild, and New, in the form of a pie chart.
Hover over the graph to view the following details:
- Action: Provides the fallout event action.
- Count: Provides the total number of fallout events for the action.
