4 Dashboard Tab Operations
The Oracle® Enterprise Session Border Controller (ESBC) provides a web-based Dashboard that can display application and system data in Widgets to help you monitor and manage the system. You can add and remove Widgets from the Dashboard, specify their data sampling settings, and export the data.
Web GUI Tabs Displays and Operations
The Web GUI displays tabs that you click to display information and perform tasks, such as configuring, managing, and monitoring the system. Each tab displays a unique set of tools to control its operations. The following information describes the operations and tool sets for each tab.

Dashboard Tab
The Dashboard tab displays SIP statistics and other information about your Oracle® Enterprise Session Border Controller (ESBC) through Widgets that display graphs, charts, and tables. The ESBC provides dozens of Widgets to choose from and the Dashboard can display up to eighteen widgets at a time. You can add and remove the Widgets, as needed. The Dashboard is the default landing page.
Configuration Tab
The Configuration tab displays the Wizards and Commands controls along with lists of configuration objects, grouped in the same tree-like structure as found in the Acme Command Line Interface (ACLI).
Monitor and Trace Tab
The Monitor and Trace tab displays the call ladders and session details of SIP signaling calls and information about system activities by way of summary reports of filtered SIP data. You can export the ladder diagrams, session details, and summaries from the Monitor and Trace tab.
Widgets Tab
The Widgets tab displays graphical views of System, Media, and Signaling data about the Oracle® Enterprise Session Border Controller. Each Widget corresponds to an ACLI show command. On the Widgets tab, you can click links to the Widgets for viewing and you can add Widgets to the Dashboard and your Favorites list.
System Tab
The System tab displays system objects and controls for managing, booting, configuring, and upgrading the system.
Configuration Search Tool
The Configuration tab provides two levels of search operations. You can use the Search tool on the Configuration tab to search for configuration objects. Within a multi-instance configuration object, you can use Search to find a specific configuration instance on the list.
The Search tool, displayed as a magnifying glass, on the Configuration page header opens the Search text box where you enter the text to search for, such as a configuration object name, an attribute, or value. You can enter the full name of a configuration object to find a specific object or you can enter a phrase to see a list of all objects that contain that phrase. For example, you can enter enable-snmp-auth-traps to find that object or you can enter SNMP to see a list of all configuration objects with SNMP in their name.
The Search magnifying glass is located in the middle of the Configuration tab.

When you click the Search tool, the system displays the Configuration Search text box next to the Magnifying Glass, where you enter the configuration object name, attribute, or value that you want to find. When you search for a phrase, rather than a complete object name, the system displays a list of all objects that contain the phrase.
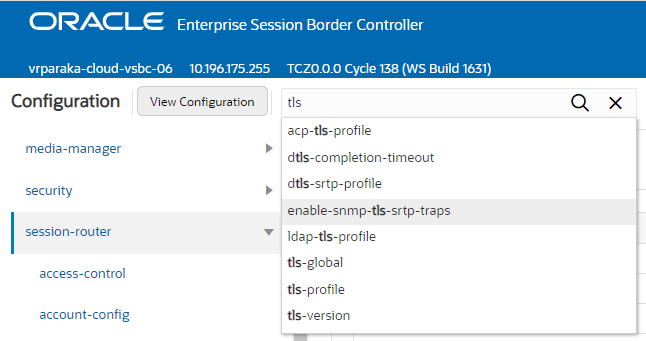
Multi-instance configuration objects display a list of configurations and the table includes a text box for local search within the table. You can enter all or part of the configuration name.

When you search for a particular configuration, the results display only that configuration and the system adds a clear entry icon, displayed as an 'x', to the Search field.

When you click the button, the system resumes displaying all of the configurations on the list.
Dashboard Controls and Operations
The Oracle® Enterprise Session Border Controller (ESBC) can display dynamic data about the system through Widgets that you choose to place on the Dashboard. You can decide which Widgets to display by adding, deleting, and moving them at any time. The Dashboard can display up to 18 Widgets.
Note:
The (ESBC) collects only SIP data for the Dashboard Widgets, including the default CPU and Memory Widgets. For this reason, you must set up a valid SIP configuration before the ESBC can display any data on a Dashboard Widget.The following screen capture shows an example of the Dashboard page and the controls you use to manage the Widgets:
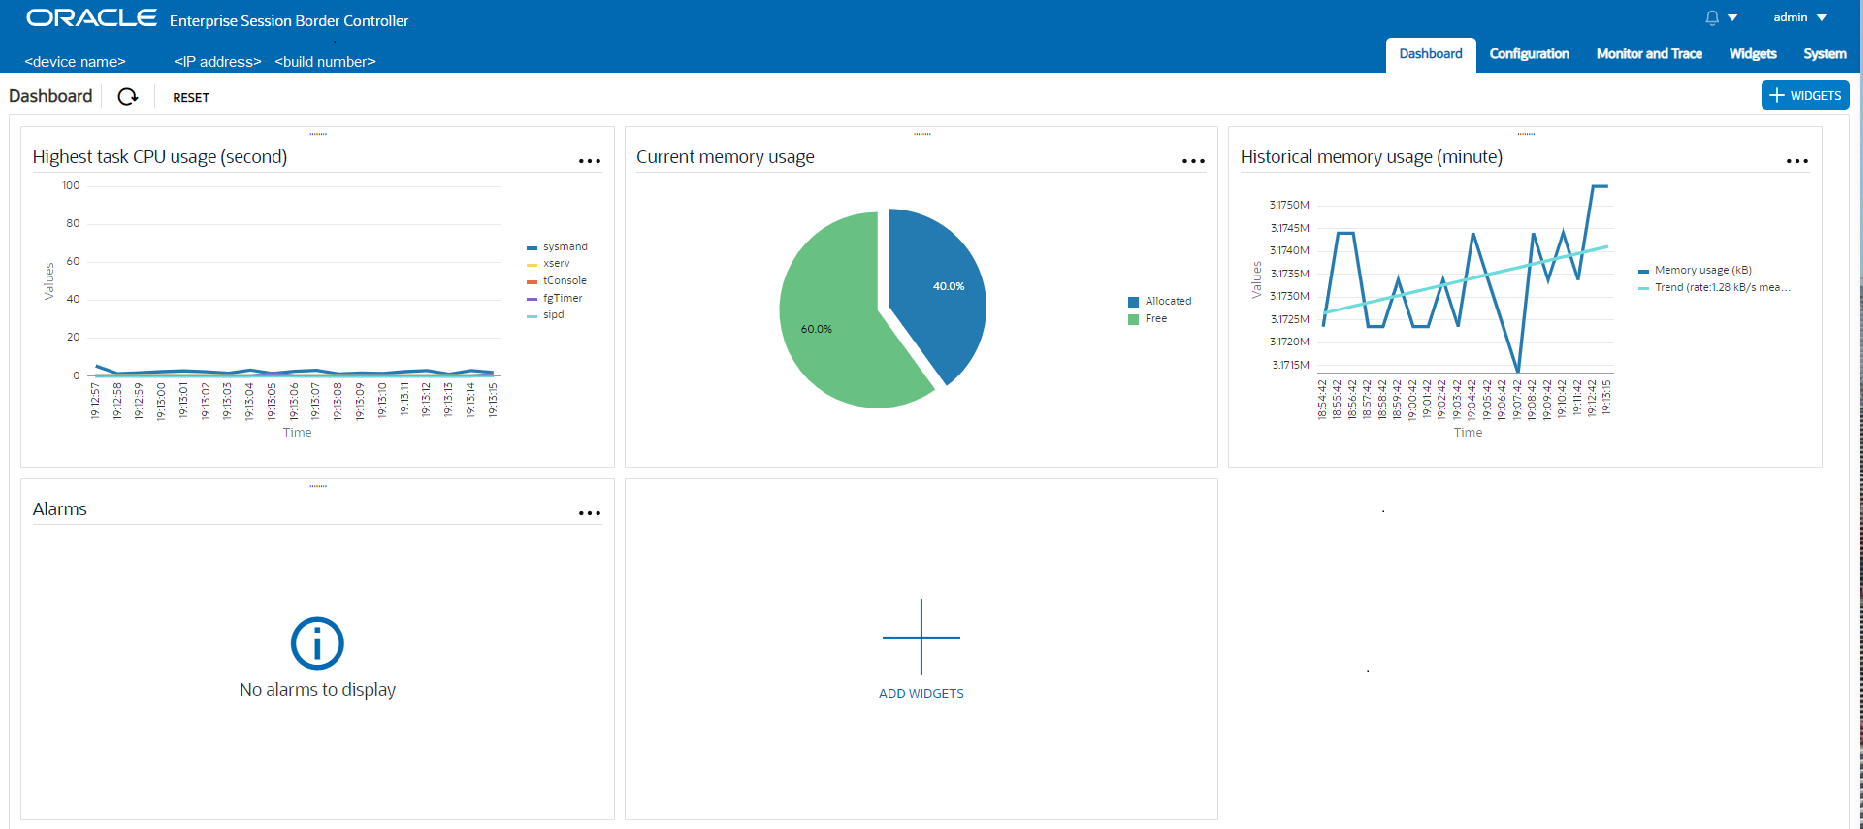
 —Shows the device name, the device IP address, and the software build number.
When you deploy your SBC in a High Availability (HA) pair, the system identification
also states whether the device is the Active or Standby peer.
![]() —Updates the data in all of the Widgets on the Dashboard.
—Updates the data in all of the Widgets on the Dashboard.
![]() —Resets the Dashboard to display the default Widgets and removes all other
Widgets from the Dashboard.
—Resets the Dashboard to display the default Widgets and removes all other
Widgets from the Dashboard.
![]() —Displays the list of Widgets that you can add to the Dashboard.
—Displays the list of Widgets that you can add to the Dashboard.
 —Displays the list of Widgets that you can add to the Dashboard.
 —Tells you that the Widget is blank because there is no data to display.
A Widget can display a table, text, a pie graph, or a line graph depending on the type of data and the purpose of the display. For example, the SIP Realms All Widget displays an actionable table and the Recording Widget displays static text. You can access the list of Widgets from the Dashboard page by clicking Add Widget.
Most of the Widgets automatically display any available data when you click the name of the Widget, but some Widgets require further input. Such Widgets include a Settings button in their tool bar that launches a parameters dialog were you specify the data to display. For example, the Realm Specifics Widget requires you to set the name of the realm and the auto refresh interval.
Note:
The operation of Widgets, such as those that require the SIP Session module, may affect system performance. The system displays a warning when you add a Widget that may affect performance. Oracle recommends adding such Widgets at a time when the performance impact will not affect service.- Highest CPU Usage
- Current Memory Usage
- Historical Memory Usage
- Alarms
Widget Controls
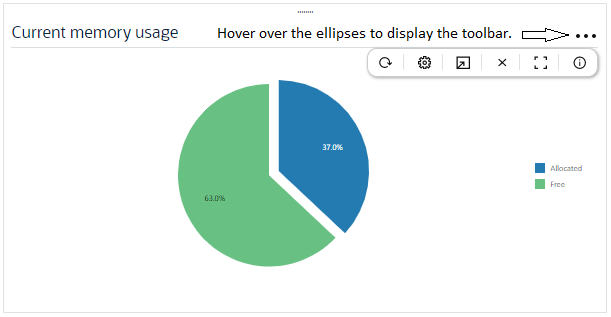
Each Widget contains the controls that you use to manage its operations, according to the purpose of the Widget. The controls display when you hover over the three ellipses in the upper right corner of the Widget.
The following screen capture shows an example of the tool bar that displays in a Widget. In the Widget, you can hover over the control for a description.
The following information describes the Widget controls.
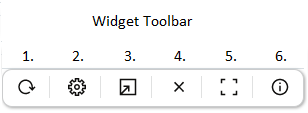
- Refresh—Updates the data in the Widget.
- Settings—Displays the dialog where you set the data sampling parameters for the Widget. When you click the icon, the Widget displays the Settings dialog, where you can set the auto-refresh interval and other parameters that apply to the particular Widget. Widgets can display up to 100 data samples in intervals of 1 hour, 1 minute, or 1 second.
- Export—Downloads the data displayed in the Widget.
- Remove—Removes the Widget from the Dashboard. When you remove all Widgets from the Dashboard, the GUI displays the following message: " Your Dashboard is empty, please add a Widget or reset to restore the original Dashboard."
- Maximize—Displays the Widget in full-screen size.
- Show Information—Describes the data display. For example, in the Current Memory Usage Widget, the information icon says, "Pie graph displays current percentage of free and allocated memory."
About the Add Widgets Page
After you click either the +Widget button or the Add Widget card on the Dashboard, the Web GUI displays the Add Widget page. On the Add Widget page, you can search for Widgets to add to the Dashboard and you can see which Widgets exist on the Dashboard. You can also see descriptions of the Widgets and change the display from card view to list view.
The following screen capture shows the default view of the Add Widgets page, called card view.
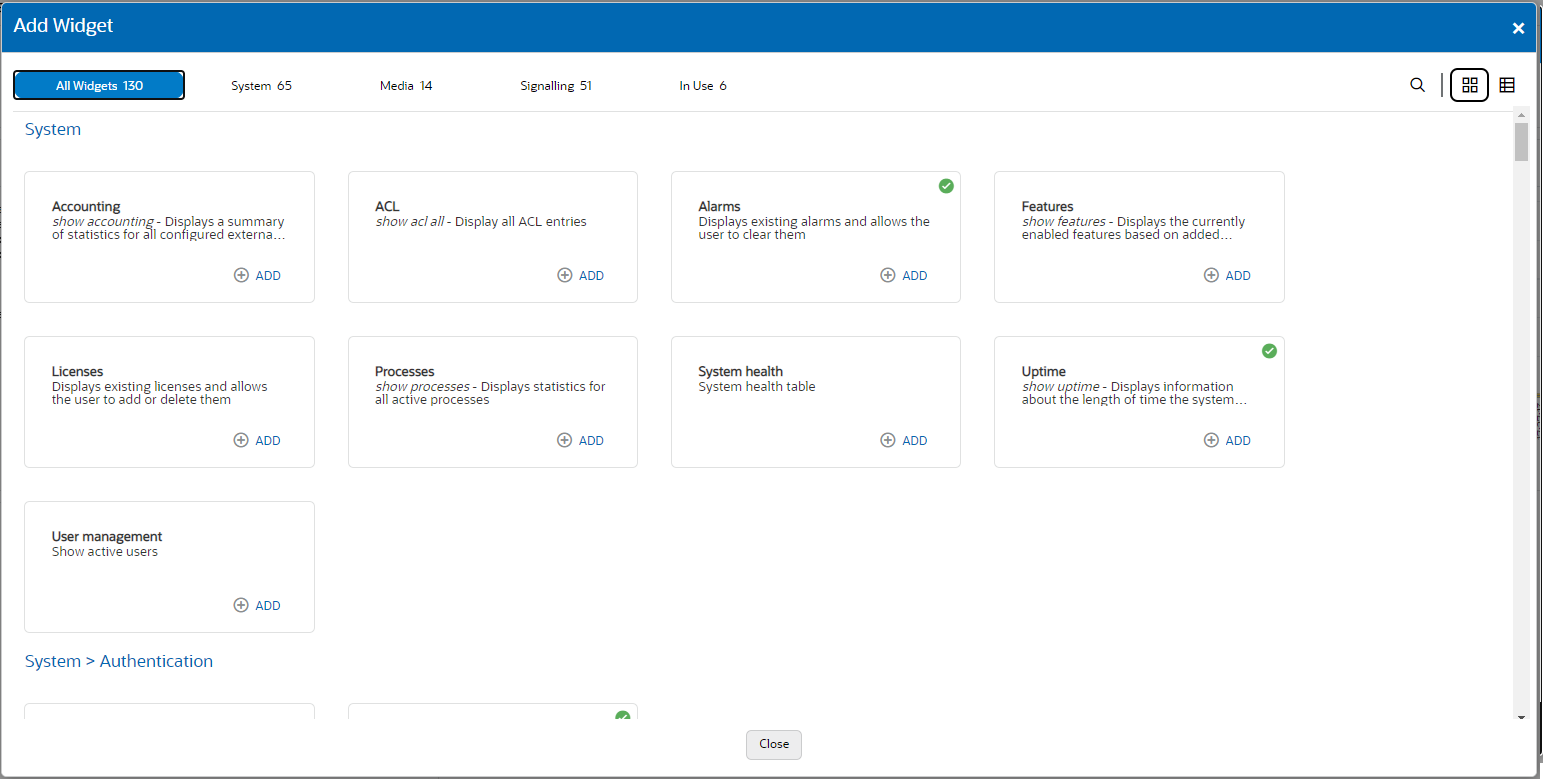
In the top row of the preceding screen capture, the Alarms card and the Licenses card each display a green circle around a check mark. The check mark means that those Widgets currently display on the Dashboard.
The following screen capture shows the list view of the Add Widgets page.
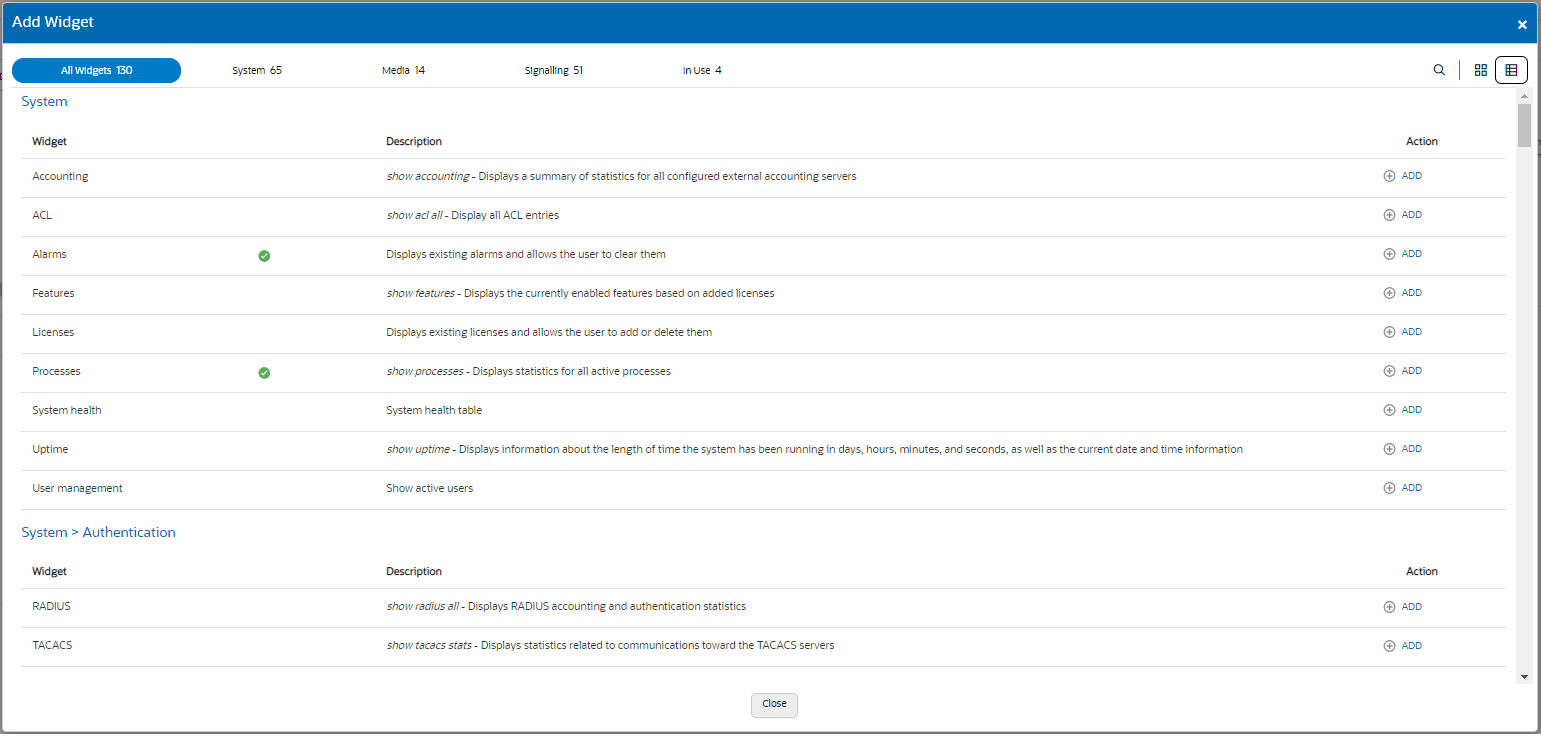
In the preceding screen capture, the Alarms row and the Licenses row each display a green circle around a check mark in the column between the Widget and Description. The check mark means that those Widgets currently display on the Dashboard.
Action Controls on the Banner
 Search—Click to display the Search field, where you enter the name
of a Widget.
 Card view—Click to display the card view.
 List view—Click to display the list view.
 Close—Click to close the Add Widgets page.
Search Filters
 All widgets—Click to see a list of all Widgets in alphabetical
order.
 System—Click to see only a list of System-related Widgets.
 Media—Click to see only a list of Media-related Widgets.
 Signaling—Click to see only a list of Signaling-related
Widgets.
 In Use—Click to see a list of Widgets currently displayed on the
Dashboard.
Note:
All of the lists display a scroll bar when the list exceeds the page space.Add a Dashboard Widget
You can add up to eighteen Widgets to the Web GUI Dashboard to display SIP and System statistics to help you monitor and manage the system.
- See "Configure Data Sampling Settings for a Dashboard Widget."
Configure the Data Sampling Settings for a Dashboard Widget
To display SIP and System statistics on a Dashboard Widget, the system requires a setting for how often to refresh the display. You can use the default interval or select one from the Auto-refresh interval drop-down list on the Widget.
- Confirm that the Widget that you want to configure is on the Dashboard. If not, see Add a Dashboard Widget.
- Click the Dashboard tab.
- On the Widget, hover over the ellipses to display the toolbar, and click the Settings icon.
- Select a Widget display refresh frequency from the Auto-Refresh Interval (seconds) drop down list.
- If the Widget displays the Table Name drop-down list, select a data sampling increment for the Widget display. Valid values: Seconds | Minutes | Hours.
- Click OK.
- Click Close.