7 Widgets Tab Operations
The Web GUI displays the Widgets tab, which you can use to access graphical views of System, Media, and Signaling data about the Oracle® Enterprise Session Border Controller. Each Widget corresponds to an ACLI show command. On the Widgets tab, you can click links to the Widgets for viewing and you can add Widgets to the Dashboard and your Favorites list.
Topics:
Widgets Access and Behavior
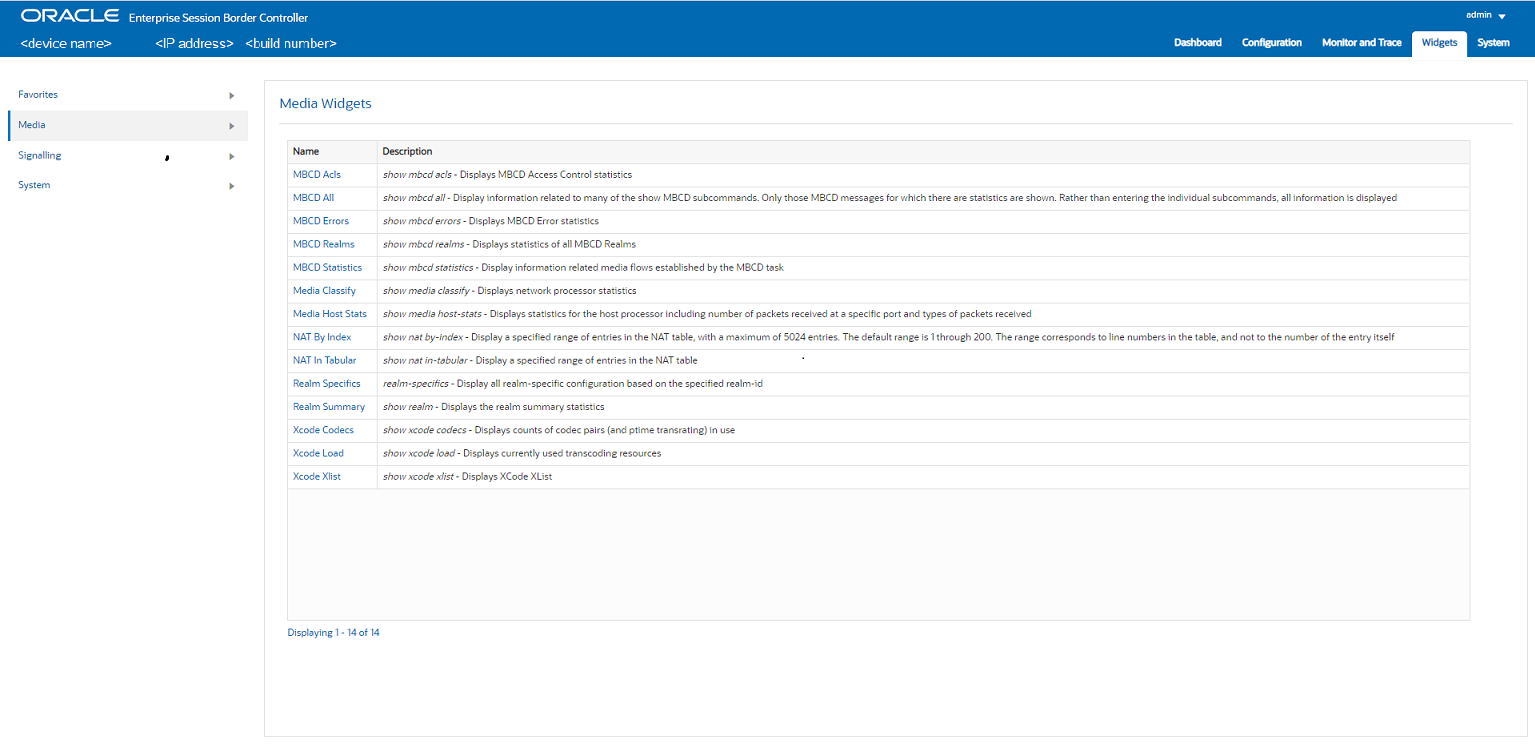
The Widgets tab displays links to the lists of Media, Signaling, and System Widgets in the navigation pane. The navigation pane also includes a link to Favorites, where you can create a list of Widgets that you view often. The center pane displays links to the individual Widgets corresponding to the category link you clicked in the navigation pane. You can click a link in the center pane to see the corresponding data.

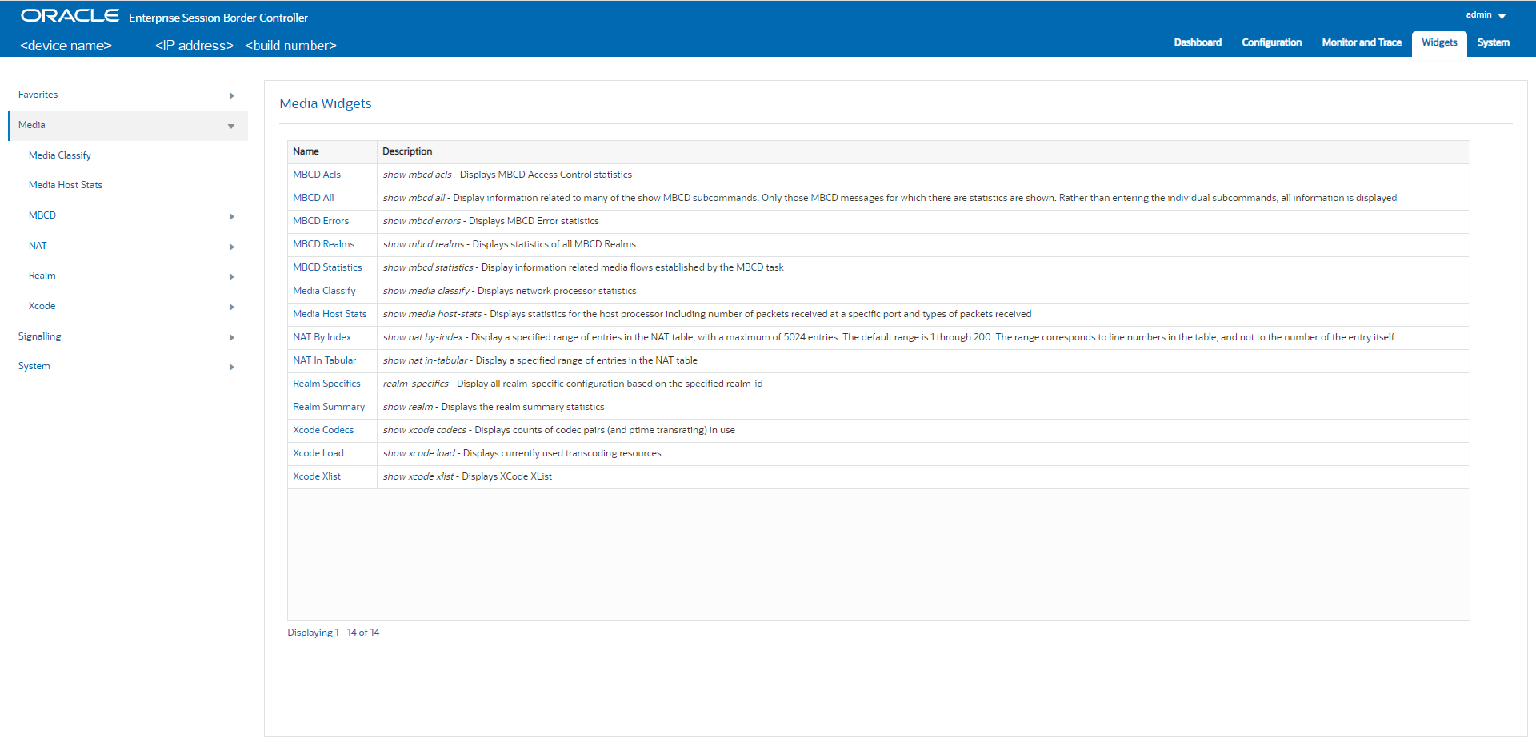
To see the list of Widgets available for a category, click the twister to the right of the category in the navigation pane and the system displays the list. The following screen capture show the Media category expanded to show the list of available Widgets.

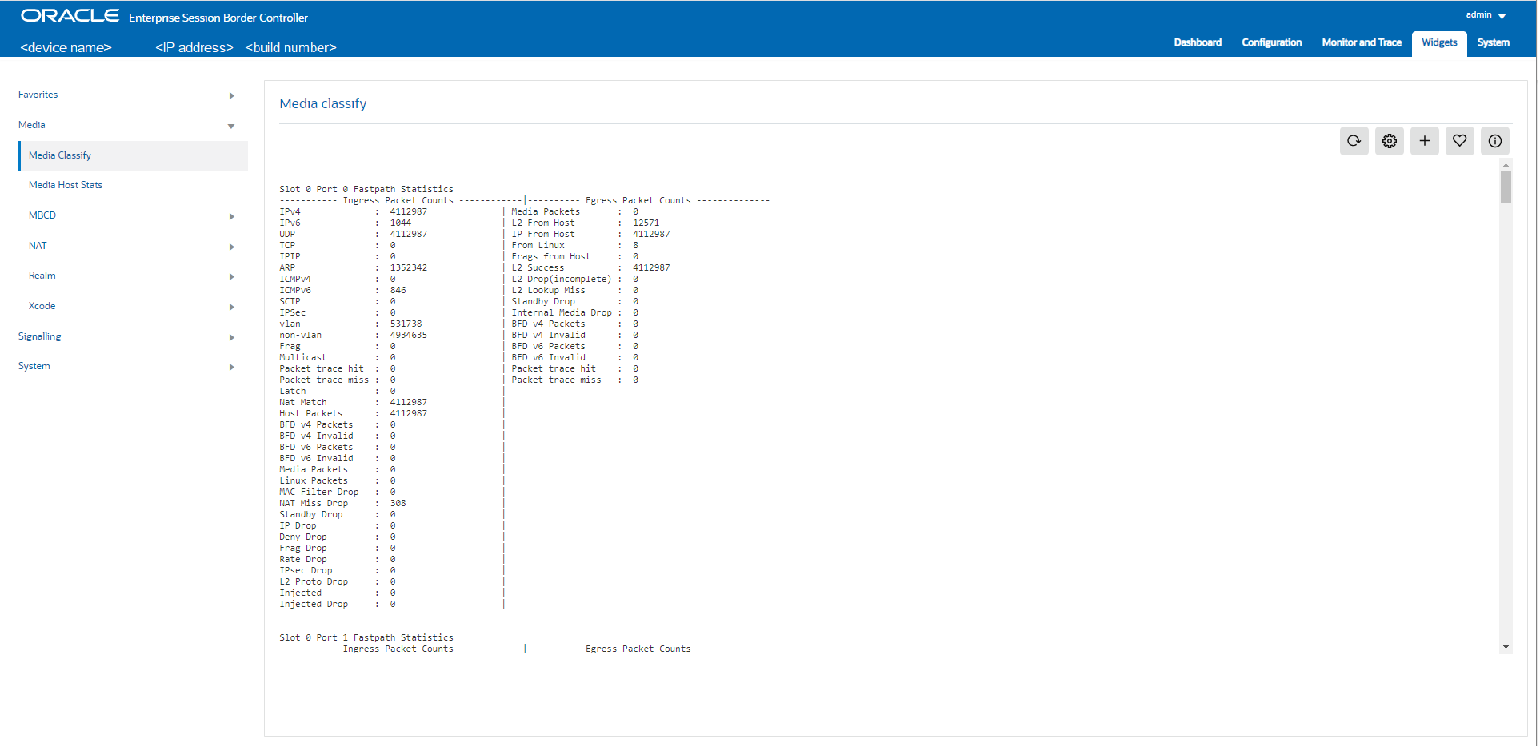
To see the data that a Widget displays, click the Widget in either the navigation pane or the center pane. The system displays the data in the center pane. The following screen capture shows an example of the Media Classify Widget data display.

Each Widget contains the controls that you need to manage the particular Widget, according to the purpose of the Widget. The controls display in the upper right corner of the Widget.

To learn what each control does, hover over the control. The following list describes the Widget controls.
- Refresh—Updates the data in the Widget.
- Settings—Displays the dialog where you set the data sampling parameters for the Widget. When you click the icon, the Widget displays the Settings dialog, where you can set the auto-refresh interval and other parameters that apply to the particular Widget.
- Export—Sends the data to the location you specify.
- Add—Adds this Widget to the Dashboard.
- Favorites—Adds this Widget to your Favorites list in the navigation pane on the Monitor and Trace page.
- Show Information—Describes the data display. For example, in the Current Memory Usage Widget, the information icon says, "Pie graph displays current percentage of free and allocated memory."
Media Widgets and Descriptions
The following table lists all of the Media widgets in the left column. The middle column displays the corresponding ACLI show command. The right column describes the data that the Widget displays.
| Widget | Show Command | Description |
|---|---|---|
| Media Classify | show media classify | Displays network processor statistics. |
| Media Host Stats | show media host-stats | Displays statistics for the host processor, including the number and types of packets received at a specific port. |
| MBCD Acls | show mbcd acls | Displays Middlebox Control Daemon (MBCD) Access Control statistics. |
| MBCD All | show mbcd all | Displays related to many of the show MBCD sub-commands. The widget shows only those MBCD messages that show statistics. |
| MBCD Errors | show mbcd errors | Displays MBCD error statistics. |
| MBCD Realms | show mbcd realms | Displays statistics of all MBCD realms. |
| MBCD Statistics | show mbcd statistics | Displays information related to media flows established by the MBCD task. |
| NAT By Index | show nat by-index | Displays the specified range of entries in the NAT table, with a maximum of 5024 entries. The default range is 1-200. The range corresponds to the line numbers in the table, not to the number of the entry. |
| NAT in Tabular | show nat in-tabular | Displays a specified range of entries in the NAT table. |
| Realm Specifics | realm-specifics | Displays all realm-specific configuration based on the specified realm-id. |
| Realm Summary | show realm | Displays the realm summary statistics. |
| Xcode Codecs | show xcode codecs | Displays counts of codec pairs and ptime transrating in use. |
| Xcode Load | show xcode load | Displays the transcoding resources in use. |
| Xcode Xlist | show xcode xlist | Displays the XCode Xlist. |
Signaling Widgets and Descriptions
The following table lists all of the Signaling widgets in the left column. The middle column displays the corresponding ACLI show command. The right column describes the data that the Widget displays.
| Widget | Show Command | Description |
|---|---|---|
| DNS | show dns | Displays statistics for the DNS configuration. |
| ENUM | show enum | Displays ENUM statistics. |
| Fraud Protection All | show fraud-protection all | Displays all Fraud Protection entries. |
| Fraud Protection Blocklist | show fraud-protection blocklist | Displays the Fraud Protection blocklist entries. |
| Fraud Protection Rate limit | show fraud-protection rate limit | Displays the Fraud Protection rate limit list entries. |
| Fraud Protection Re-direct | show fraud-protection redirect | Displays the Fraud Protection redirect list entries. |
| Fraud Protection Allowlist | show fraud-protection allowlist | Displays the Fraud Protection allowlist entries. |
| Fraud Protection All Matches | show fraud-protection all matches-only | Displays the Fraud Protection match-only entries. |
| Fraud Protection Blocklistlist Matches | show fraud-protection blocklist matches-only | Displays the Fraud Protection blocklist match-only entries. |
| Fraud Protection Rate Limit Matches | show fraud-protection rate limit matches-only | Displays the Fraud Protection rate limit match-only entries. |
| Fraud Protection Redirect Matches | show fraud-protection redirect matches-only | Displays the Fraud Protection redirect match-only entries. |
| Fraud Protection Allowlist Matches | show fraud-protection allowlist matches-only | Displays the Fraud Protection allowlist match-only entries. |
| Fraud Protection Summary | show fraud-protection stats | Displays the Fraud Protection summary. |
| H323d | show h323d | Displays H323 statistics. |
| LDAP | show ldap | Displays LDAP statistics. |
| LRT | show lrt | Displays the Local Routing Table statistics. |
| Recording | show rec | Displays SIP REC statistics for the Recording Agent. |
| Registration by Realm | show registration sipd by realm | Displays calls that registered through a specified ingress realm for which you want to view cache information. |
| Registration H323 d | show registration h323d | Displays H323d registrations. |
| Registration SIP | show registration SIP | Displays SIP registrations. |
| Registration Statistics | show registration statistics | Displays a table of counters showing the total and periodic number of registrations by protocol. |
| Sessions | show sessions | Displays the session capacity for license and session use. |
| Agent Details | show sipd agents | Displays statistics related to defined DIP session agents. |
| Agent Groups | show sipd groups | Displays cumulative information for all session agent groups. |
| Agent Individual | show sipd agents <agent name> | Displays statistics related to the specified SIP session agent. |
| Client Trans | show sipd client | Displays statistics for SIP client events when the SBC is acting as a SIP client in the B2BUA role. |
| SIP Codecs | show sipd codecs | Displays codec usage for a realm. |
| SIP Errors | show sipd errors | Displays statistics for SIP media event errors. |
| Interface Individual | show sipd interface | Displays SIP interface statistics for the specified realm. |
| Interface Summary | show sipd interface | Displays all SIP interface statistics. |
| Method Ack | show sipd ack | Displays all SIP ACK method statistics. |
| Method Bye | show sipd bye | Displays the SIP BYE method statistics. |
| Method Cancel | show sipd cancel | Displays all SIP CANCEL method statistics. |
| Method Info | show sipd info | Displays the SIP INFO method statistics. |
| Method Invite | show sipd invite | Displays the SIP INVITE method statistics. |
| Method Message | show sipd message | Displays the SIP MESSAGE statistics. |
| Method Notify | show sipd notify | Displays the SIP NOTIFY statistics. |
| Method Options | show sipd options | Displays the SIP OPTIONS statistics. |
| Method Prack | show sipd prack | Displays the SIP PRACK method statistics. |
| Method Publish | show sipd publish | Displays the SIP PUBLISH method statistics. |
| Method Refer | show sipd refer | Displays the SIP REFER method statistics. |
| Method Register | show sipd register | Displays the SIP REGISTER method statistics. |
| Method Subscribe | show sipd SUBSCRIBE | Displays the SIP SUBSCRIBE method statistics. |
| Method Update | show sipd update | Displays the SIP UPDATE method statistics. |
| SIP Realms All | show sipd realms | Displays realm statistics related to SIP processing. |
| SIP Realms Individual | show sipd realms <realm name> | Displays realm statistics related to SIP processing for the specified realm. |
| SIP Redundancy | show sipd redundancy | Displays information about SIP redundancy. |
| Server Trans | show sipd server | Displays statistics for SIP server events when the SBC acts as a SIP server in the B2BUA role. |
| SIP Sessions All | show sipd sessions all | Displays all SIP sessions currently on the system. |
| SIP Sessions | show sipd sessions | Displays the number of sessions and dialogs in various states for the Period and Lifetime spans. |
| SIP Status | show sipd status | Displays information about SIP transactions. |
System Widgets and Descriptions
The following table lists all of the System widgets in the left column. The middle column displays the corresponding ACLI show command, when there is one. The right column describes the data that the Widget displays.
| Widget | Show Command | Description |
|---|---|---|
| Accounting | show accounting | Displays a summary of statistics for configured external accounting servers. |
| ACL | show acl all | Displays cumulative and per-interface statistics on ACL traffic and drops, displaying Recent, Total, and PerMax counts. The display also separates traffic from trusted from untrusted sites. |
| Alarms | show alarms | Displays existing alarms and allows you to clear them. |
| Authentication RADIUS | show radius all | Displays the status of established RADIUS accounting connections. |
| Authentication TACACS | show tacacs stats | Displays statistics related to communications between the ESBC and configured TACACS servers . |
| Communications Monitor Errors | show comm-monitor errors | Displays Communications Monitor aggregate error statistics information. |
| Communications Monitor Internal | show comm-monitor internal | Displays Communications Monitor aggregate internal statistics information. |
| Communications Monitor Stats | show comm-monitor stats | Displays statistics related to connections between the ESBC Communications Monitor probe and any configured Communications Monitor servers. |
| Editing Configuration | show configuration | Displays the current editing configuration. |
| Editing Configuration Short | show configuration short | Displays only the parameters that you modified in the editing configuration. |
| Configuration Inventory | show configuration inventory | Displays the editing and running configuration inventory of all configured elements. |
| Running Configuration | show running-config | Displays the current running configuration. |
| Running Configuration Short | show running-config short | Displays only the parameters that you modified in the running configuration. |
| Configuration Version | show version | Displays the configuration version number table. |
| Highest Task CPU Usage | No show command | Displays a line graph with 5-10 tasks with the highest CPU usage in percent, during a specific period of time. |
| Highest Task CPU Usage | No show command | Displays a table with 5-10 tasks with the highest CPU usage in percent, during a specific period of time. |
| Current Disk Usage Pie Graph | No show command | Displays the current disk usage in a pie graph. |
| Current Disk Usage Table | No show command | Displays the current disk usage in a table. |
| Features | show features | Displays the features that are currently enabled, based on added licenses. |
| Interfaces | show interfaces | Displays all of the information concerning the rear interfaces. |
| Interfaces Brief | show interfaces brief | Displays key running statistics about the rear interfaces in one graphic. |
| Interface Mapping | show interface mapping | Displays the configured physical interfaces with their MAC addresses and label. |
| Virtual Interfaces | show virtual interfaces | Displays the virtual interfaces for signaling services. |
| Wancom | show Wancom | Displays negotiated duplex mode and speed for all system control interfaces. |
| ARP Info | show arp info | Displays the current Internet-to-Ethernet address mappings in the ARP table. |
| ARP Statistics | show arp statistics | Displays ARP statistics. |
| ARP Summary | show arp | Displays the current Internet-to-Ethernet address mappings in the ARP table. |
| IP Connections | show ip connections | Displays all TCP and UDP connections. |
| Neighbor Table | show neighbor table | Displays the IPv6 neighbor table and validates that an entry for the link local address exists and that the gateway uses that MAC address. |
| Routes | show routes | Displays the current system routing table. |
| IP Summary | show ip | Displays IP statistics. |
| IP TCP | show ip tcp | Displays all TCP statistics. |
| IP UDP | show ip udp | Displays all UDP statistics. |
| Licenses | license | Displays existing licenses and allows you to add or delete them. |
| Current Memory Usage | No show command | Displays the current percentage of free and allocated memory in a pie graph. |
| Current Memory Usage | No show command | Displays the current percentage of free and allocated memory in a table. |
| Historical Memory Usage | No show command | Displays a line graph of the kilobytes of free and allocated memory over a period of time. |
| Historical Memory Usage | No show command | Displays a table of the kilobytes of free and allocated memory over a period of time. |
| Memory Summary | show memory | Displays statistic related to the memory. |
| Platform All | show platform all | Displays full platform information. |
| Platform CPU load | show platform cpu-load | Displays current CPU load. |
| Platform Errors | show platform errors | Displays service pipe write errors. |
| Platform Limits | show platform limits | Displays platform related limits. |
| PROM Info | show prom info all | Displays all available PROM information. |
| Temperature | show temperature | Displays the temperature in Celsius for all components with temperature sensors. |
| Processes | show processes | Displays statistics for all active processes. |
| SNMP Community Table | show snmp-community-table | Displays all information for configured SNMP communities including requests and responses for each community. |
| Trap Receiver | show trap-receiver | Displays trap receiver information for each configured SNMP community. |
| SPL Memory | show spl memory | Displays SPL memory for each task SPL engine. |
| SPL Options | show spl-options | Displays information on all SPL options. |
| SPL Statistics | show spl statistics | Displays statistics for all tasks. |
| SPL Version | show spl | Displays the version of the SPL engine. |
| System Health | show health | Displays the system health table for HA pairs. |
| TDM Channels | show tdm channels | Displays the TDM b and d channel configurations. |
| TDM Dialplan | show tdm dialplan | Displays the TDM dial plan configuration. |
| TDM Spans | show tdm spans | Displays the TDM spans configuration. |
| TDM Status | show tdm status | Displays the status of TDM operations. |
| Clock | show clock | Displays the current date and time. |
| NTP Server | show ntp server | Displays information about the quality of the time used for offset and the delay measurement maximum error bounds. |
| NTP Status | show ntp status | Displays information about configuration status, NTP daemon synchronization, NTP synchronization in process, and if NTP is not responding. |
| Time Zone | show timezone | Displays the time zone. |
| Clock UTC | show clock utc | Displays the current date and time in Coordinated Universal Time (UTC). |
| Uptime | show uptime | Displays information about the length of time the system has been running in days, hours, and seconds. Also displays the current date and time information. |
| User Management | show users | Displays a table that lists all users currently logged on to the system. |
| Version Boot | show version boot | Displays the boot version. |
| Version CPU | show version cpu | Displays the CPU version. |
| Version Hardware | show version hardware | Displays the hardware version. |
| Version Image | show version image | Displays the image version. |
| Version Summary | show version | Displays the Operating System version information, including the OS version number, the manufacturing date of the current version, and other details. |
Licenses Widget
The Licenses widget on the Web GUI provides a workspace where you can view, add, and delete Oracle® Enterprise Session Border Controller (ESBC) licenses.
On the Widgets tab, click System and then click Licenses. The following screen capture shows and example of the Licenses page, which displays the license name, the entitled number of sessions, the installation date, the begin date, and the expire date.

The License widget includes the same toolbar in the top, right-hand corner that Widgets on the Dashboard display. Note that the License widget does not include the Settings icon and the Auto-refresh function because these operations do not apply to licenses.
| License | The name of the license. |
| Session Count | The number of session entitlements for the license. |
| Install Date | The date when the license is added to the system. |
| Begin Date | The date when the license begins service. |
| Expire Date | The date when the license ends service. |
If you want to see the details of a particular license, click the twister by the license name to expand the view to show all of the details, which display in text below the selected license. The text states the number of allowed sessions and lists all of the features included in the license. The following screen capture shows an example of license details.

When you click License, the system displays the License dialog, where you enter the license serial number.

When you select a license from the Licenses list and click the delete icon, the system displays the delete Confirmation dialog.
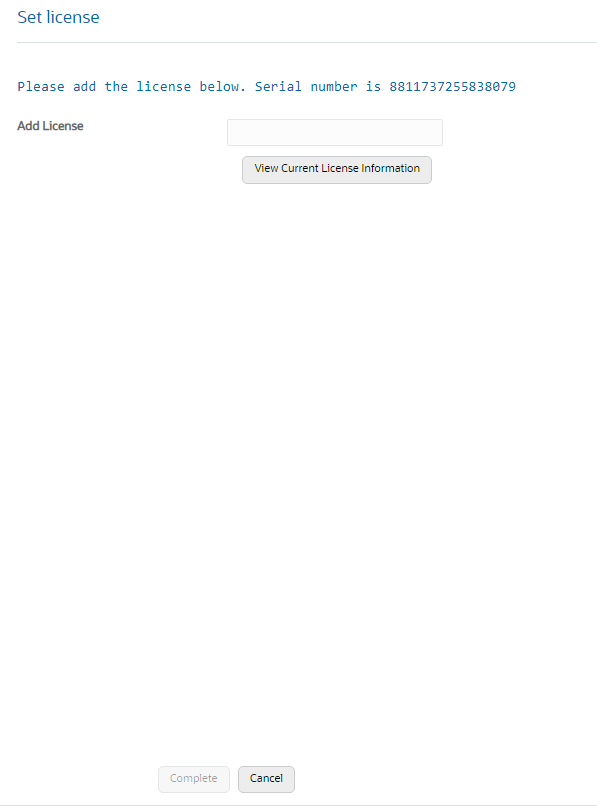
The Set License function, located under System Operations on the System tab, links to the License widget so you can view your licenses from the Set License dialog. After launching Set License, use the "View current license information" button in the Set License dialog to see a view-only list of your ESBC licenses.
The only operations allowed in view mode are Refresh and Download.