Dashboard Tab Operations
The Oracle Enterprise Communications Broker (ECB) provides a web-based Dashboard that can display SIP data statistics in Widgets to help you monitor and manage the system. The ECB collects only SIP data for the Dashboard Widgets, including the default CPU and Memory Widgets. For this reason, you must set up a valid SIP configuration before the ECB can display any data on a Dashboard Widget.
- Highest CPU Usage
- Current Memory Usage
- Historical Memory Usage
- Alarms
The Dashboard page provides the following controls:
Figure 4-22 Dashboard

- Refresh—Updates the data in all of the Widgets on the Dashboard.
- Reset—Resets the Dashboard to display the default Widgets and removes all other Widgets from the Dashboard.
- Widgets drop down —
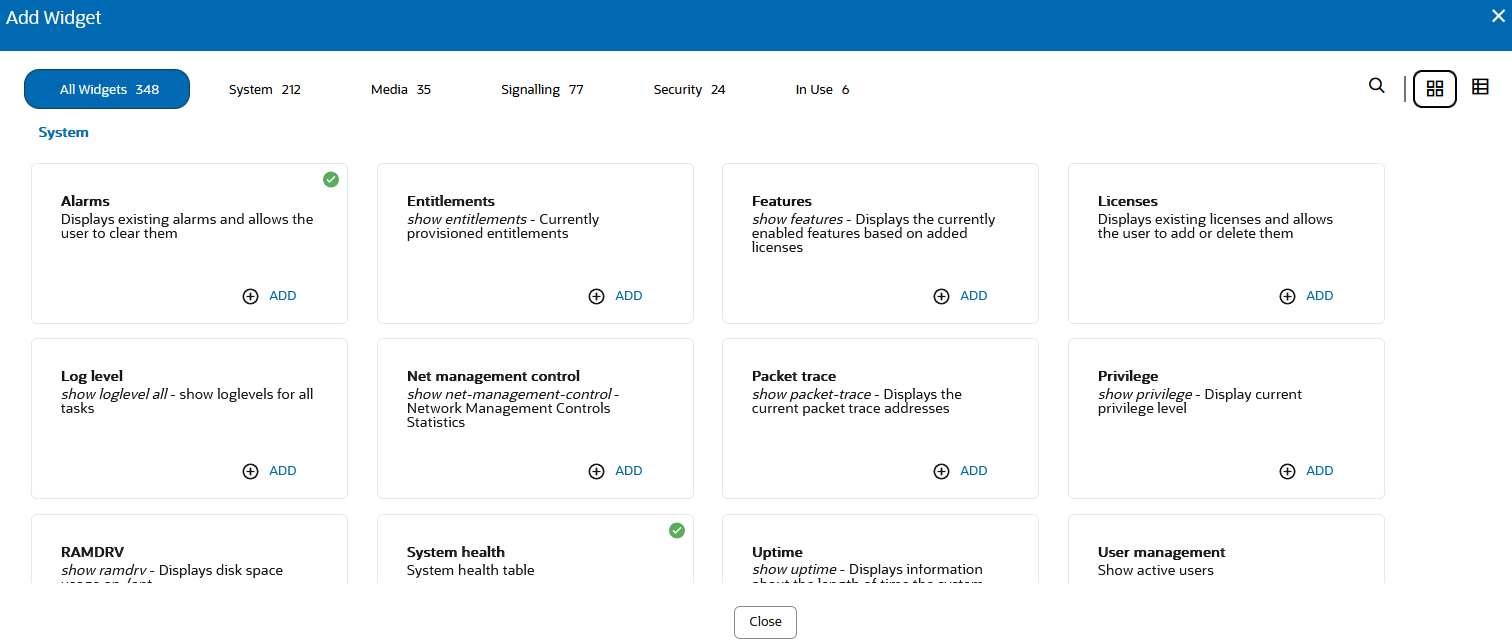
- Add a Widget - Displays a list of Widgets that you can add to the Dashboard.
- Upload Widgets - Upon upload, the system backs up your existing
widgets file to
/code/dashboardand updates your Dashboard with the new file. - Download All Widgets - Downloads Widgets to
settings-admin.xml.
A Widget can display a table, text, a pie graph, or a line graph depending on the type of data and the purpose of the display. For example, the SIP Realms All widget displays an actionable table and the Recording widget displays static text. You can access the list of widgets from either the navigation pane on the Monitor and Trace tab or from the Dashboard page by clicking Add Widget.
Most of the Widgets automatically display any available data when you click the name of the Widget, but some Widgets require further input. Such Widgets include a Settings button in their display that launches a parameters dialog were you specify the data to display. For example, the Realm Specifics Widget requires you to set the name of the realm and the auto refresh interval.
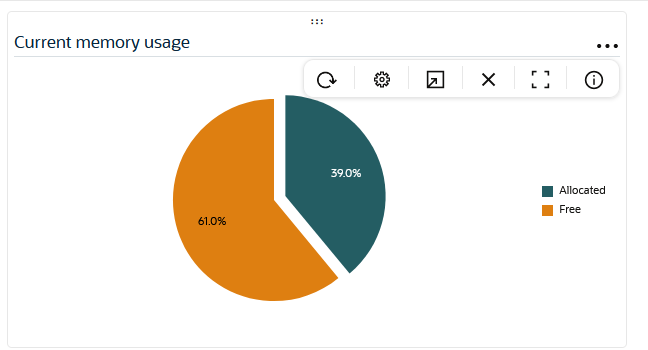
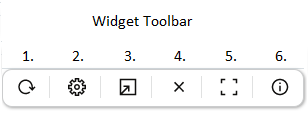
Each Widget contains the controls that you need to manage the particular Widget, according to the purpose of the Widget. The controls display when you hover over the three elipses in the upper right corner of the Widget. The following screen capture shows an example of the tool bar that displays in a Widget.
Figure 4-23 Manage Widget

To learn what each control does, hover over the control.

- Refresh—Updates the data in the Widget.
- Settings—Displays the dialog where you set the data sampling parameters for the Widget. When you click the icon, the Widget displays the Settings dialog, where you can set the auto-refresh interval and other parameters that apply to the particular Widget.
- Export—Downloads the data displayed in the Widget.
- Remove—Removes the Widget from the Dashboard. When you remove all Widgets from the Dashboard, the GUI displays the following message: " Your Dashboard is empty, please add a Widget or reset to restore the original Dashboard."
- Maximize—Displays the Widget in full-screen size.
- Show Information—Describes the data display. For example, in the Current Memory Usage Widget, the information icon says, "Pie graph displays current percentage of free and allocated memory."
Note:
The operation of Widgets, such as those that require the SIP Session module, may affect system performance. The system displays a warning when you add a Widget that may affect performance. Oracle recommends adding such Widgets at a time when the performance impact will not degrade service.Add a Widget to the Dashboard
You can add up to eighteen Widgets to the Web GUI Dashboard to display SIP and System statistics to help you monitor and manage the system.
The system does not require a re-boot after performing the following procedure. The system adds the Widget to the Dashboard right away.
Configure the Data Sampling Settings for a Dashboard Widget
To display SIP and System statistics on a Dashboard Widget, the system requires a setting for how often to refresh the display. You can use the default interval or select one from the Auto-refresh interval drop-down list on the Widget.
- Confirm that the Widget that you want to configure is on the Dashboard. If not, see Add a Dashboard Widget.
- Click the Dashboard tab.
- On the Widget, hover over the ellipses to display the toolbar, and click the Settings icon.
- Select a Widget display refresh frequency from the Auto-Refresh Interval (seconds) drop down list.
- If the Widget displays the Table Name drop-down list, select a data sampling increment for the Widget display. Valid values: Seconds | Minutes | Hours.
- Click OK.
- Click Close.
