Event Compression Policies
Event Compression Policies serve as a noise reduction mechanism by identifying the condition under which multiple correlated events are grouped together, or compressed, in one incident. These are global policies that apply to all incident-creating rules and are enabled by default. With Event Compression, you can reduce the overall volume of incidents to a more meaningful and manageable set.
Event Compression Policies
There are several out-of-box policies that collectively represent recommended ways in which related events should be compressed together into a single incident. These Event Compression Policies work with your incident rule sets to compress related events into a single incident. An event rule specifies a set of events and an action that should be taken in case any of the events occur, such as create an incident for the event. Without event compression, when the event occurs, an incident will be created for each event, potentially resulting in a larger number of incidents. The event rule now has an option, as part of the create incident action, to use Event Compression Policies. With this option enabled, before an incident is created, Enterprise Manager will locate an Event Compression Policy that is applicable to the set of events in the event rule and then compress the events into a single incident based on that policy. New rules that have actions to create incidents will automatically be configured to use Event Compression Policies.
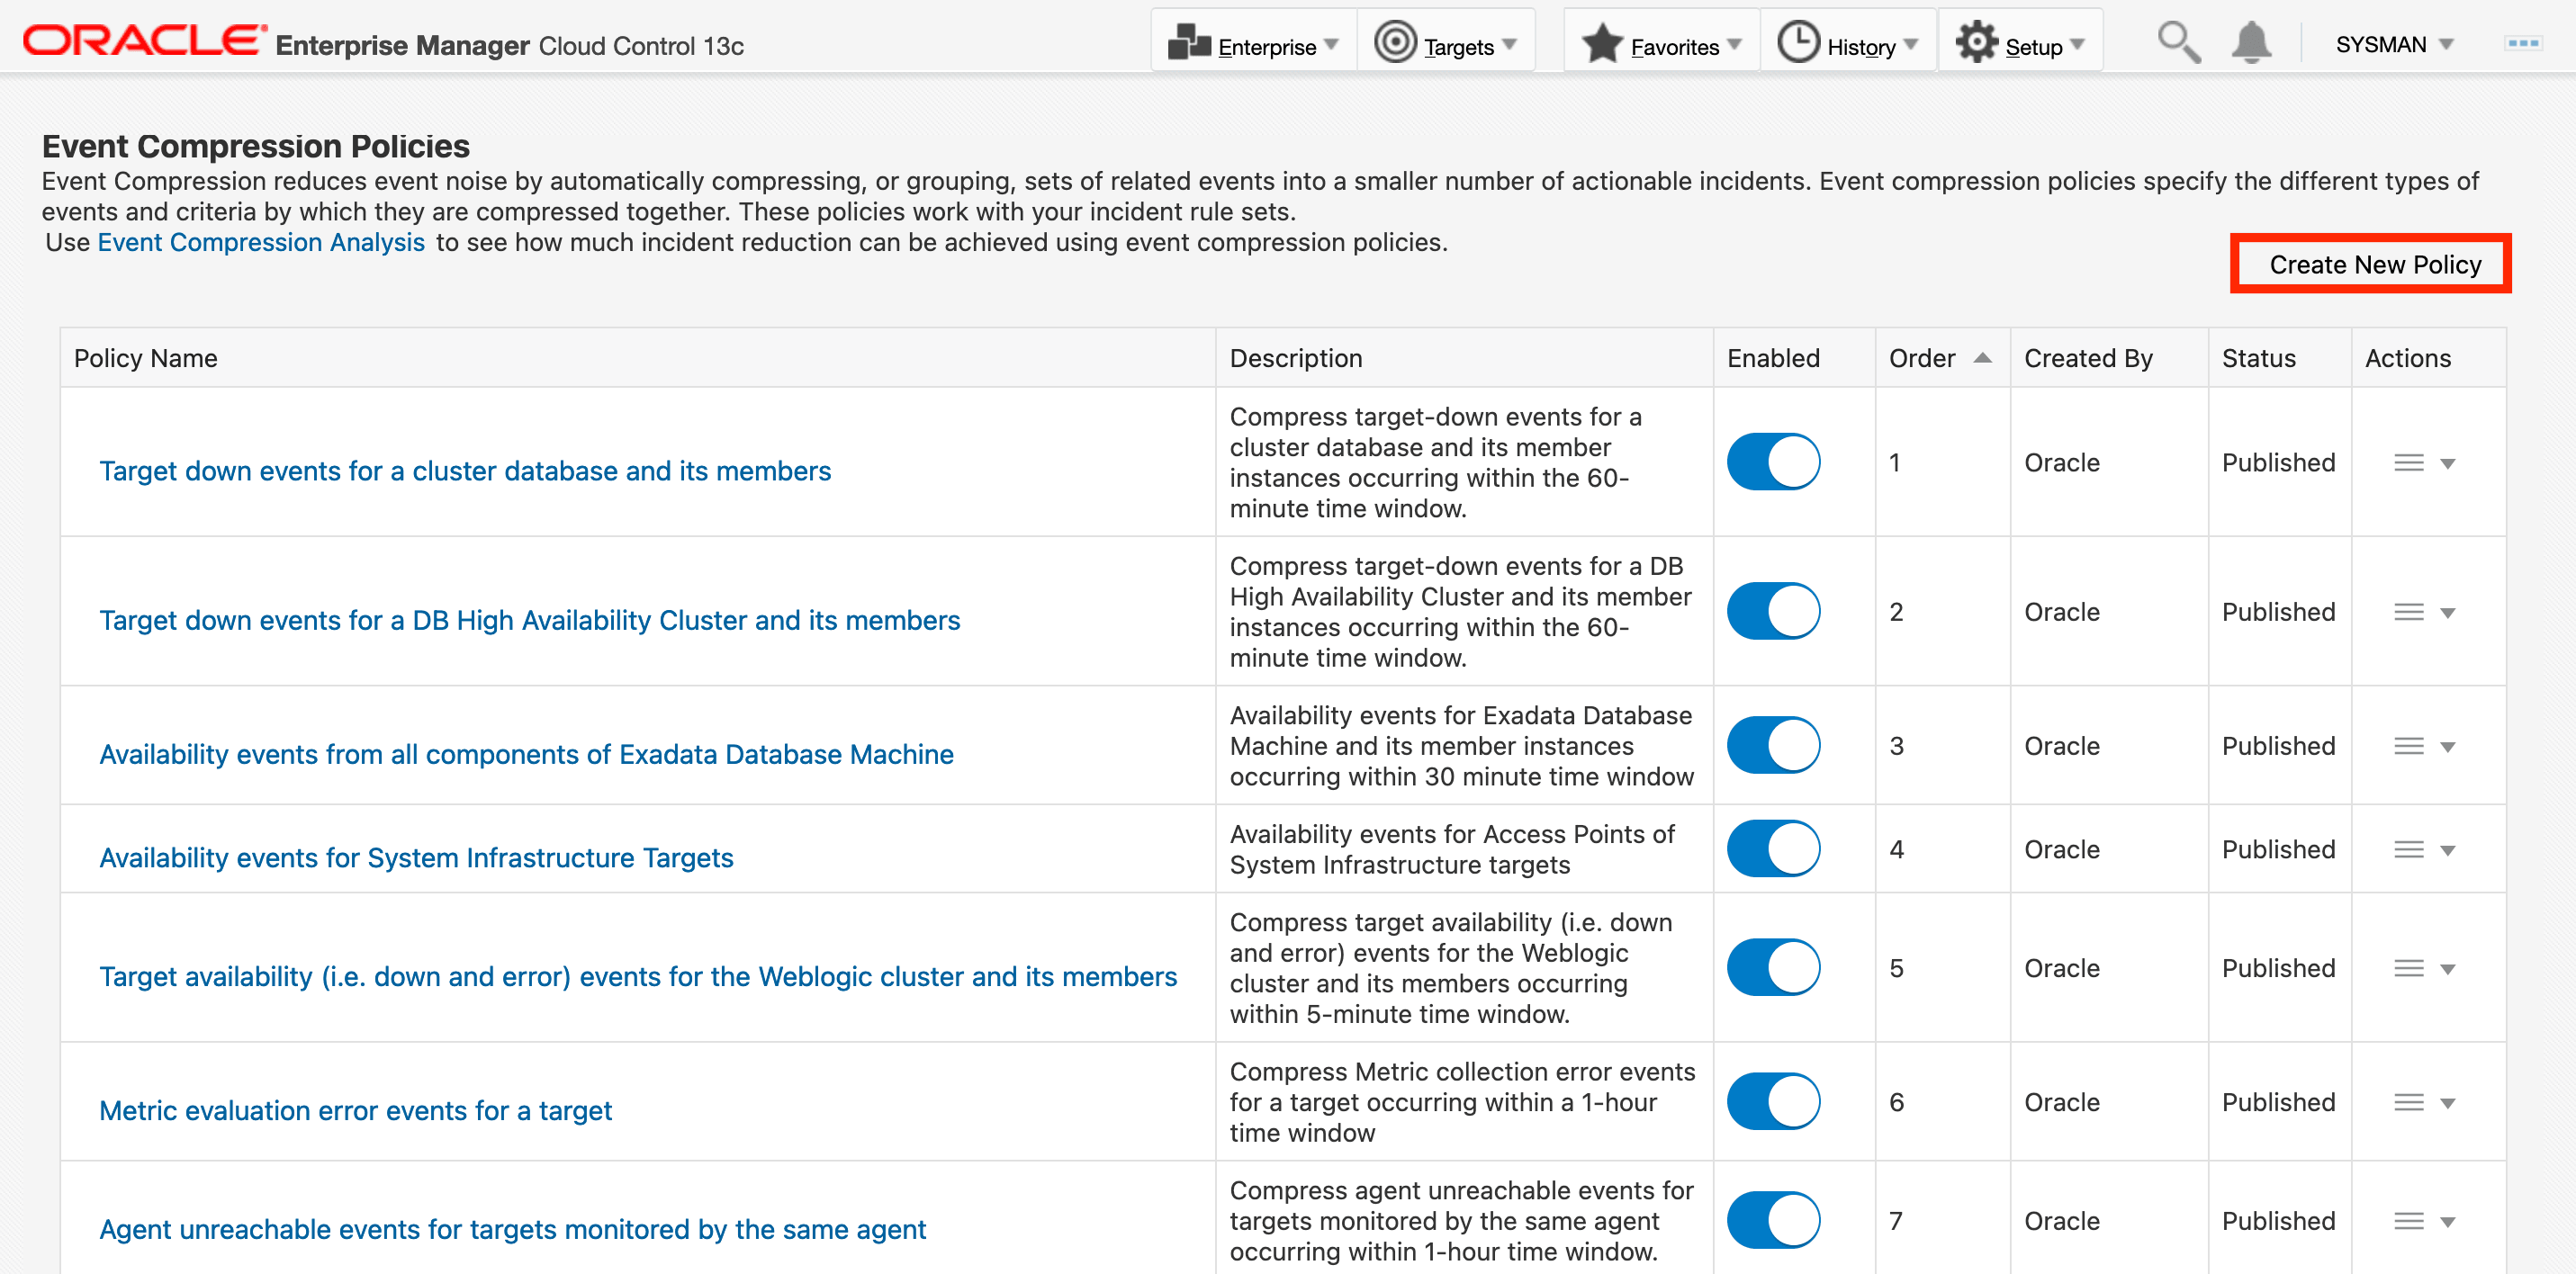
To access these policies and the controls that enable/disable them, from the Enterprise Manager console, click Setup, select Incidents, and then Event Compression Policies. The Event Compression Policies page displays as shown below.
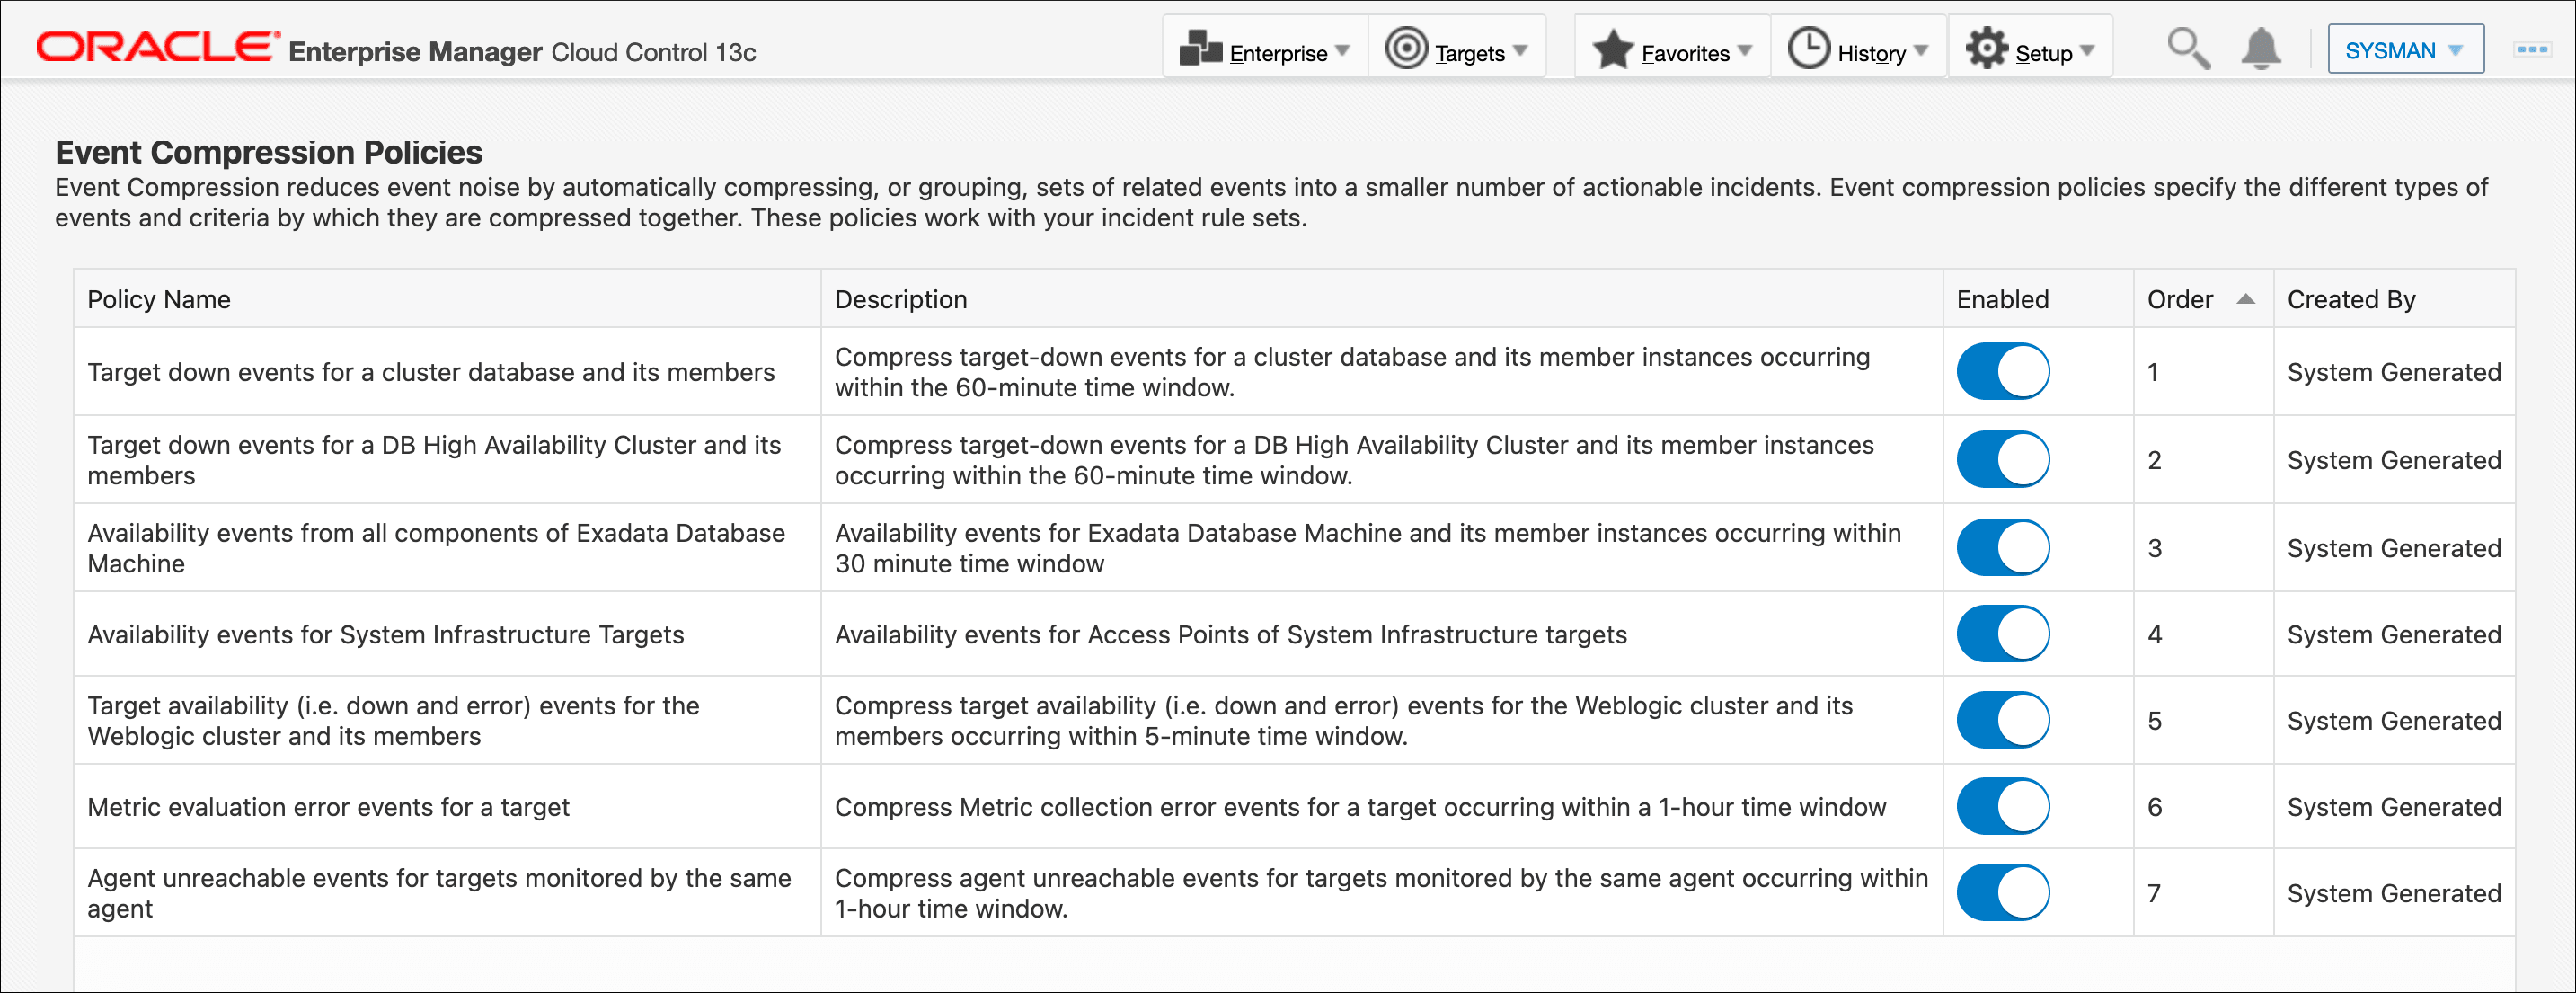
Alternatively, you can also access the Event Compression Policies page directly from the Incident Rules page.
- From the Enterprise Manager console, click Setup, then select Incidents and then Incident Rules.
- In the banner area at the top, click View Event Compression
Policies.

These compression policies provide for common event scenarios and contain logic that defines the following:
- The events that should be compressed based on the target types and/or particular attributes of the events, e.g., event type or severity
- The conditions by which they are compressed/grouped
- The time window within which the events should have occurred in order to be compressed
- The format of the message that the compressed incident uses when it is in a non-clear state and when it is in a clear state
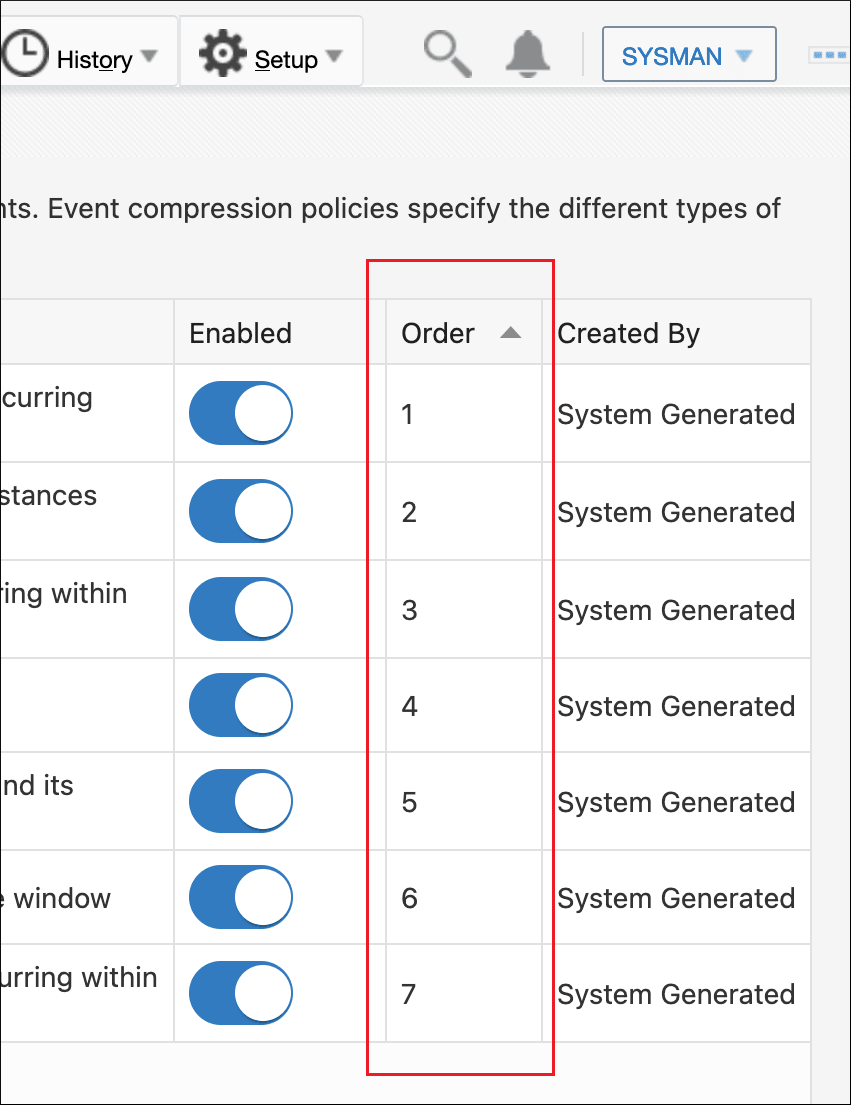
Event Compression policies are evaluated from top down, with the top having higher priority (Order). The evaluation order is the sequence in which policies will be executed to match to a rule.
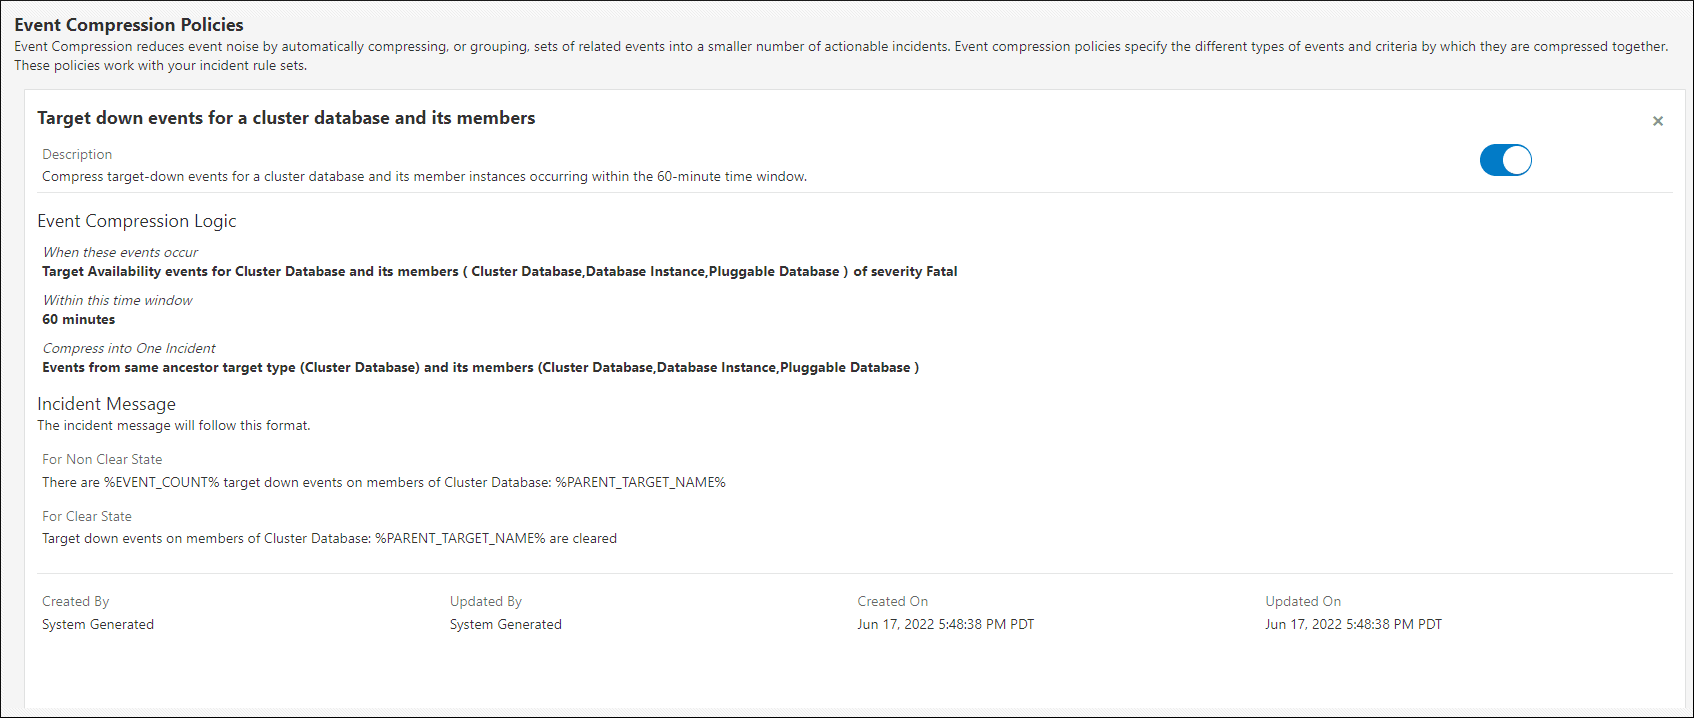
You can view a policy's compression logic and incident messaging by clicking on the desired policy to display the policy's detail page. In the following example, the policy details page shows that target-down events for a cluster database and its members, that have a severity of fatal and that have occurred within a 60-minute window, will be compressed into a single incident. The format of the incident message will be as follows:
- Non-clear State: There are %EVENT_COUNT% target down events on members of Cluster Database: %PARENT_TARGET_NAME%
- Clear State: Target down events on members of Cluster Database: %PARENT_TARGET_NAME% are cleared
User-defined Event Compression Policies
Available in Enterprise Manager 13c Release 5 Update 13 and later, there is now the option to create a user-defined event compression policy. This means you can now also author your own policies that will apply to all incident-creating rules.
Note:
To create, update, or delete a user-defined event compression policy, you must have the Enterprise Rule Set resource privilege.
- Click Create New Policy.
The Create Compression Policy region displays.
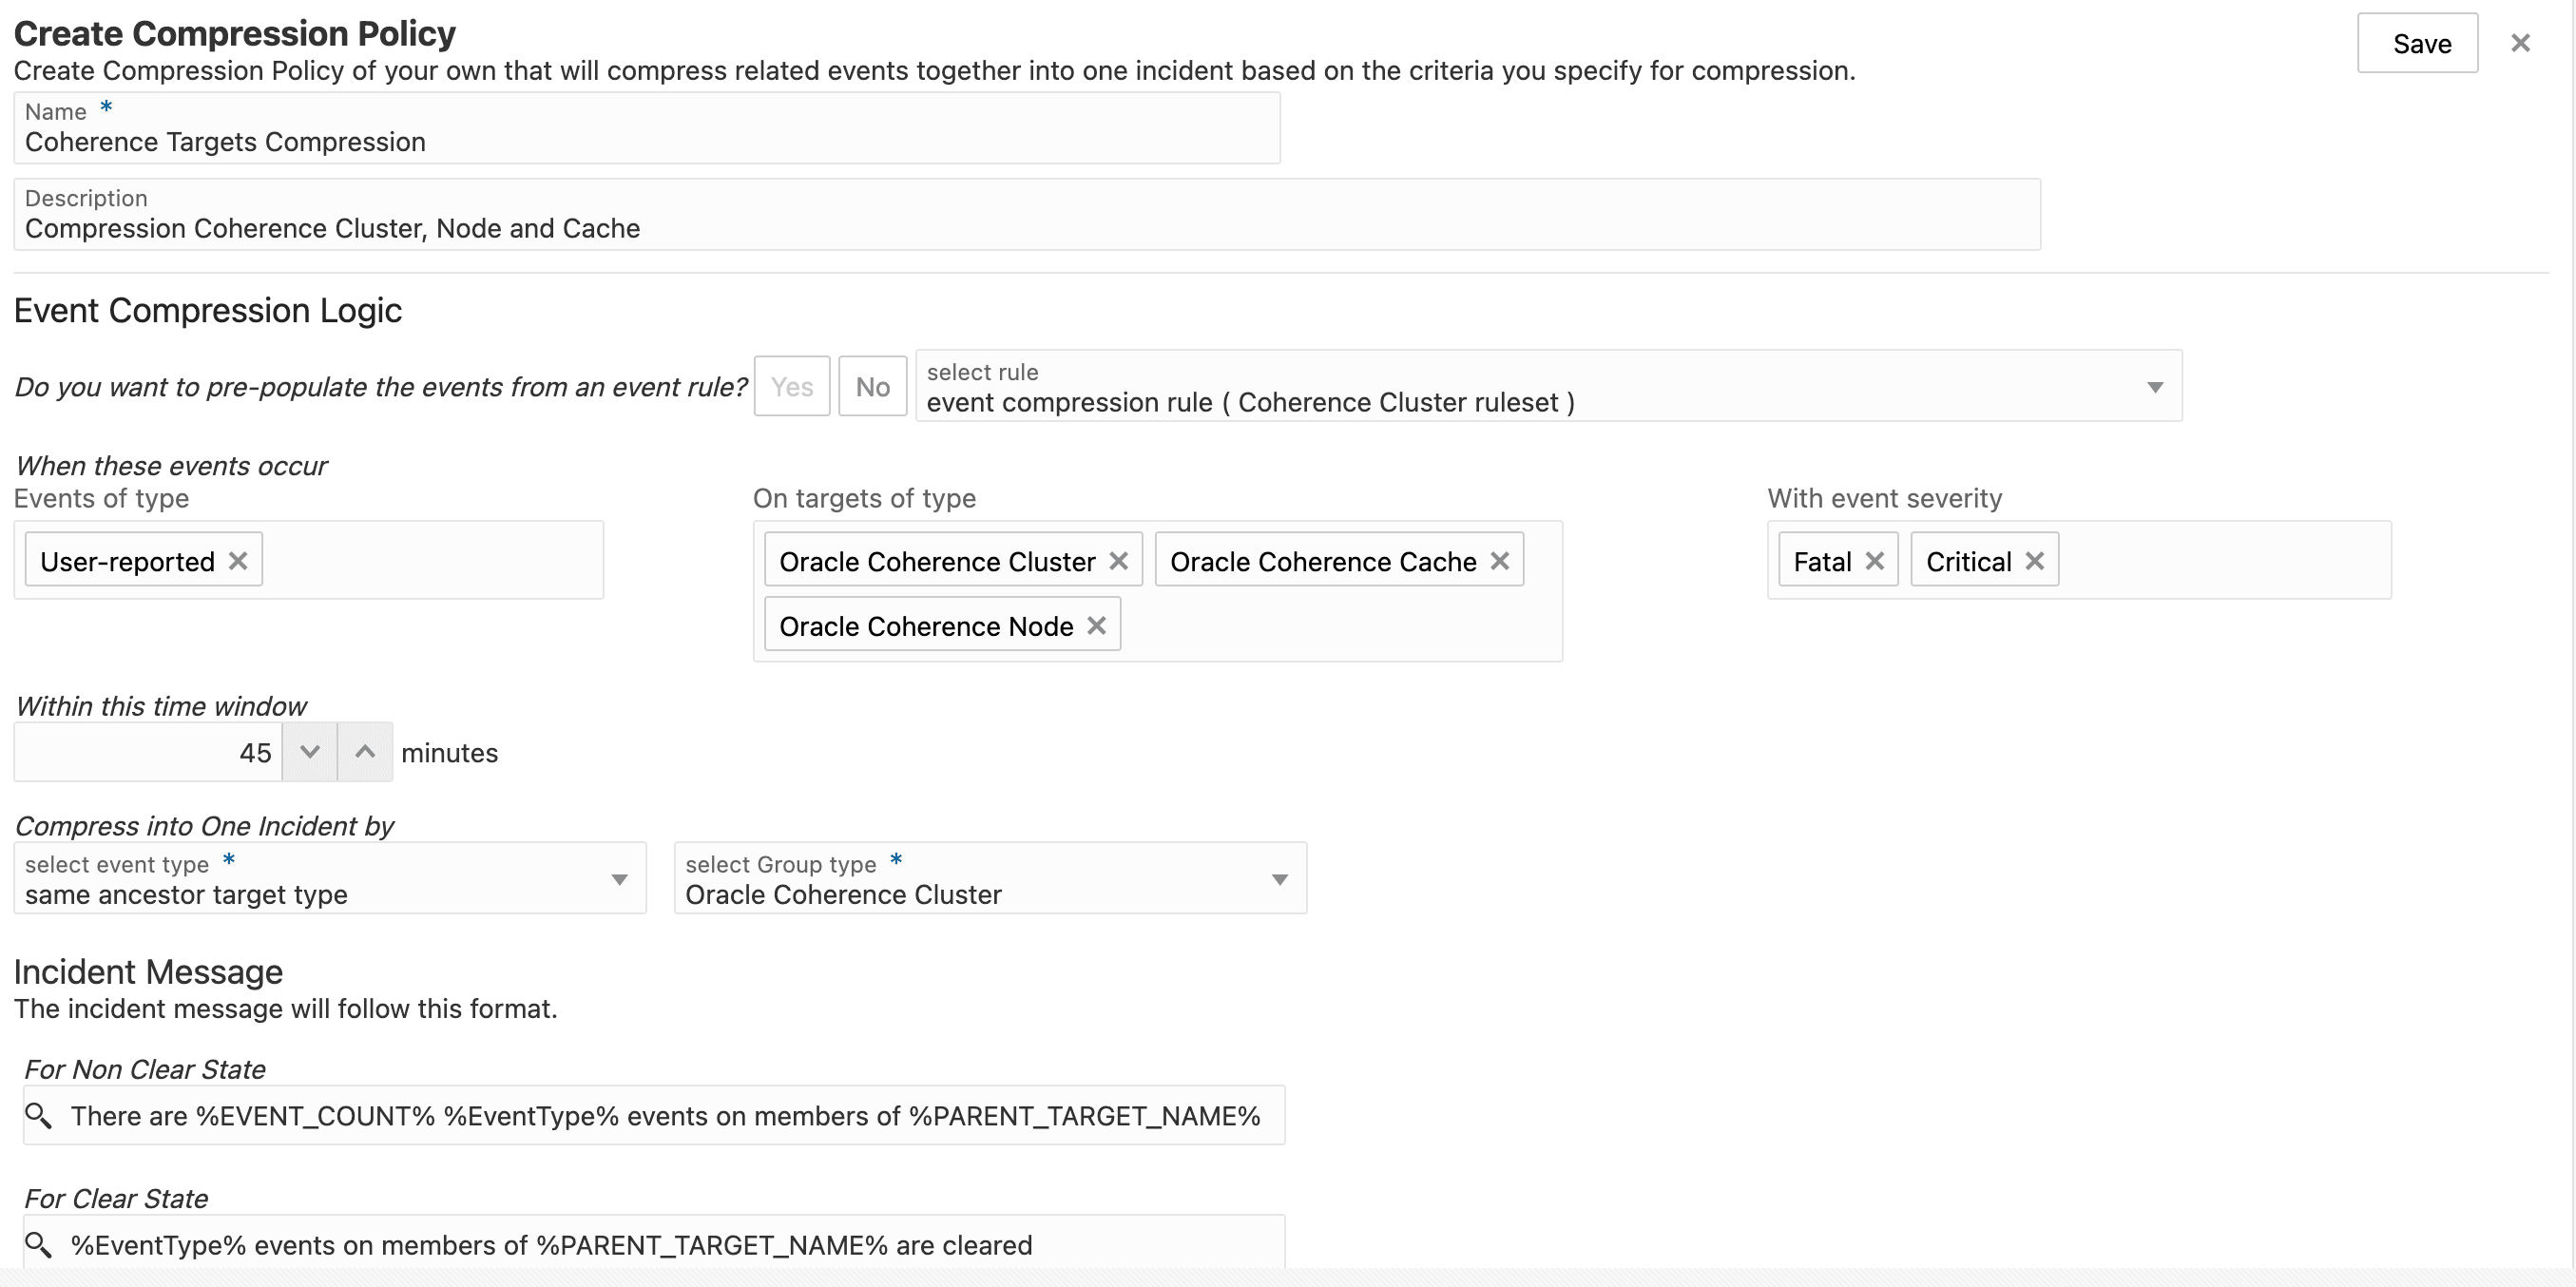
- Enter a Name and Description. Define a name and
description that is meaningful to you and describes the policy you will be
creating.
Note:
The policy name must be unique (not used by any out-of-box or existing user-defined compression policy).Next, you define the compression logic.
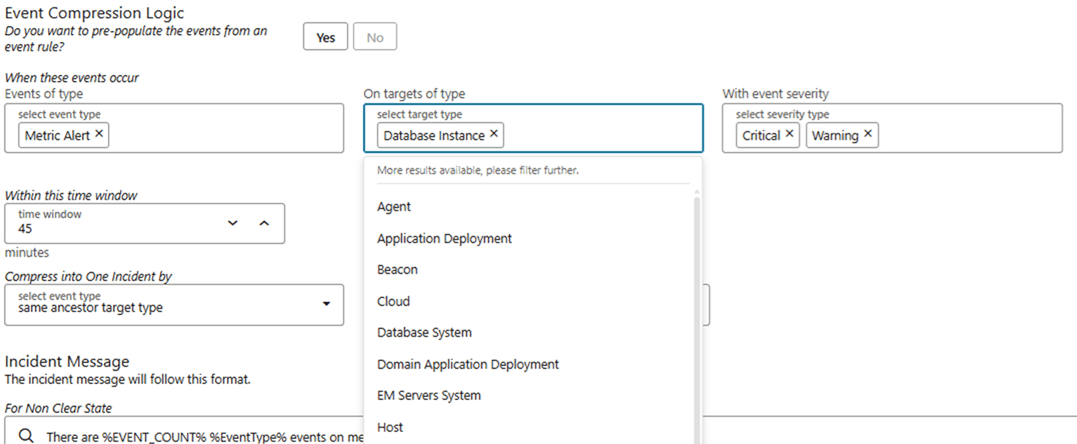
- Define the event compression logic: Events.
In this step, specify the set of events to be compressed together when they occur within a short time period. These events are identified by their event type, target type on which the event occurred, and event severity. You can prepopulate these event attributes from an event rule, or you can manually specify each event attribute yourself.
Note:
In Enterprise Manager 13.5 RU18, you may now define multiple event types in your compression logic. For example, a database down may cause connectivity-related metric alerts on the dependent applications. In EM, this would translate to Target Availability events and Metric Alert events being generated. Using Multi-Event Type compression, you may group these different but related events into one incident instead. - Define the event compression logic: Time window.
After selecting the events in the previous step, specify the time window within which they must occur to be compressed into a single incident. For example, with a 45-minute window, the selected events must occur within 45 minutes of each another to be compressed or grouped into the same incident.

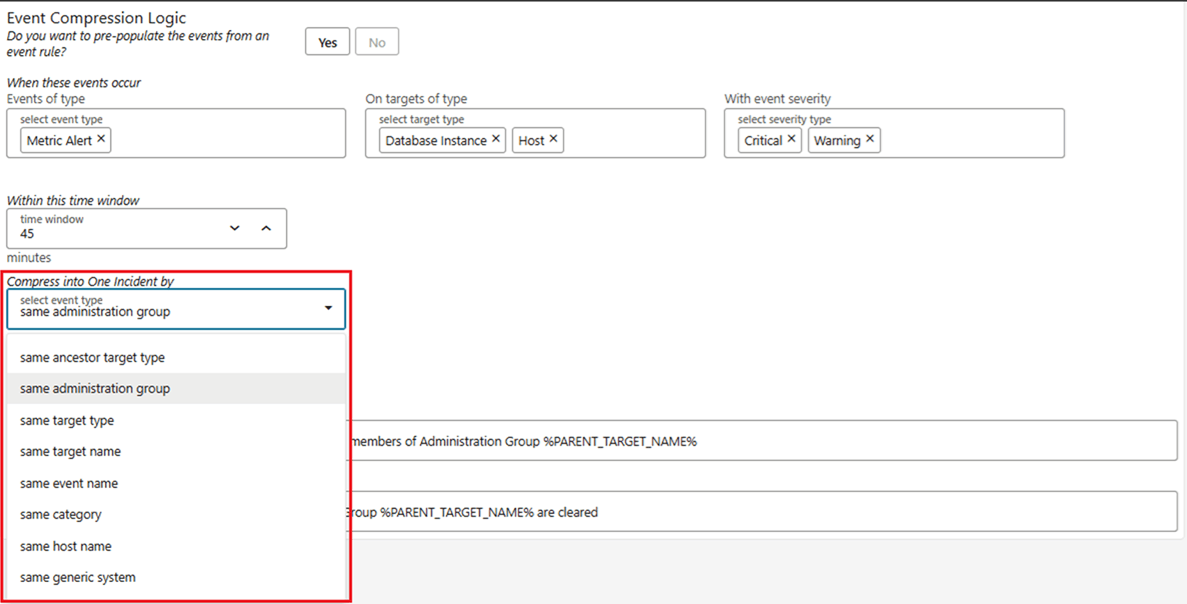
- Define the event compression logic: Compress into One Incident by.
Finally, choose the criteria by which you want to compress or group events into a single incident. For example, if you select same administration group, all events on targets that belong to the same administration group are compressed into one incident. Events on targets that belong to different administration groups are compressed into separate incidents.
Note:
When you select same ancestor target type, all events for all target types chosen in Step 3 will be compressed into a single incident. For that reason, you must also select a Group type to limit the event compression to a specific target type.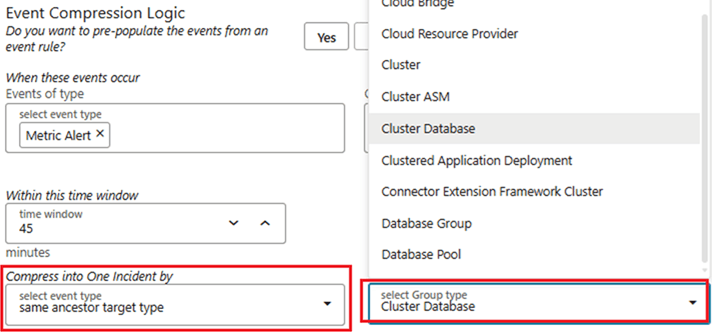
- Define incident Clear and Non-Clear messages you want to display when the incident occurs. By default, this field will be prepopulated based on what is entered for the Compress into One Incident by section. You may modify the incident message as needed.
The format of the incident message are as follows:
- Non-clear State:
There are %EVENT_COUNT% target down events on members of Cluster Database: %PARENT_TARGET_NAME% - Clear State:
Target down events on members of Cluster Database: %PARENT_TARGET_NAME% are clearedThere are additional variables that can be used in an incident message. These variables will be replaced with its corresponding attribute when the message is generated. For example, if the variable
%TARGET_NAME%was used in the event compression logic, when an incident is triggered it will be replaced with the name of the target that the incident was created on.Note:
Only certain variables make sense for each Compress into One Incident by selection. It is best to refer to the default message that gets populated with applicable variables during the selection.Variables that can be used in the incident message are:
Variable Definition %EventType% The type of event that triggered the incident. Examples include: Metric Alert, Target Availability, High Availability, etc. %EVENT_NAME% The internal event name describing the nature of the events %TARGET_NAME% The name of the target that the incident was created on %TARGET_TYPE% The type of target that the incident was created on. Examples include: Database Instance, WebLogic, etc. %PARENT_TARGET_NAME% Name of the parent target that an incident was created on. Example: Cluster Database (parent target) has members instances: Database Instance and Pluggable Database (children targets) %HOST_TARGET% Target where targets that triggered the incident are hosted %GENERIC_SYSTEM% Group together events from targets that are members of the same generic system. Example: Users create their own systems for their applications and want to group all events related to a specific system in order to manage it as a unit. %CATEGORY_NAME% The name of the category. Functional or operational classification for an event. Available Categories: - Availability
- Business
- Capacity
- Configuration
- Diagnostics
- Error
- Fault
- Jobs
- Load
- Performance
- Security
%EVENT_COUNT% The number of events associated with this incident
- Non-clear State:
- After completing the policy definition, click Save. The
newly created user-defined event compression policy appears in the policy list
in Draft status where you can continue to edit and update the
user-defined event compression policy.
Note:
While in Draft status, you can test the effectiveness of this compression policy and any changes you make to it by running the Event Compression Policy Analyzer. See Assessing the Benefits of Using Event Compression Policies for more information.
Publishing a User-defined Event Compression Policy
Once the policy is ready, publish it so that it can be used by other administrators. Select Publish from the action menu.
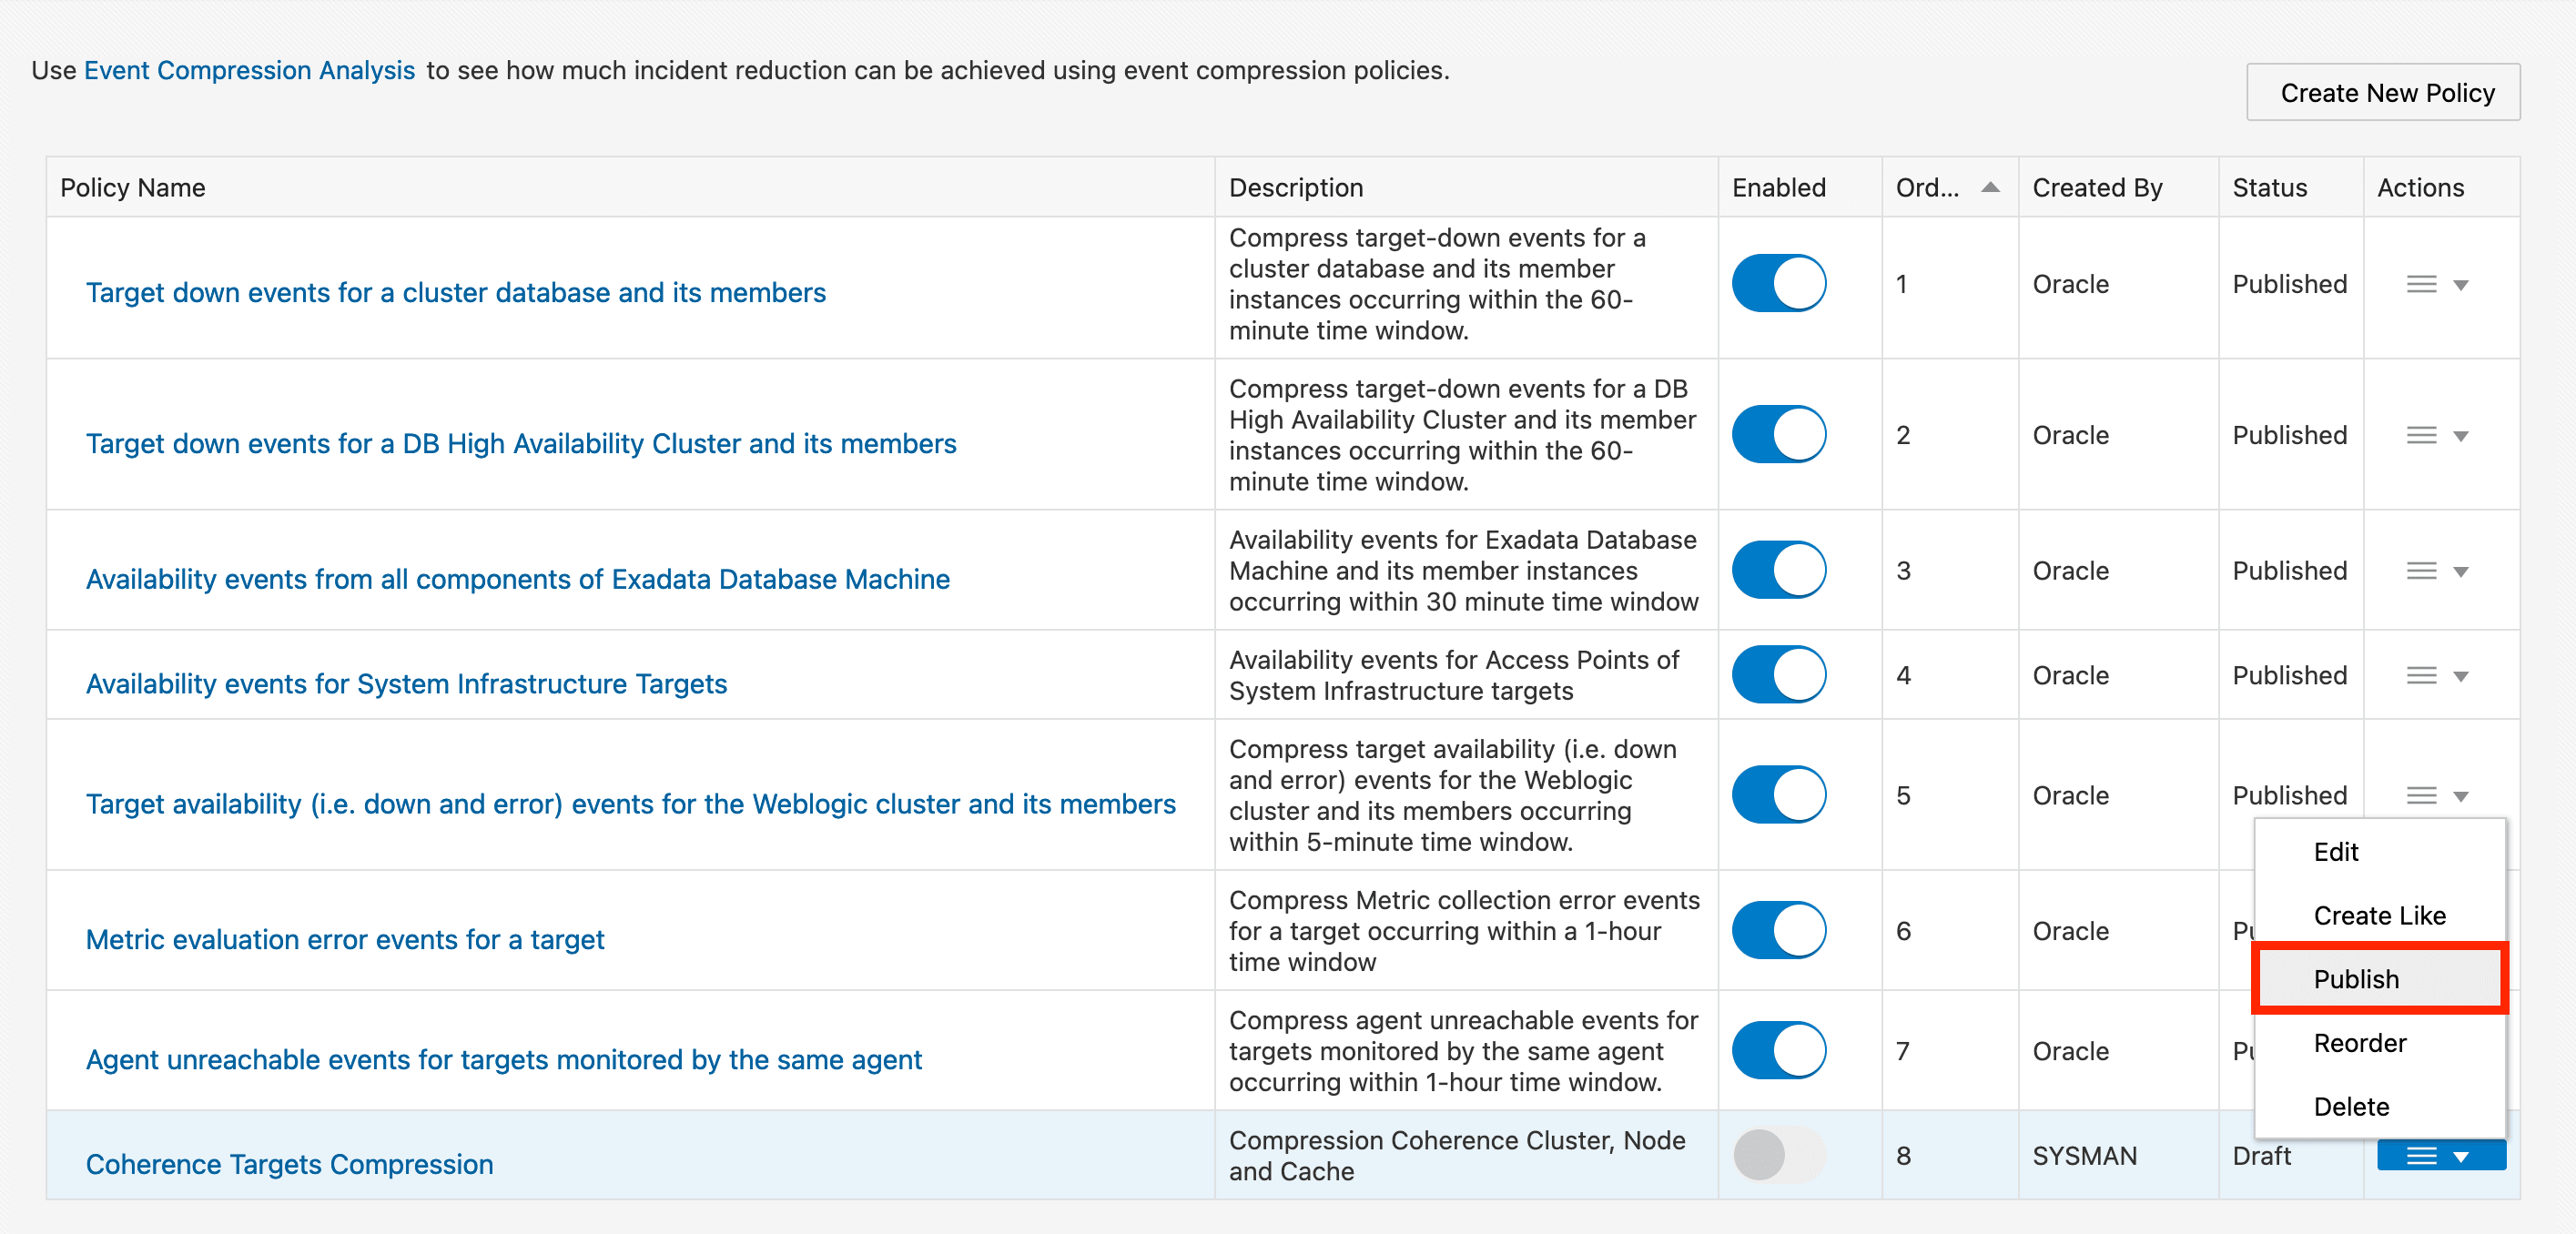
Once published, you’ll be able to enable the user-defined event compression policy.
Editing a Published User-defined Event Compression Policy
You can edit a published user-defined event compression policy. You must first disable the published compression policy before you can make edits. If this compression policy had been previously enabled, it will remain inactive until it is re enabled.
Evaluation Order and Placement
The policies are evaluated from top down, with the top having higher priority (Order). The evaluation order is the sequence in which policies will be executed to match to a rule. For user-defined event compression policies, they will always appear at the bottom of the policy list when created. However, you may change their order in the execution list. They can be placed anywhere above or below the out-of-box policies, but cannot be placed in between the out-of-box policies.
Assessing the Benefits of Using Event Compression Policies
If you’re trying to decide whether you want to use Event Compression Policies, you can view the beneficial impact of using them by running an Event Compression Analysis (available with Enterprise Manager 13c Release 5 Update 11 and later). This analysis uses historical monitoring data from your environment to analyze the impact Event Compression Policies would have had on events and incidents over a selected period in the past. The results of the analysis will show what effect Event Compression Policies would have had on events that generated incidents for the specified time range.
Running an Analysis
To initiate an Event Compression Analysis:
- Navigate to the Event Compression Policies page (Setup->Incidents->Event Compression Policies).
- Enable the desired Event Compression Policies that are appropriate for the event rules you currently have defined.
- Click Event Compression Analysis in the introductory text
at the top of the page.
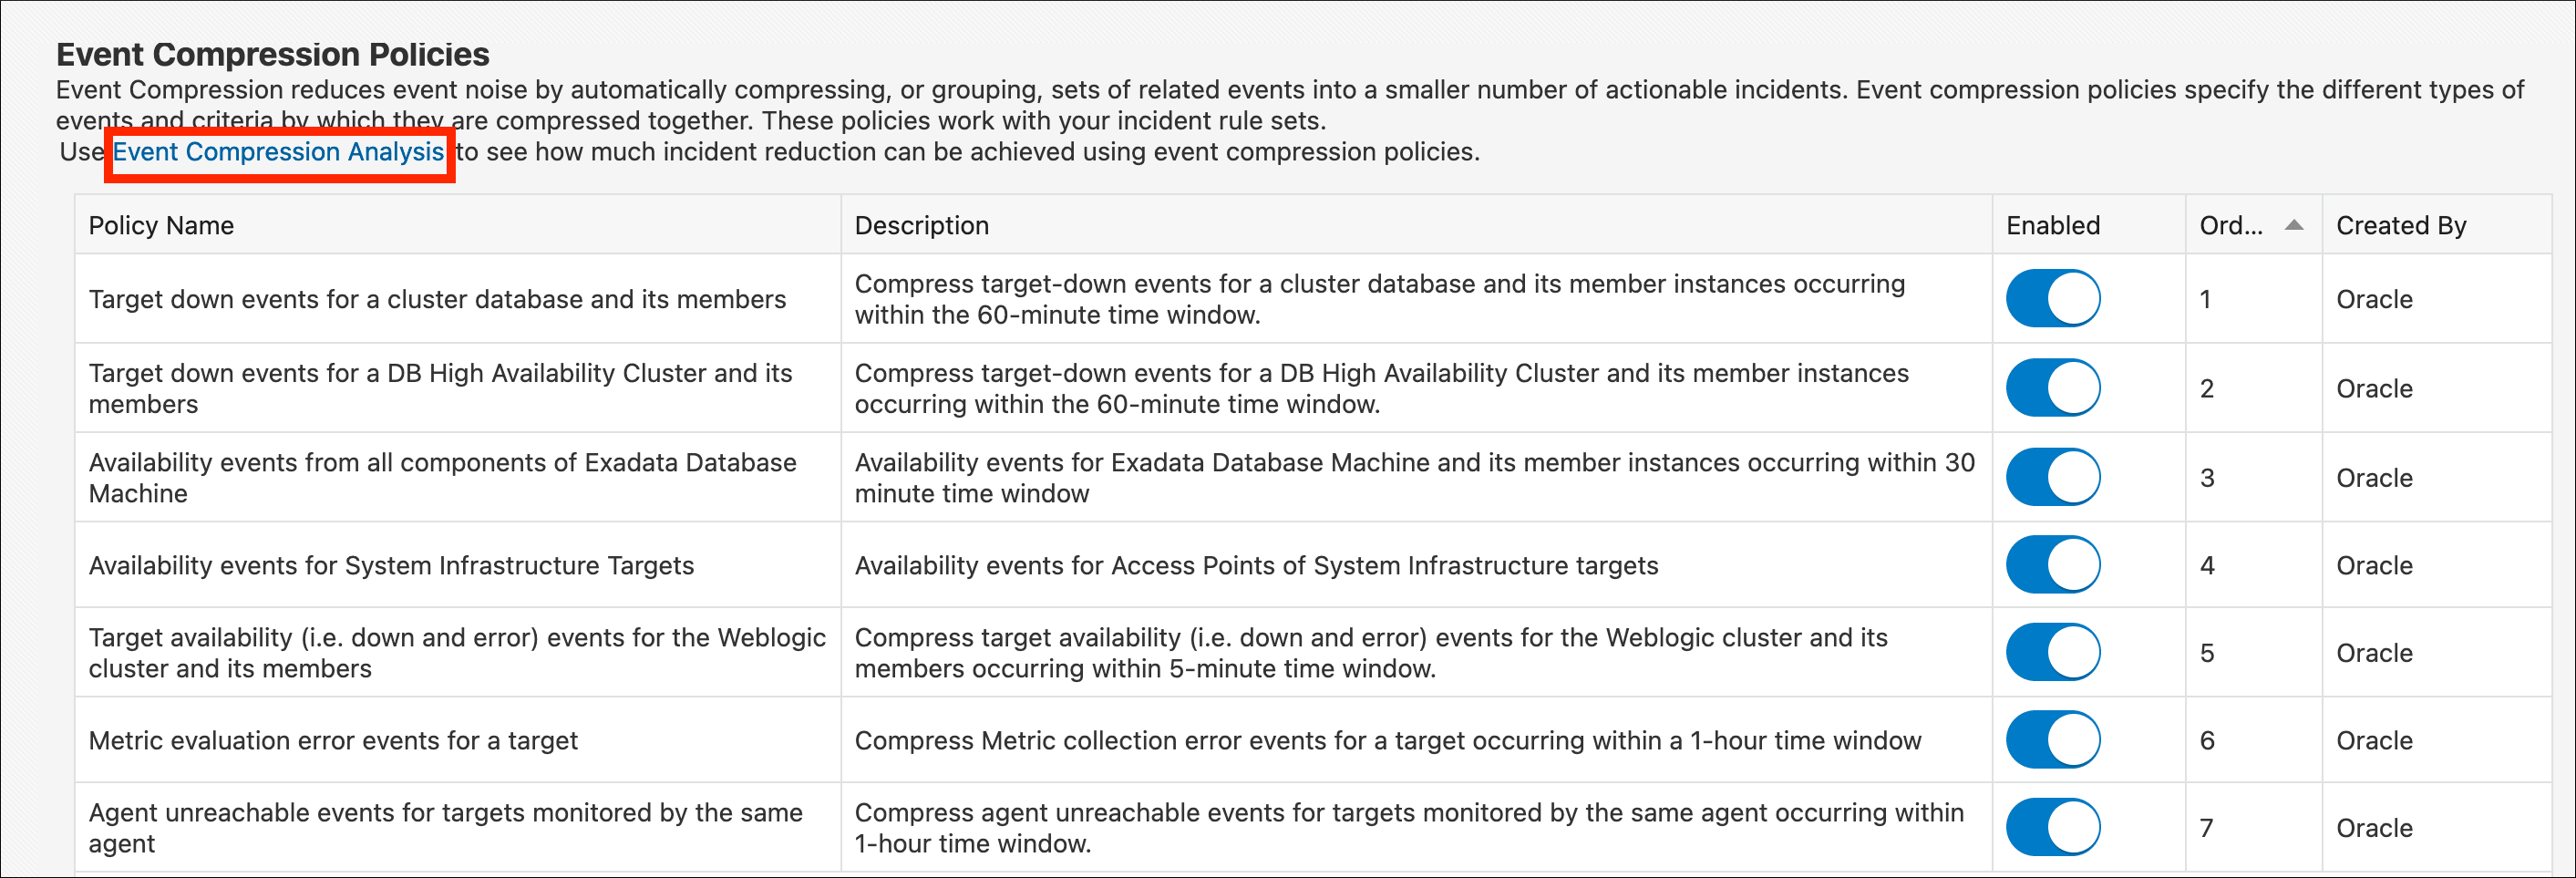
The Event Compression Policy Analyzer page displays.
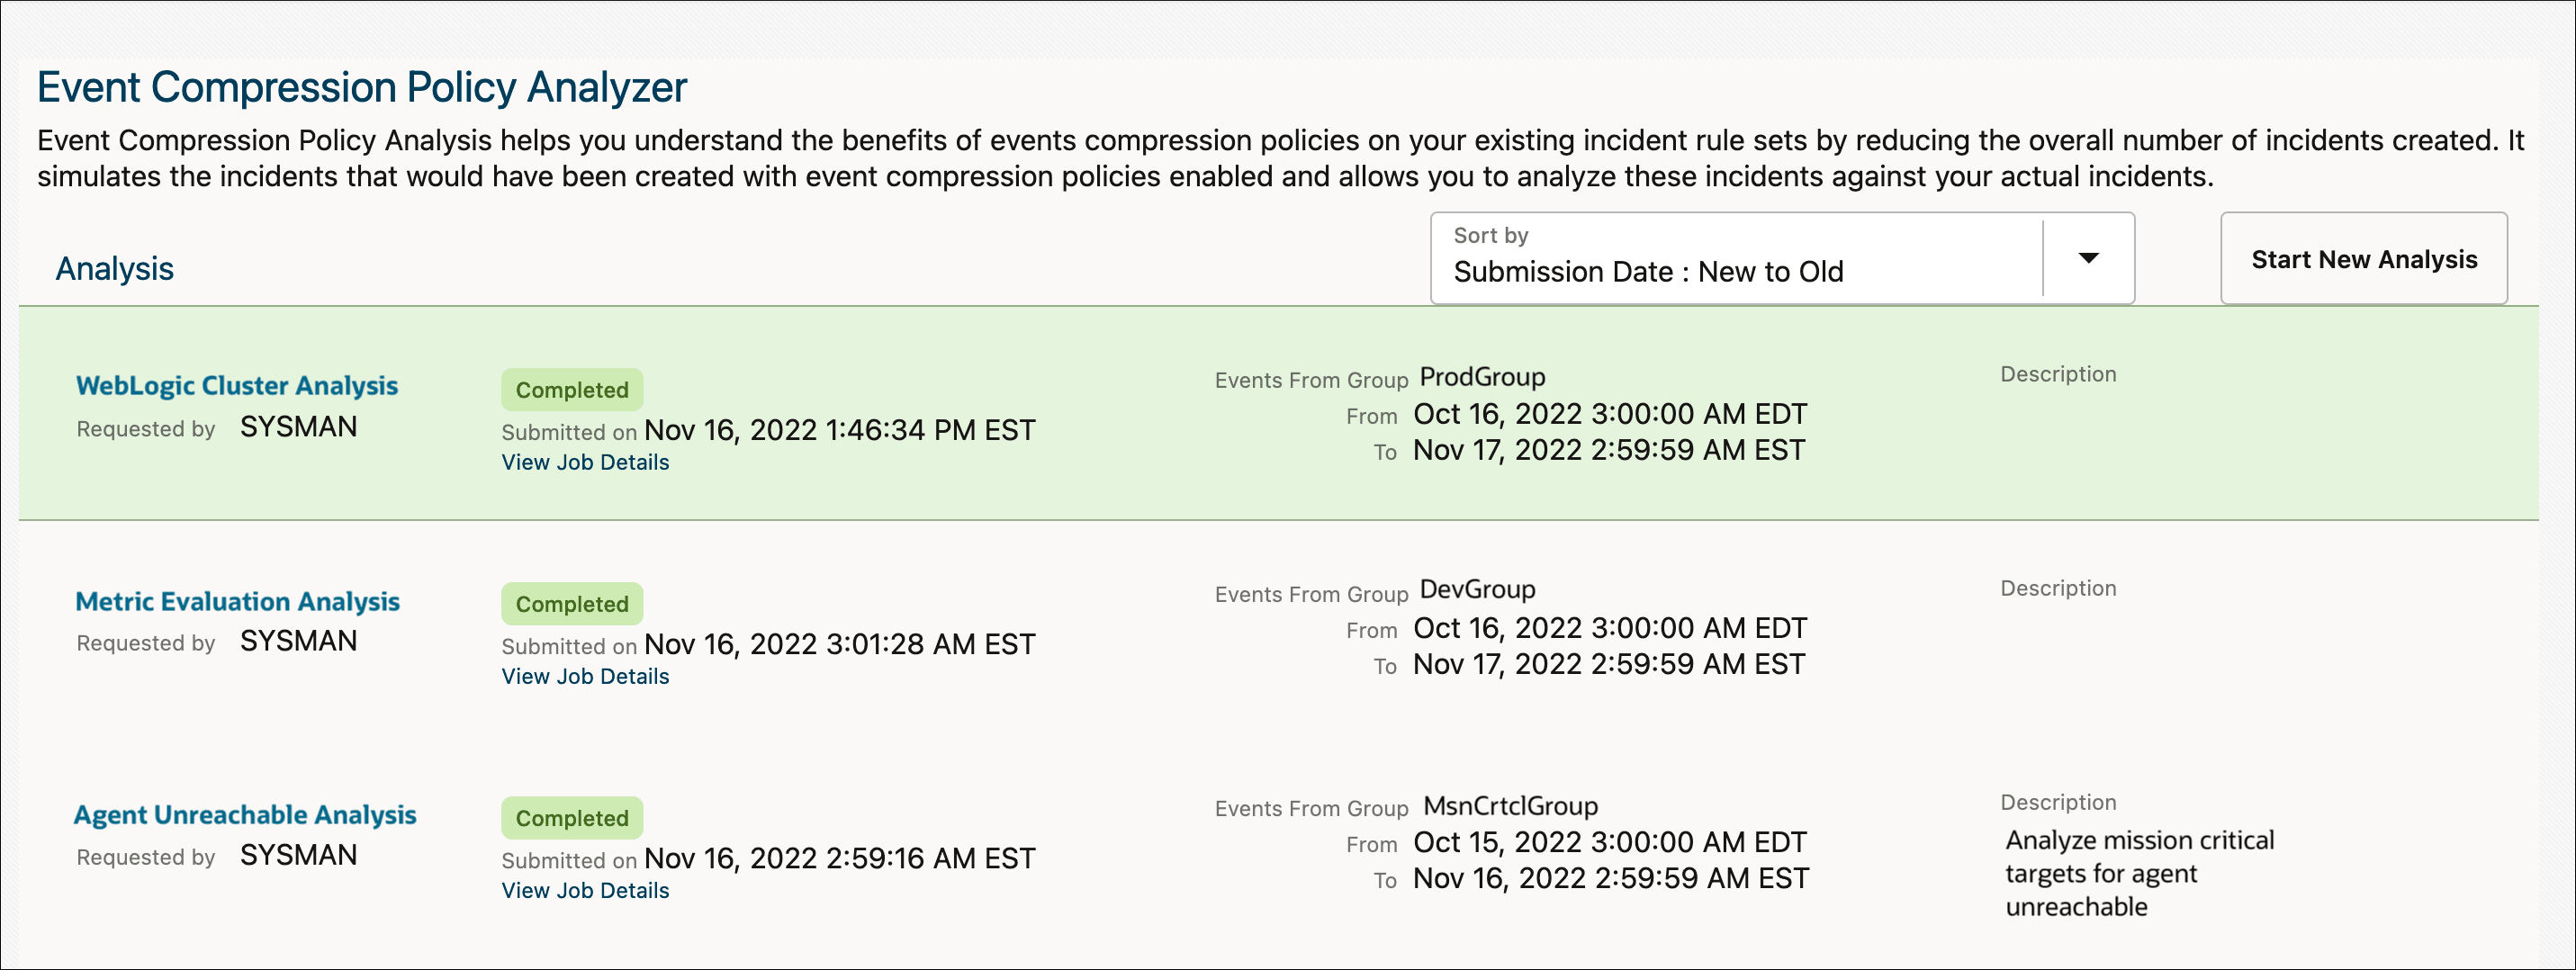
- Click Start New Analysis to display the Compression
Policy Analysis definition dialog.
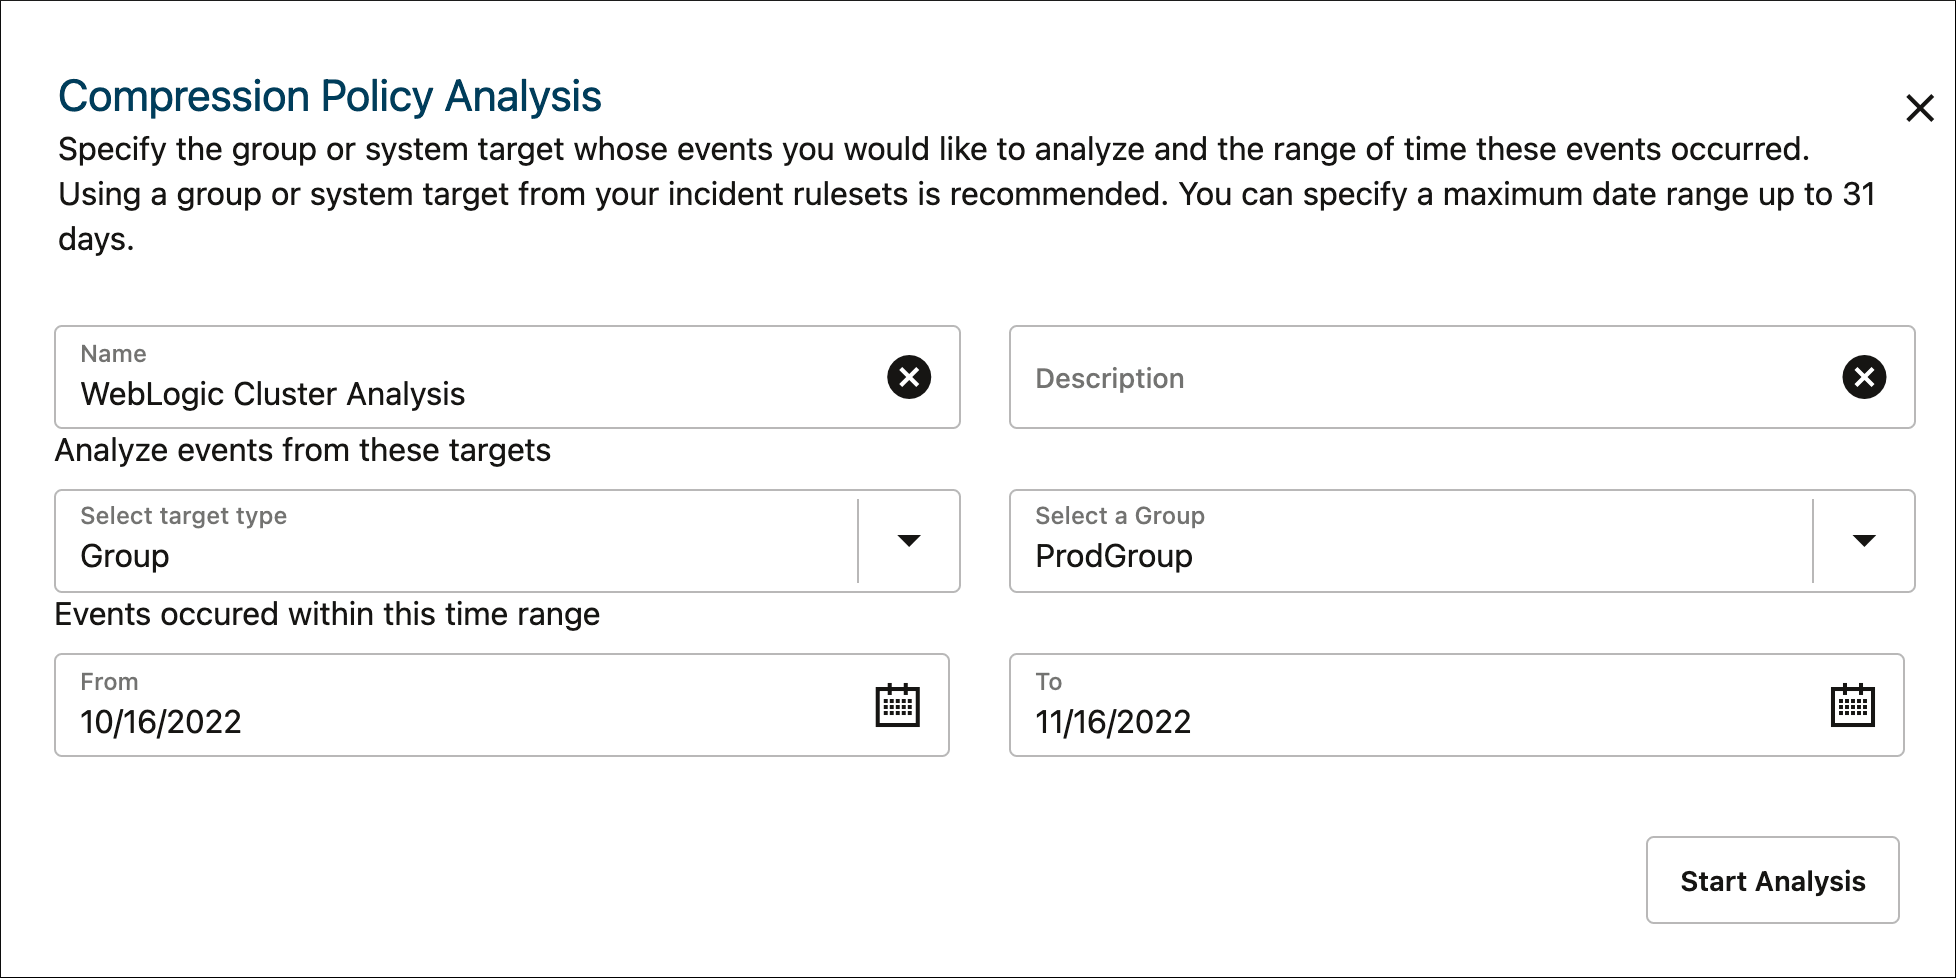
- Name and Description: Define a name and description that is meaningful to you and any individuals with whom you’ll share your analysis.
- Select Target Type and Select
targets: Select type of target generating events
on which you want to run the compression analysis against. Once you’ve
selected the Target Type, you can then choose available targets from the
drop-down menu.
Note:
Only group or system target types are supported as you want to run compression analysis on a set of related targets generating events. - Time Range: Define the duration of the compression analysis. By default, historical event data for the last 30 days is used.
- Click Start Analysis once you have specified all criteria for the compression analysis. A job is then submitted to start the analysis. You can view the Job Progress by selecting View Job Progress on the analysis page .
Interpreting Analysis Results
When the analysis is complete, click on the analysis name. The Event Compression Policy Analyzer page displays. From here, you can view how enabling Event Compression policies would have affected the number of incidents created for the selected time period.
For example, in the image below, 52 events occurred during the last 30 days. Without compression, 52 incidents would have been created. With compression, the number of incidents created was reduced to 47, a 9% reduction in the number of incidents. The Compression Ratio indicates the average number of events that were compressed for each incident.
In the graph below, the analysis summary shows the number of incidents created over time for the selected analysis period and the incident reduction percentage. The bars are color coded to specify the number of incidents when Event Compression Policies are used versus the number of incidents when compression policies aren't used.
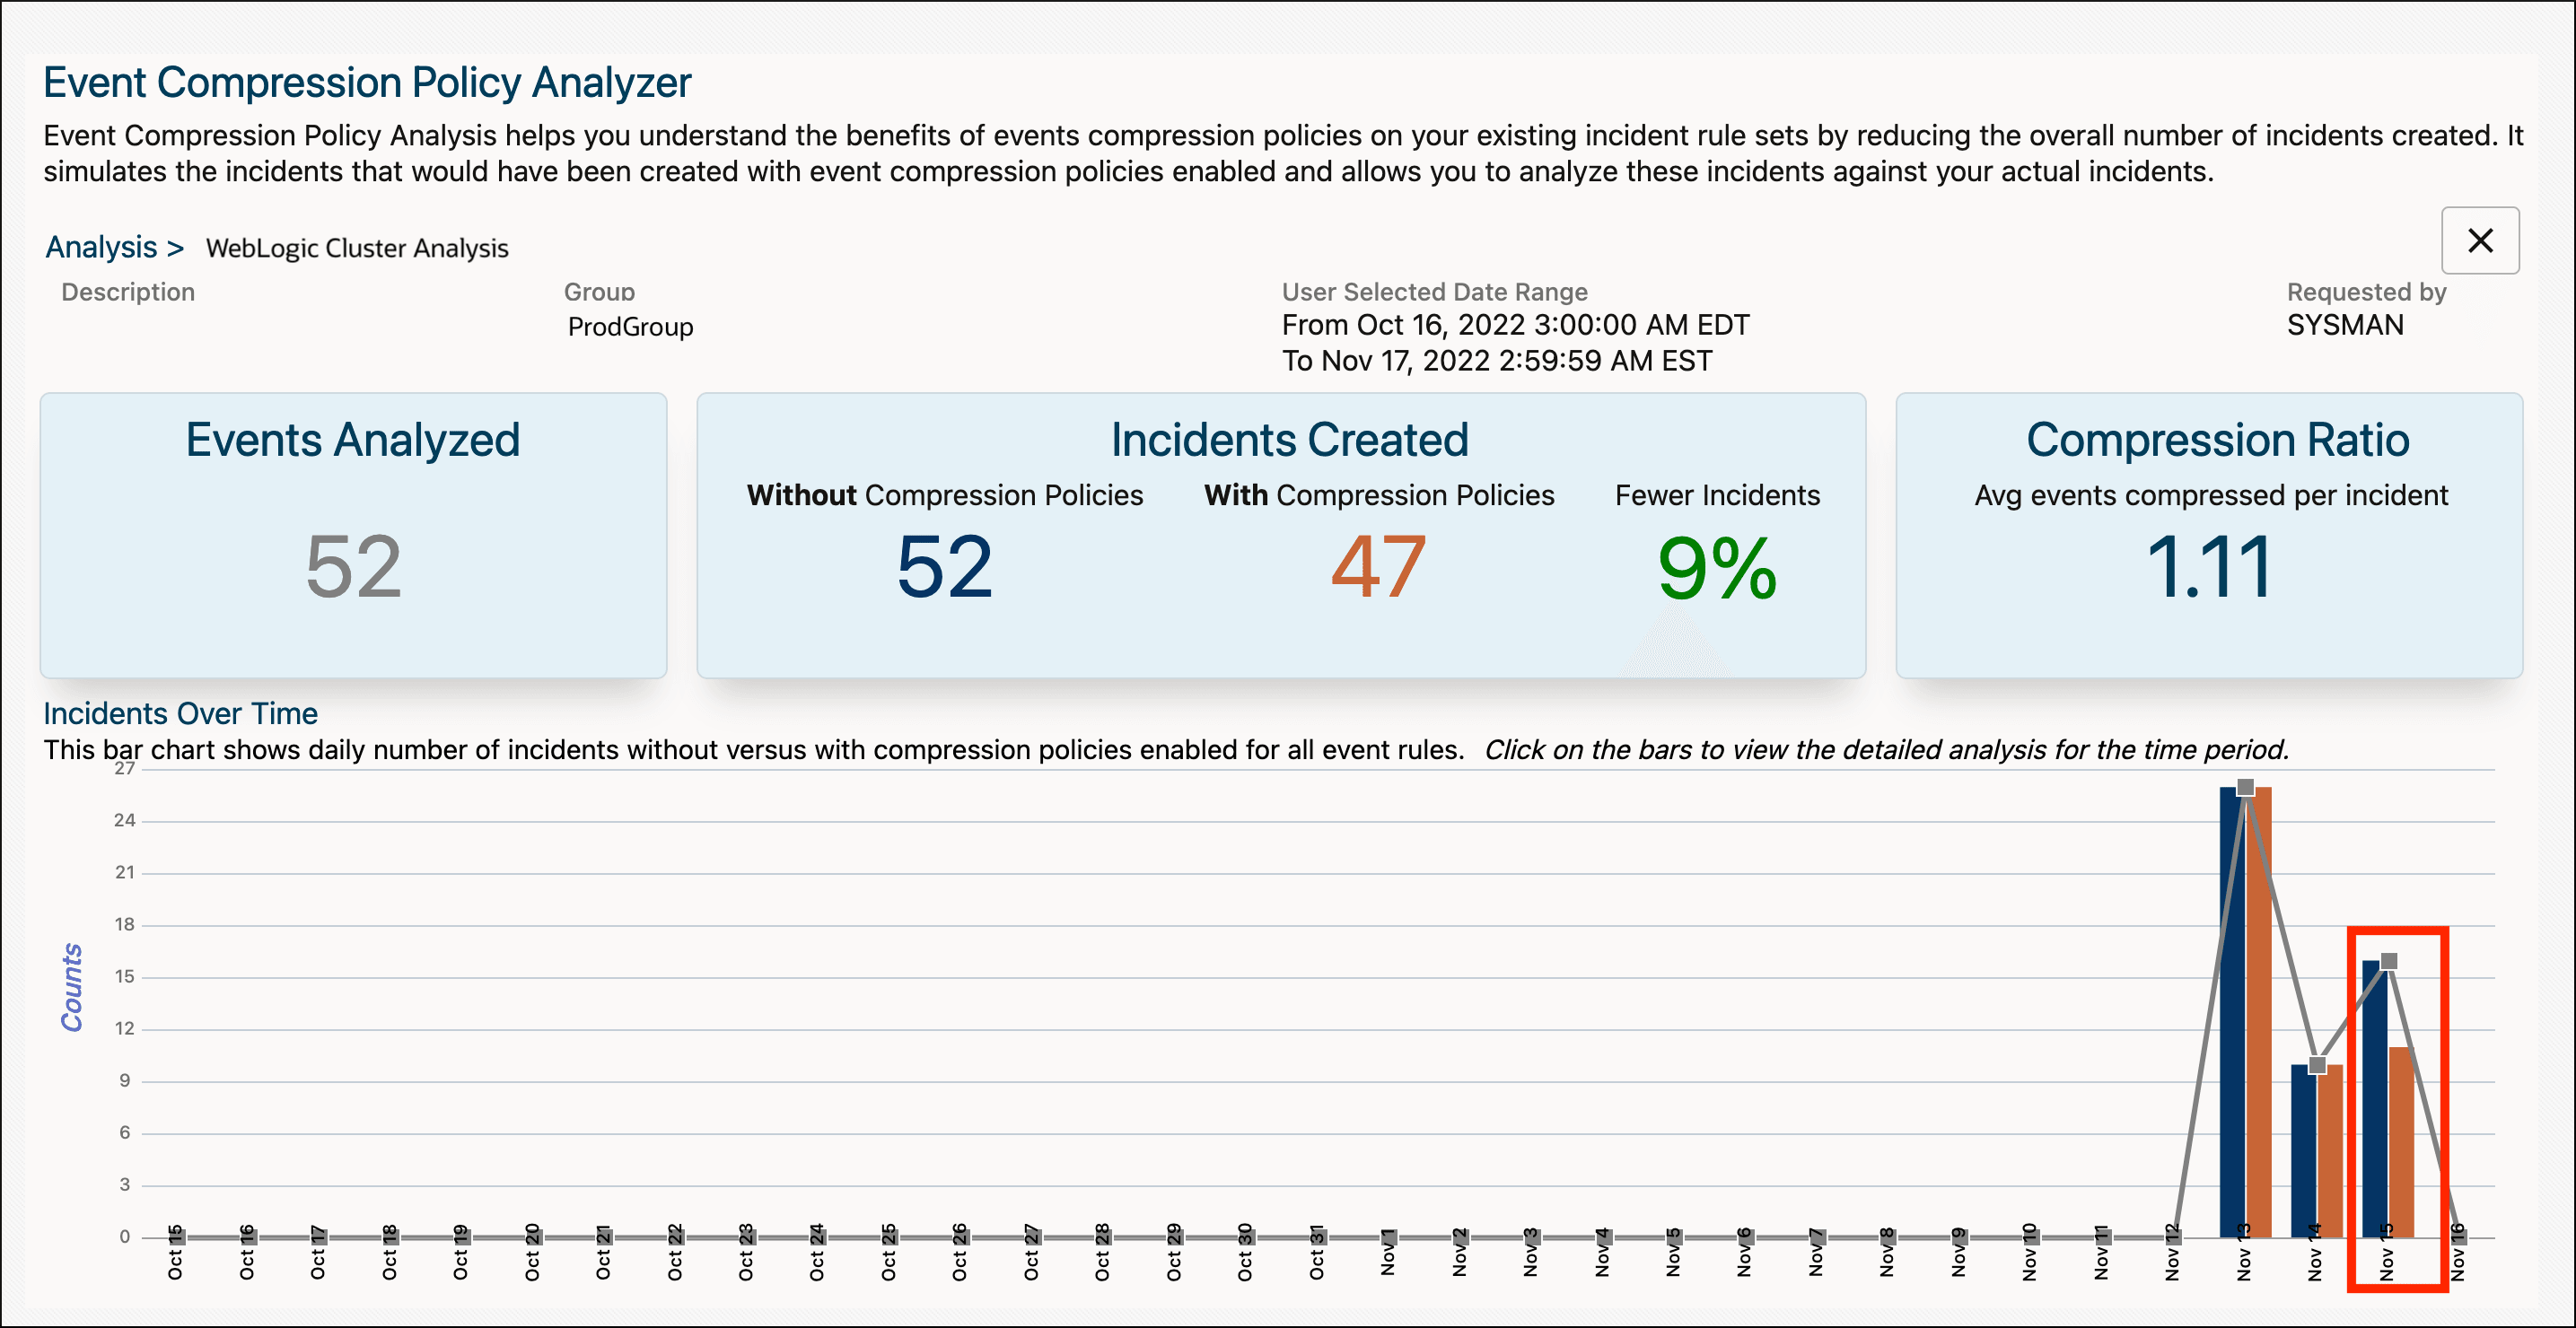
To further analyze how events and incidents are compressed on a specific date, click on the date's corresponding bars to see a visual representation of the compression. In this visualization, you will see how events are mapped from incidents without compression policies to incidents with compression policies.
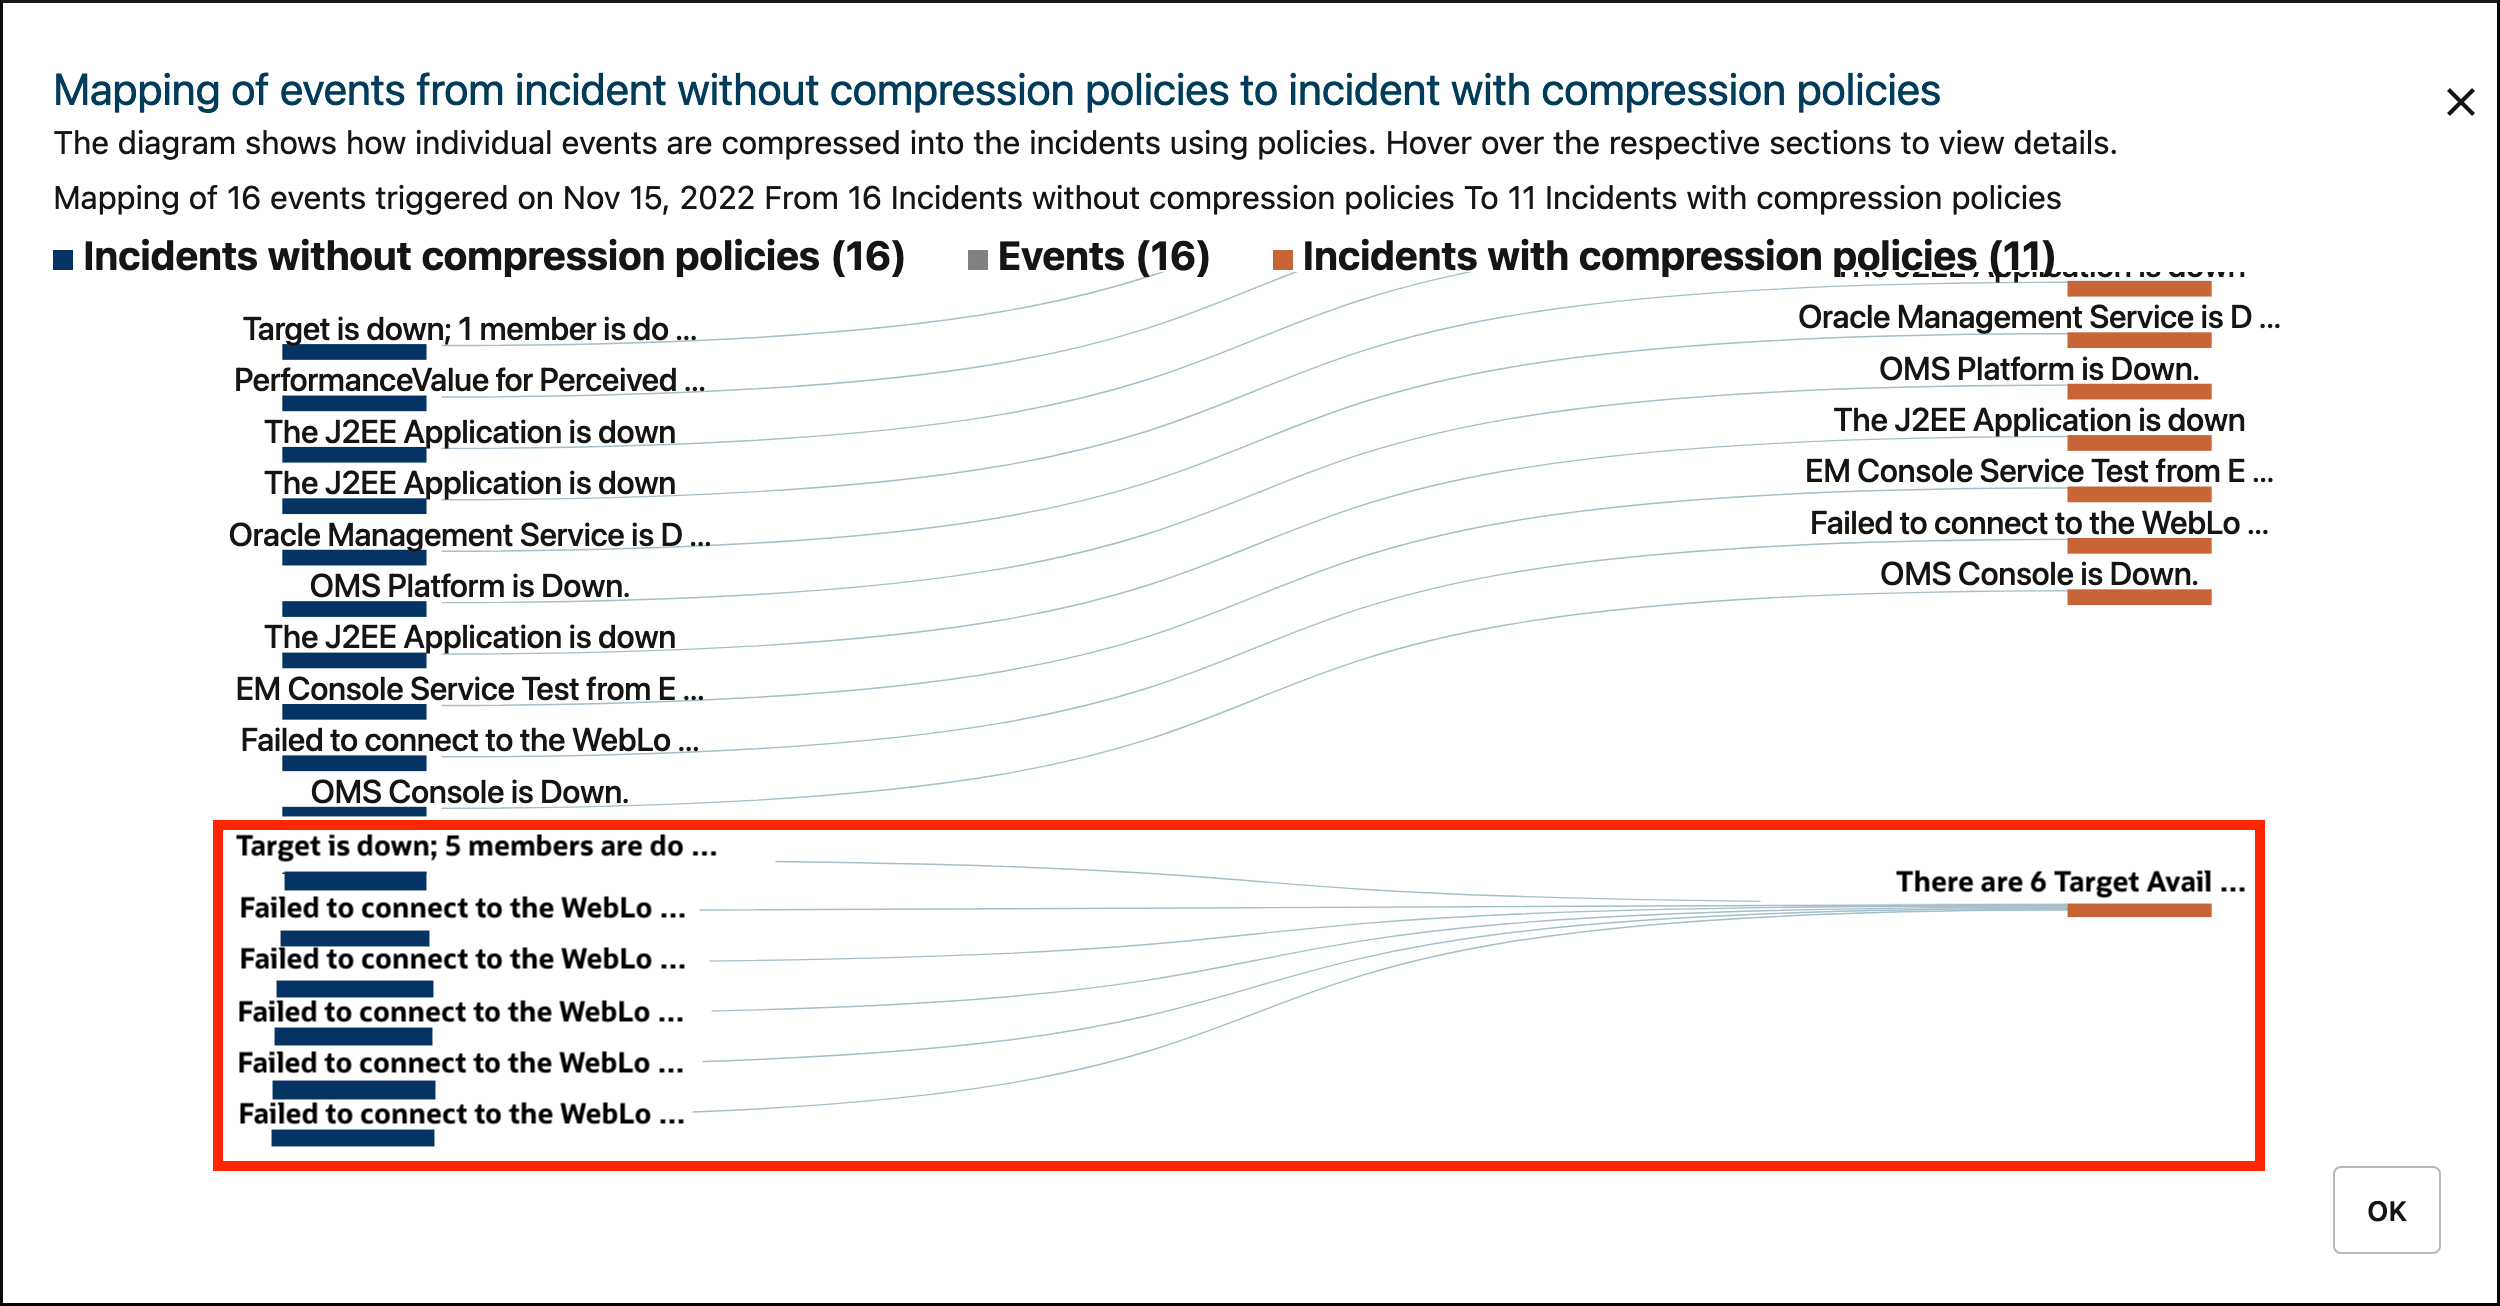
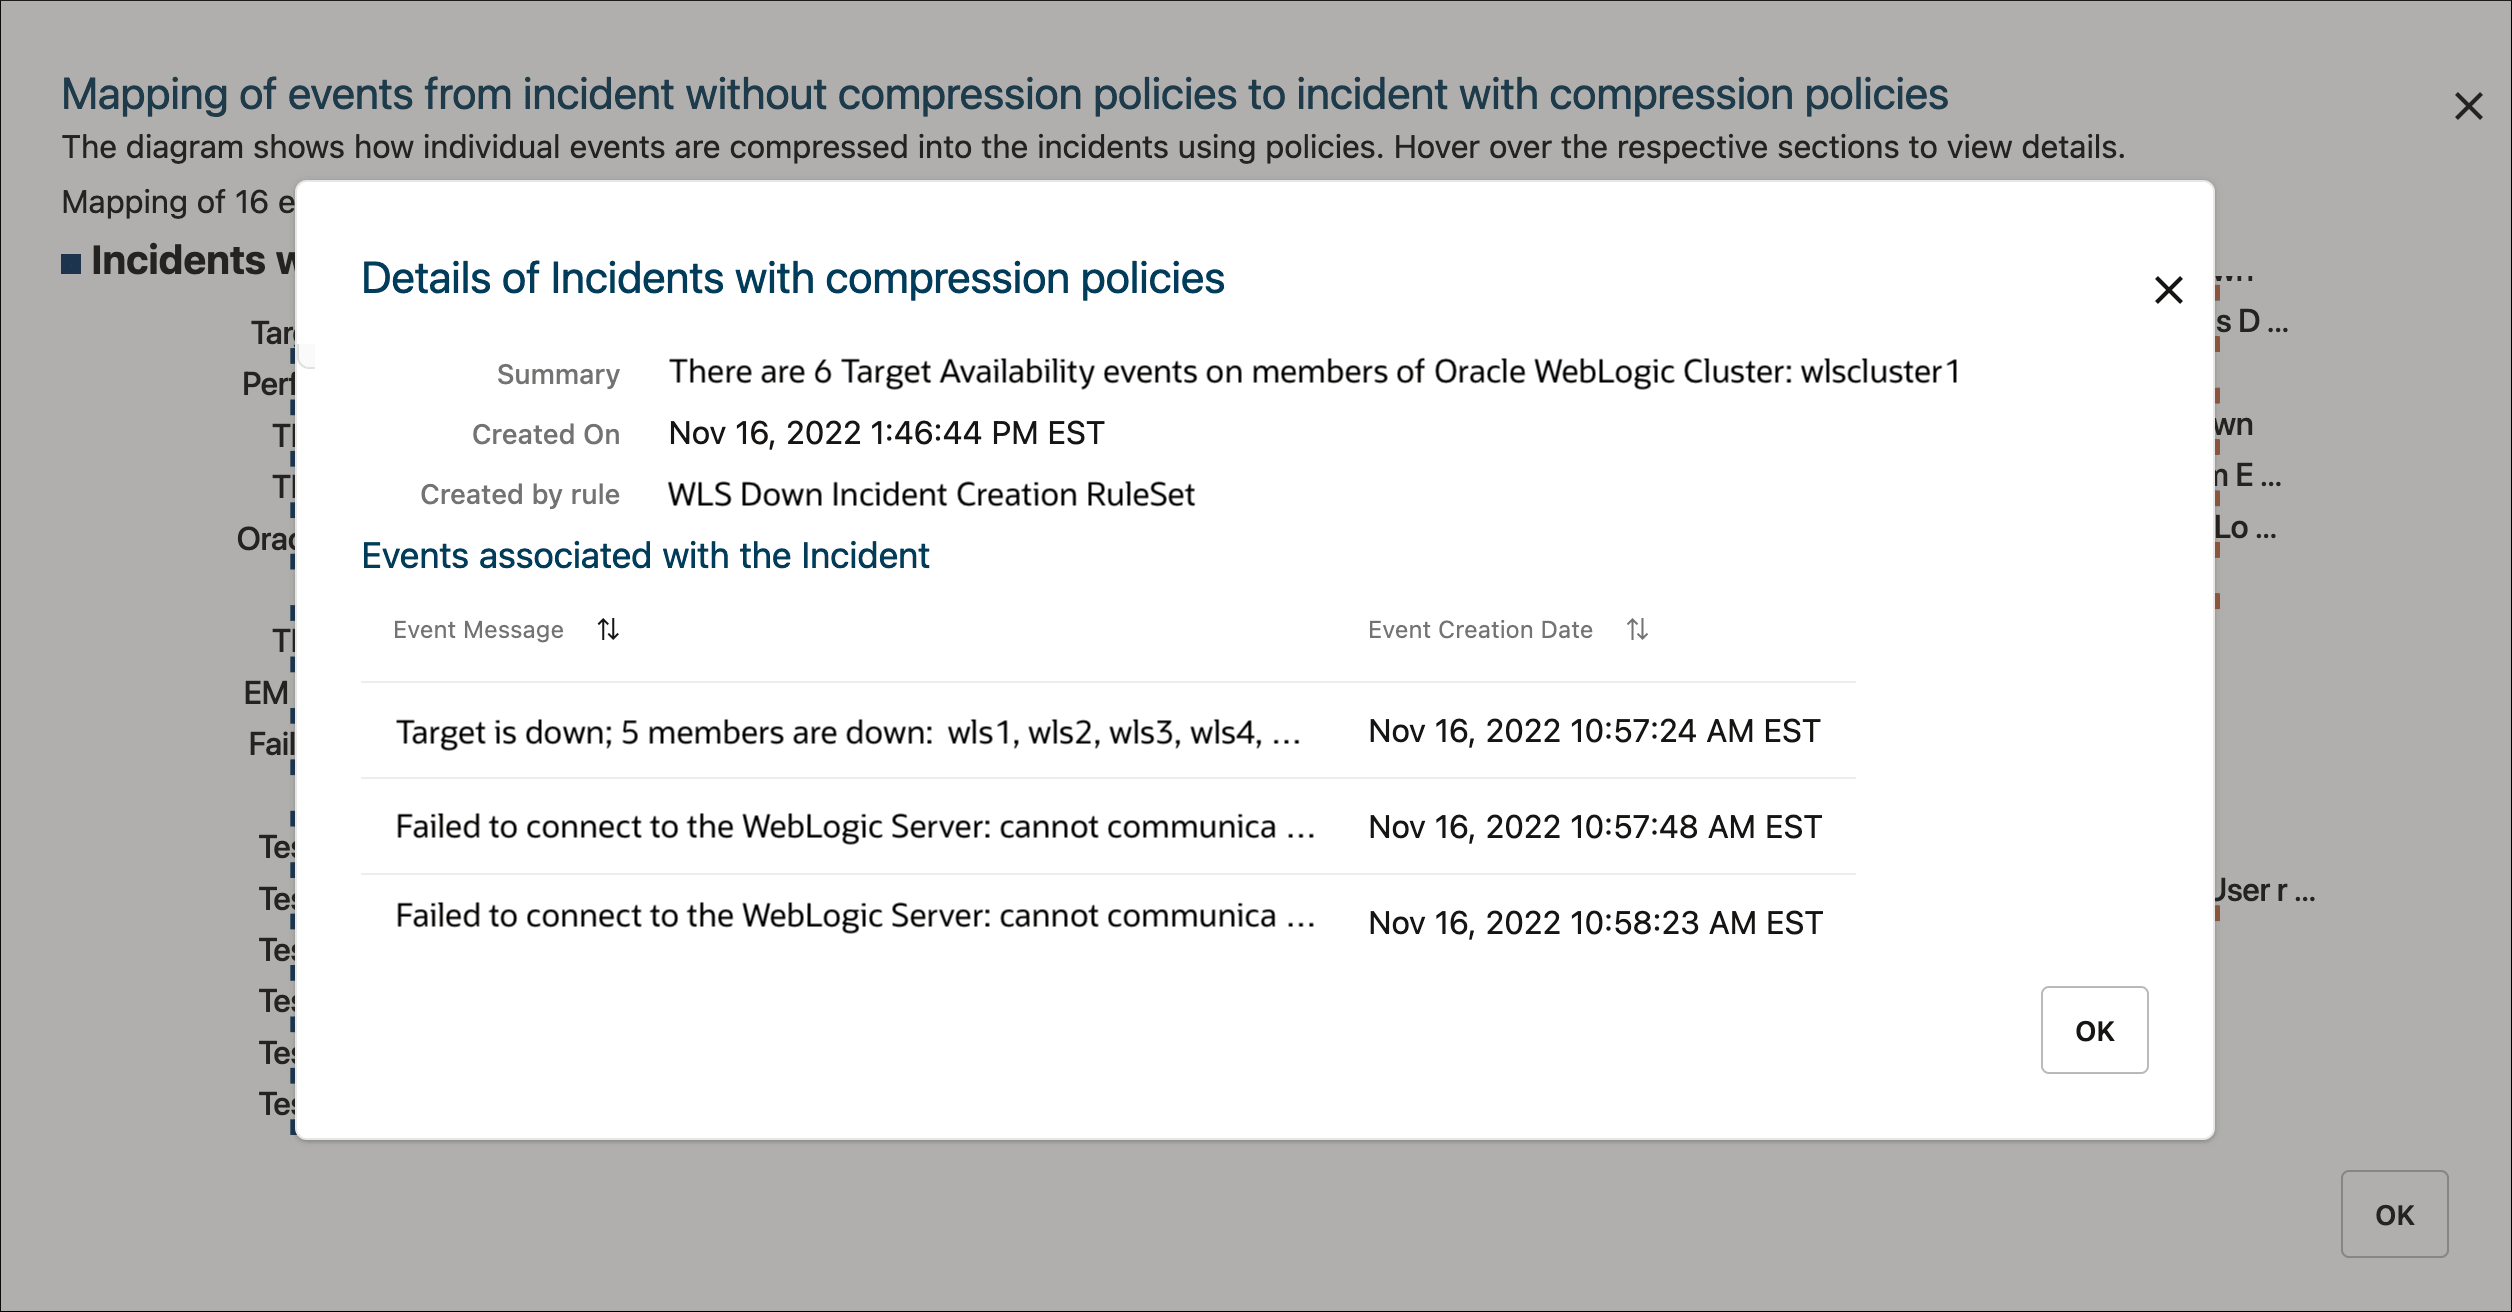
You can also hover and click the respective areas (i.e., events, incidents with/without compression policies) to see an additional pop-up with more details.
Using Event Compression Policies
-
Rule Level Compression
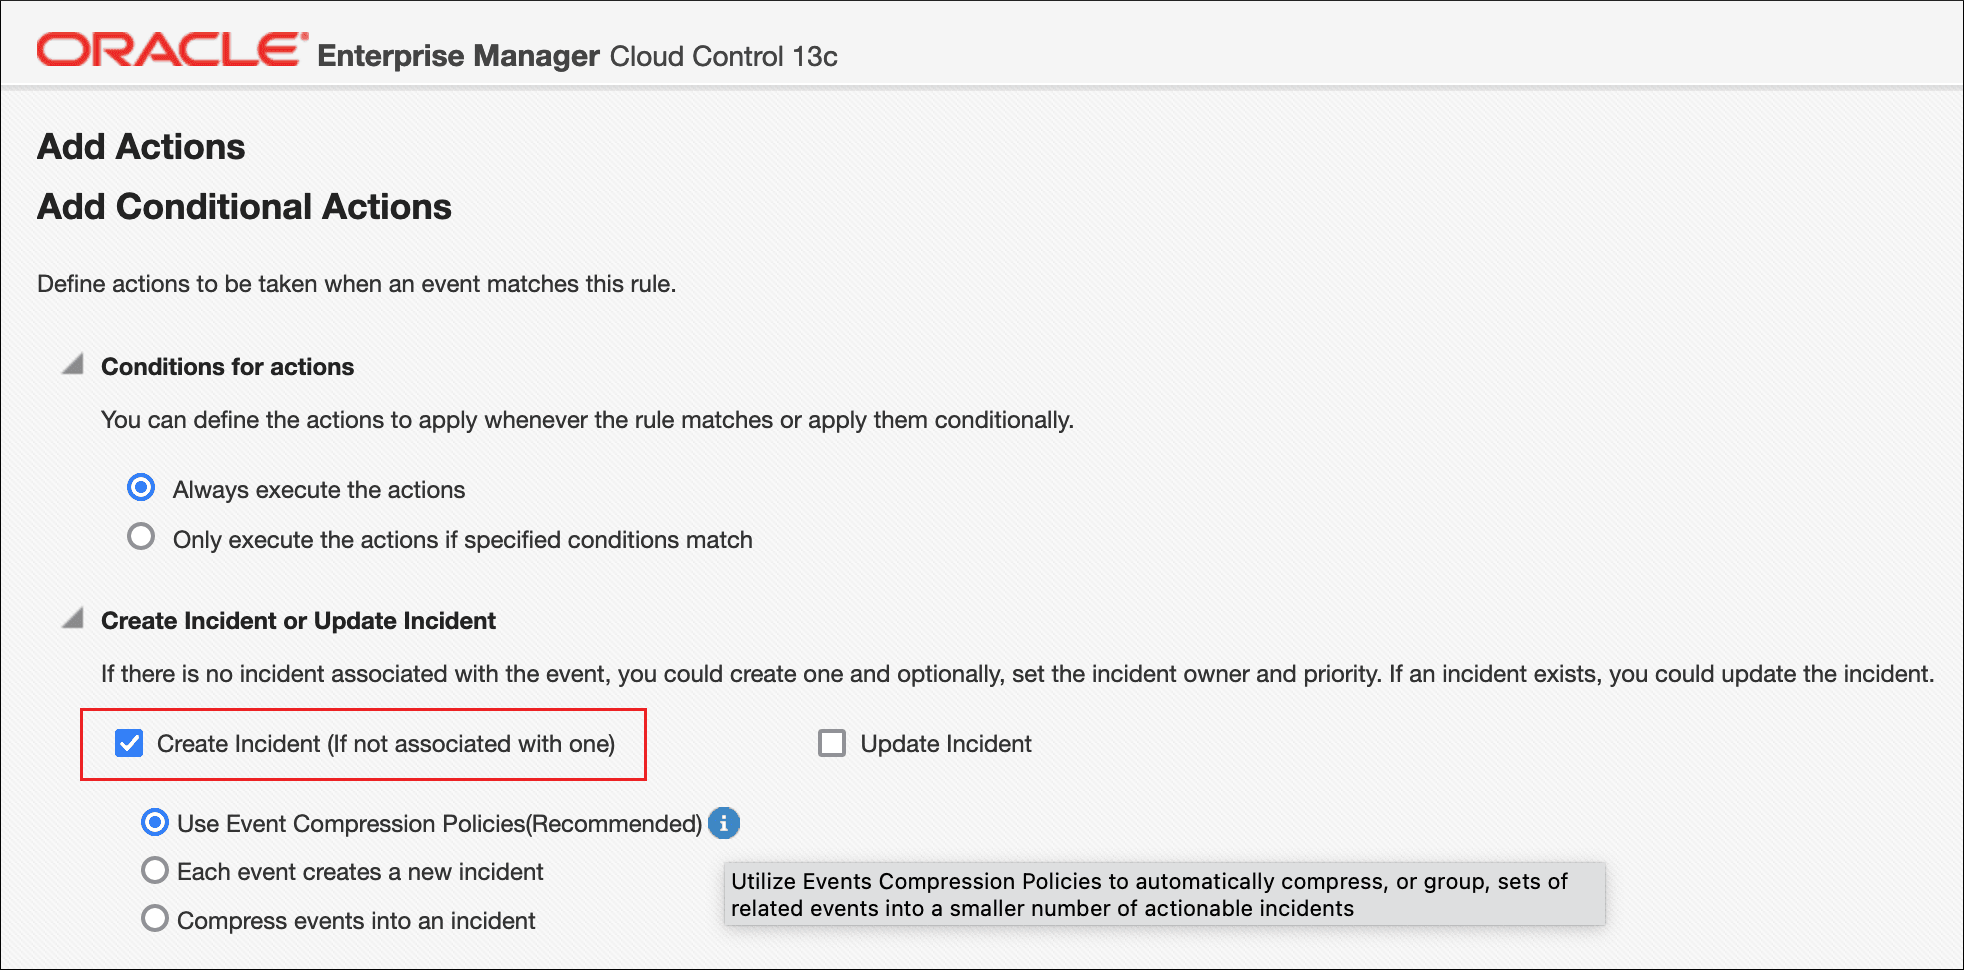
As shown below, in your event rules, you can enable the use of Event Compression Policies when creating an incident in the Add Actions page.
To keep using compression for the same event type, maintain the default selection of Allow policies to compress events within the same rule (Rule Level Compression) in the main ruleset page.
Note:
The use of Event Compression Policies for rules that create incidents will be automatically enabled for all new event rules created after Enterprise Manager 13c Release 5 Update 8 or later. All event rules that have pre-existed prior to Enterprise Manager 13c Release 5 Update 8 (13.5.0.8) will remain as is and will not have Event Compression Policies automatically enabled. You can choose to enable Event Compression Policies for these event rules using the methods described below.
-
Ruleset Level Compression
Ruleset Level Compression works across multiple rules in a ruleset, allowing compression in a single incident of multiple event types that follow different rules from the ruleset.
Note:
The rules forming the ruleset must be creating incidents that use event compression policies.To enable the policies to compress events across multiple event types from multiple rules in the ruleset, select Allow policies to compress events across event types from multiple rules in the rule set (Ruleset Level Compression).
Example:
Let's say you have two event rules defined. The first rule is to create an incident, using Event Compression Policies, for target availability events for a database instance. The second rule is to create an incident, using Event Compression Policies, for metric evaluation error events for a database instance. In order to compress both the target availability and metric evaluation error events across these two event rules into a single incident, select option Allow policies to compress events across event types from multiple rules in the rule set (Ruleset Level Compression). This will work with the corresponding Event Compression Policy to compress both target availability events and metric evaluation events for a database instance into an incident.
- Compress Target Availability Events for Database Instance
- Compress Metric Evaluation Error Events for Database Instance

Enabling Event Compression Policies from Incident Rules Page
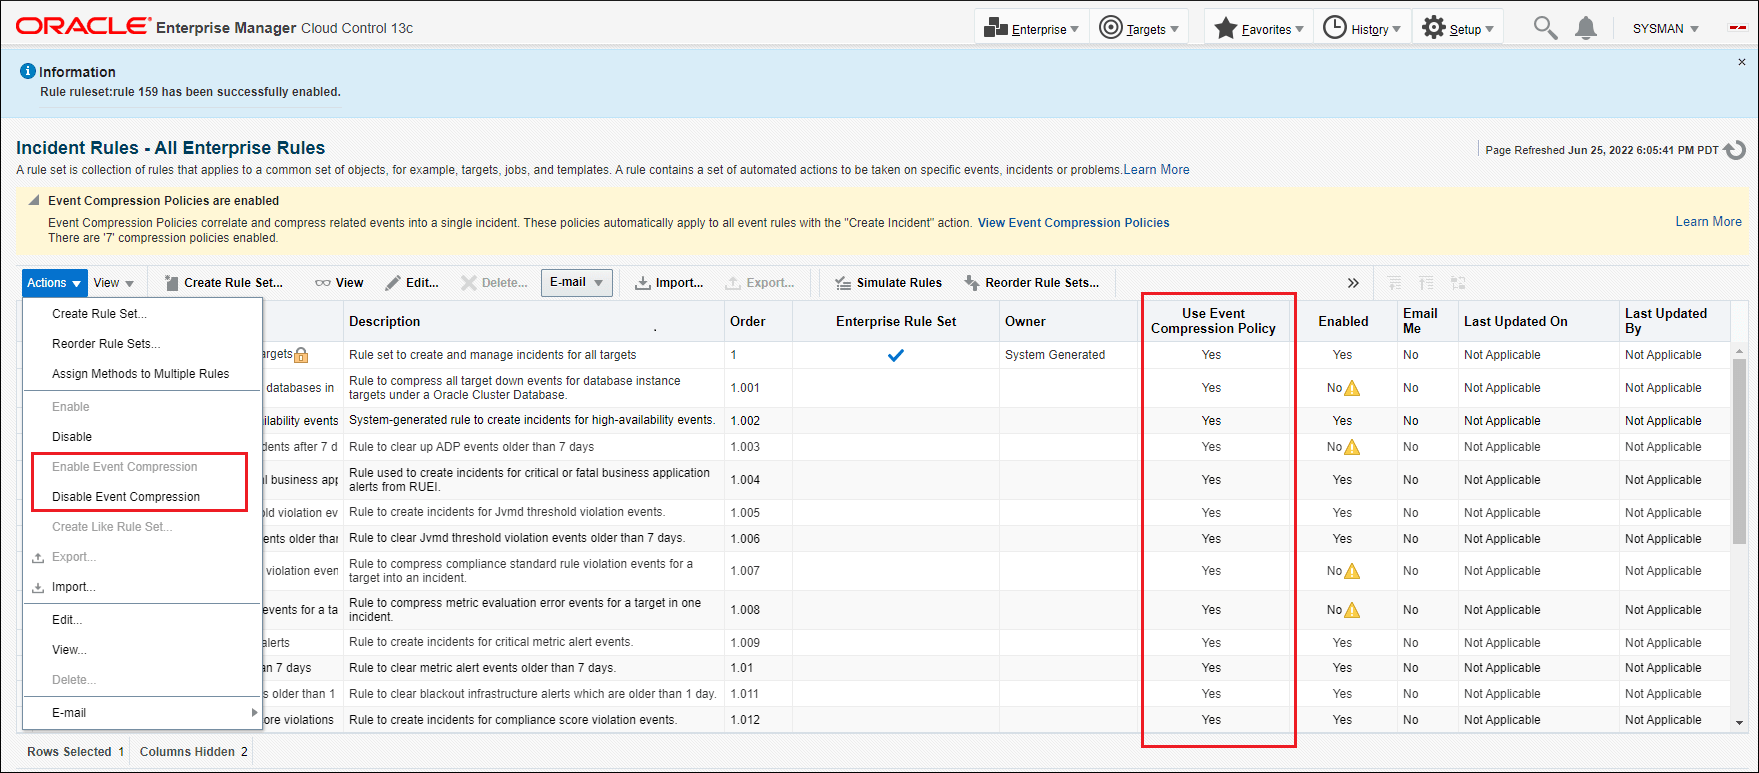
You can enable/disable Event Compression policies for specific rules in different Rule Sets from the Incident Rules-All Enterprise Rules page.
From the Enterprise Manager console, click Setup, then Incidents, and then select Incident Rules. The Incident Rules - All Enterprise Rules page displays.
- Select a rule set and click on an individual rule in the table.
- From the Actions menu, select Enable Event Compression or, if
disabling a compression policy, select Disable Event Compression.
Enabling Event Compression Policies for Rules in an Individual Rule Set
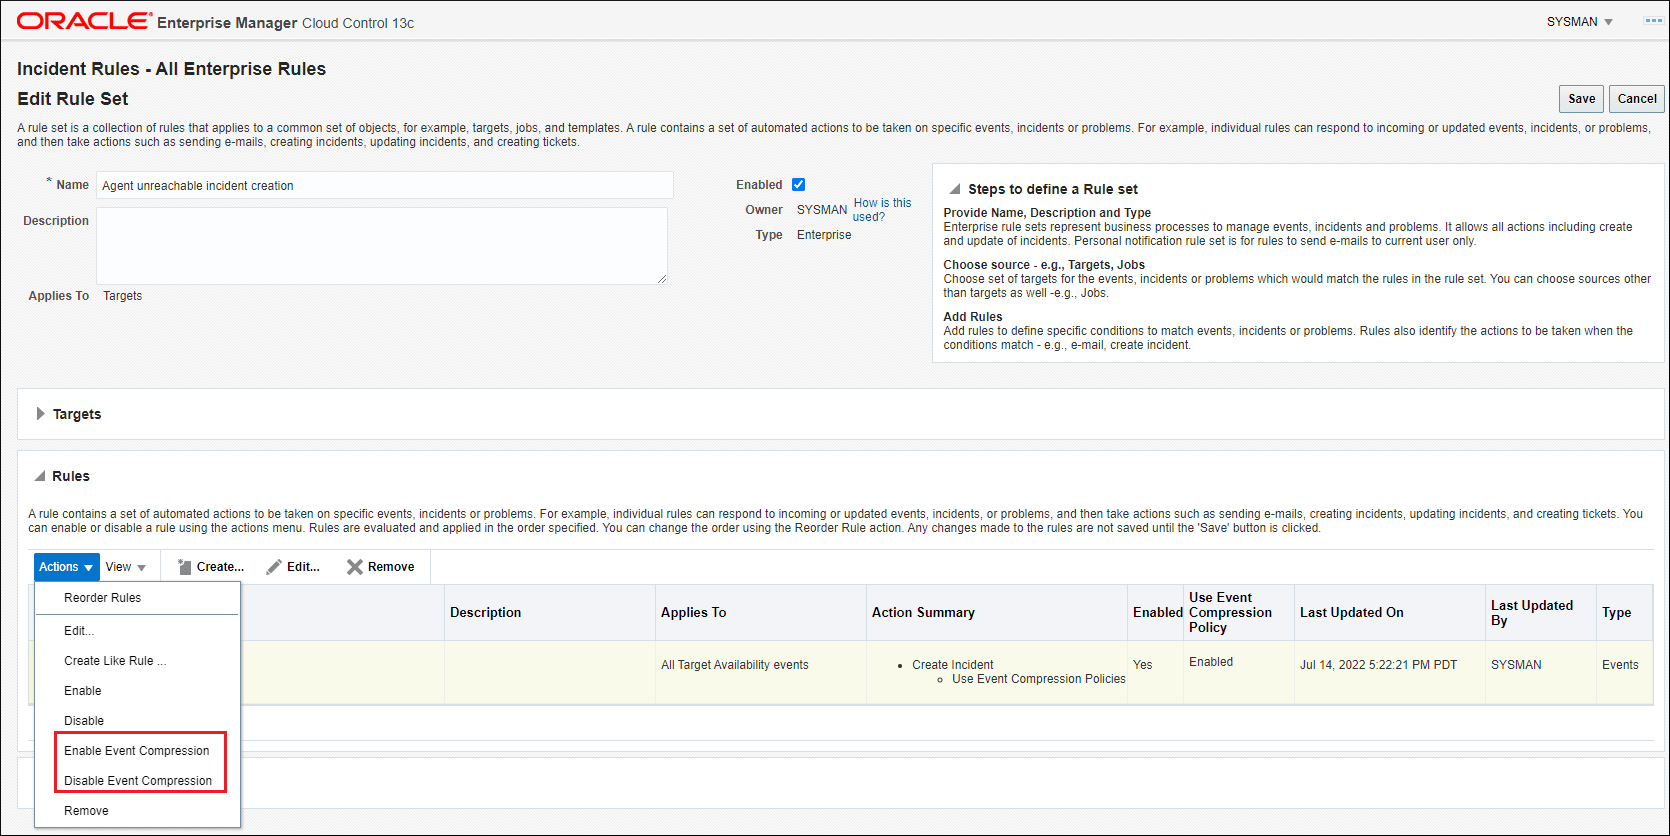
You can also enable/disable Event Compression Policies for rules within a Rule Set.
From the Enterprise Manager console, click Setup, then Incidents, and then select Incident Rules. The Incident Rules - All Enterprise Rules page displays.
- Click on an individual rule or rule set in the table.
- Click Edit in the menu bar. The Edit Rule Set page displays.
- Select a rule from the Rules region.
- From the Actions menu, select Enable Event
Compression or, if disabling a compression policy, select Disable
Event Compression.
Showing Incidents with Compressed Events in Incident Manager
The Incident Manager UI provides direct access to Event Compression details for a given incident.
- From the Enterprise menu, select Monitoring and then Incident Manager. The Incident Manager dashboard displays.
- Select an incident with multiple events. Incident Details
are displayed showing the number of events that have been compressed.
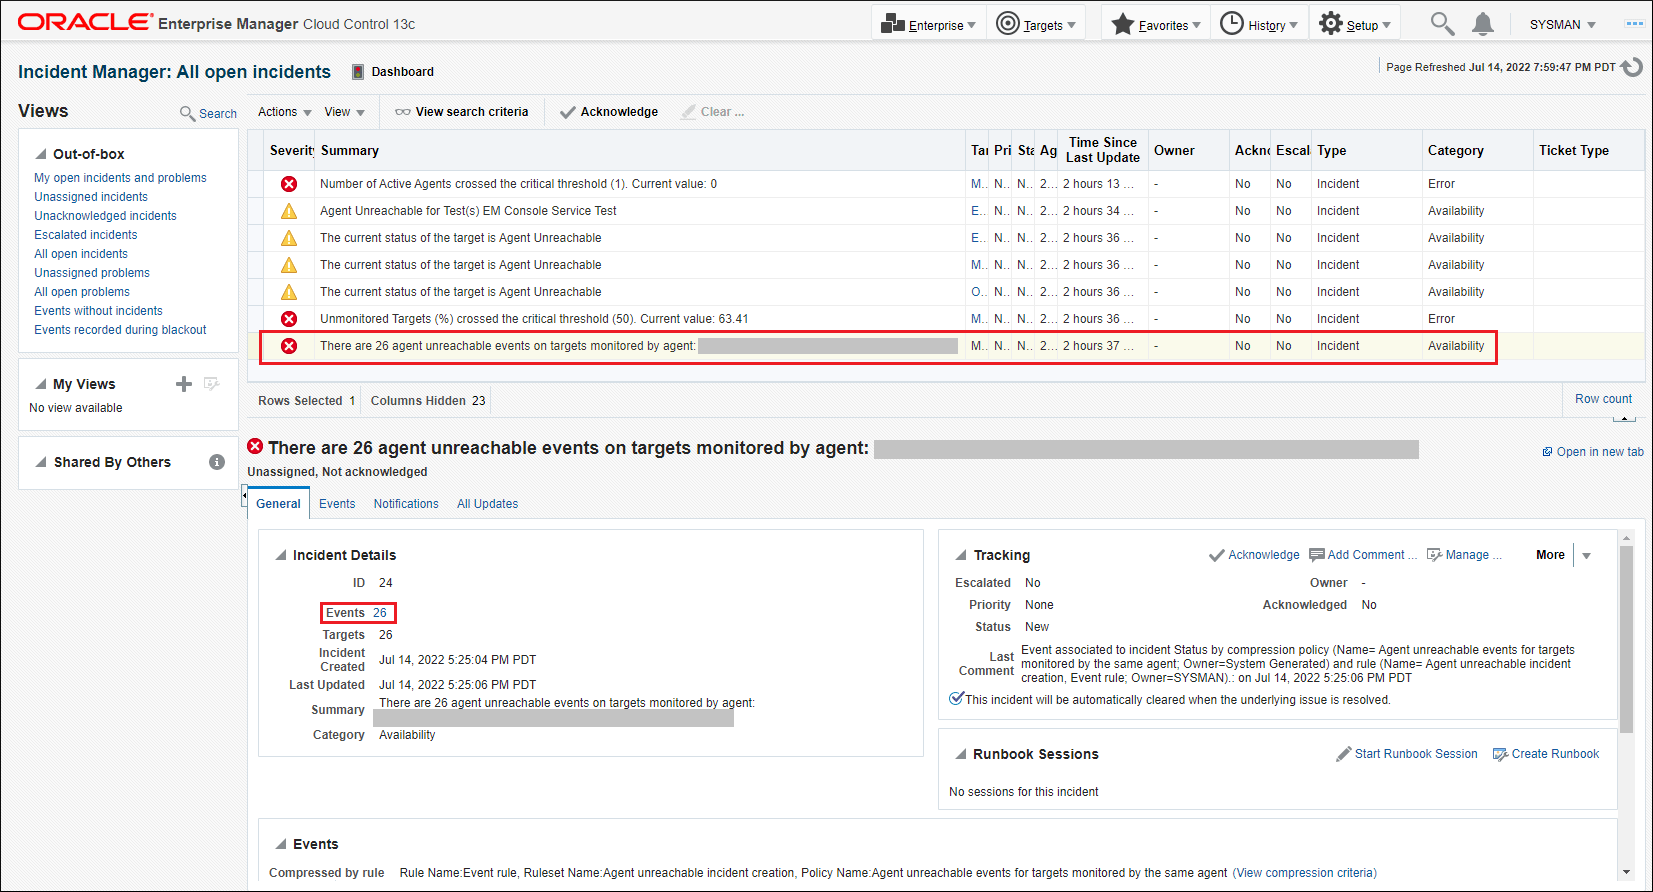
- In the General tab, scroll down to the Events region. This
region displays the triggered events within the incident.
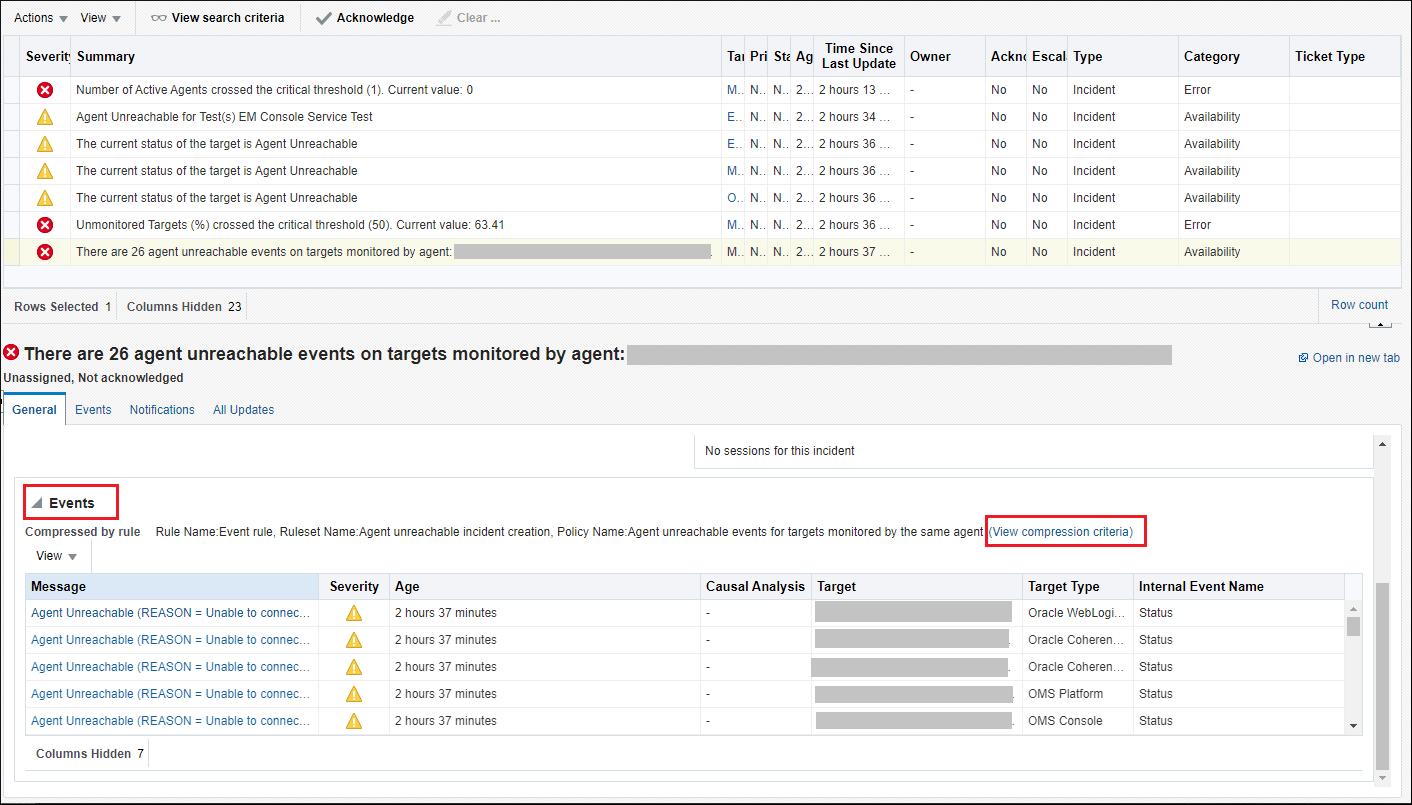
- Click View compression criteria. The Compression
Criteria dialog is displayed showing the compression criteria used to
group the events into a single incident.

- Click OK to close the dialog.
- Click on the Events tab to view a more detailed view of the compressed events
for the incident.
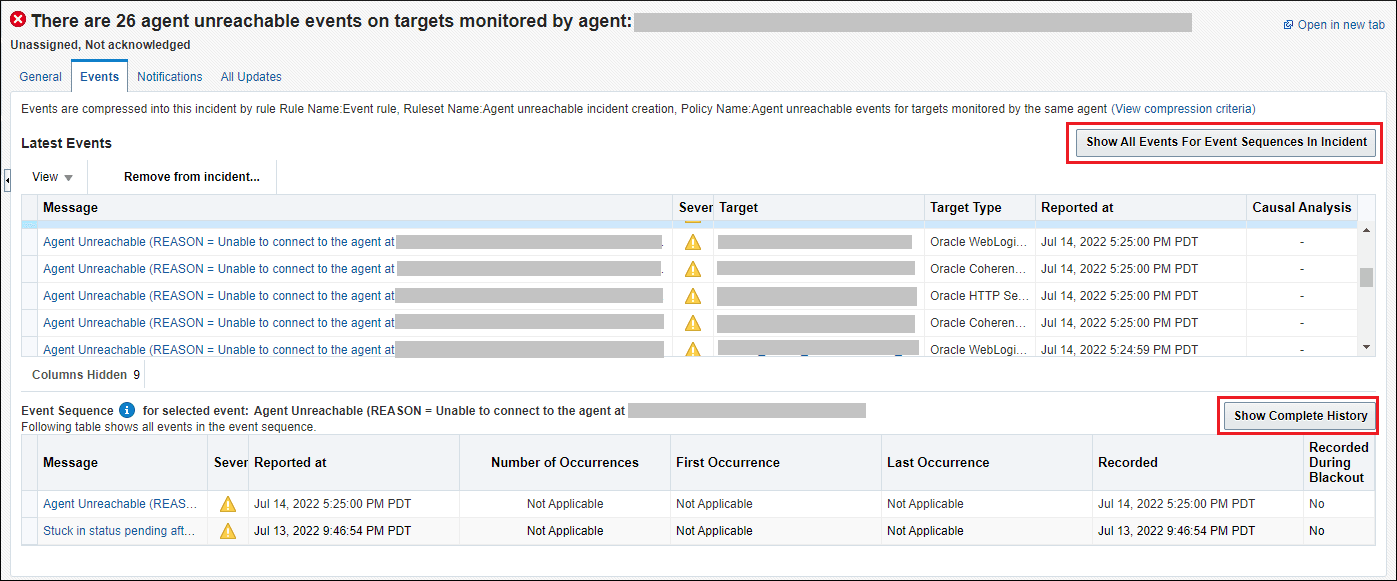
You can:
- Show all events for event sequences in the incident. You can choose to show events in the current sequence or show the complete history of the event sequence.
- Show only the latest events.
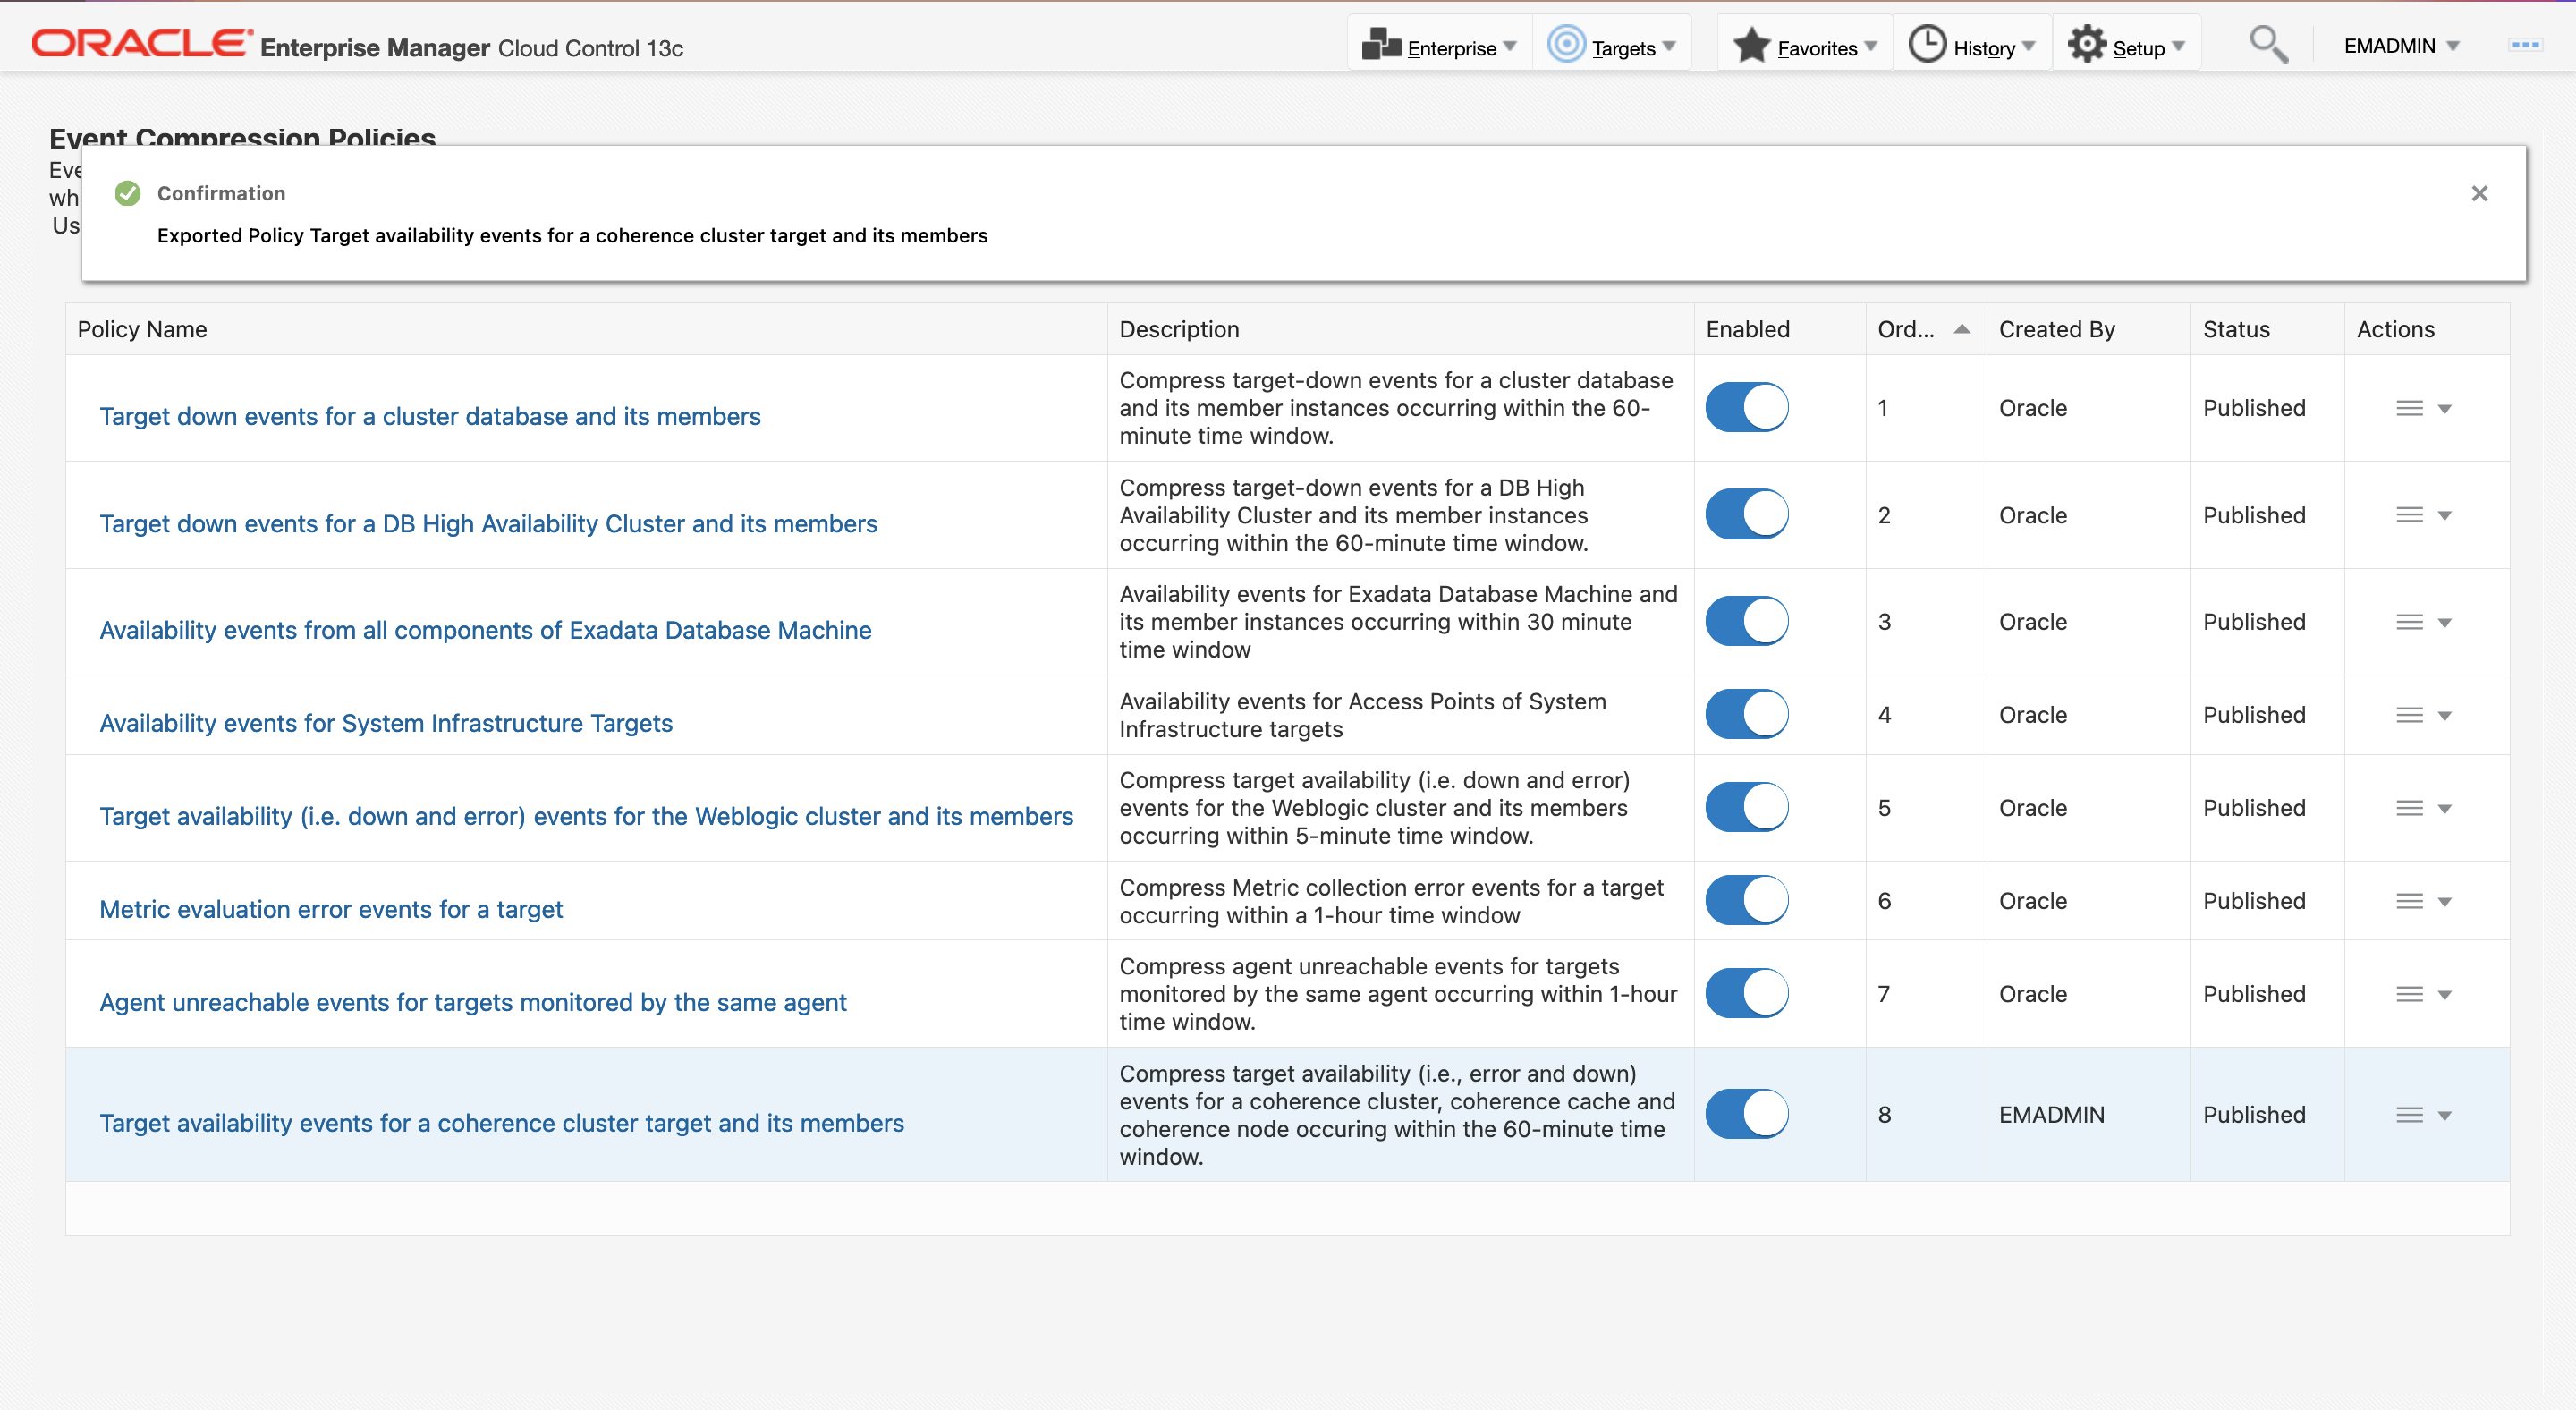
Importing or Exporting Event Compression Policies
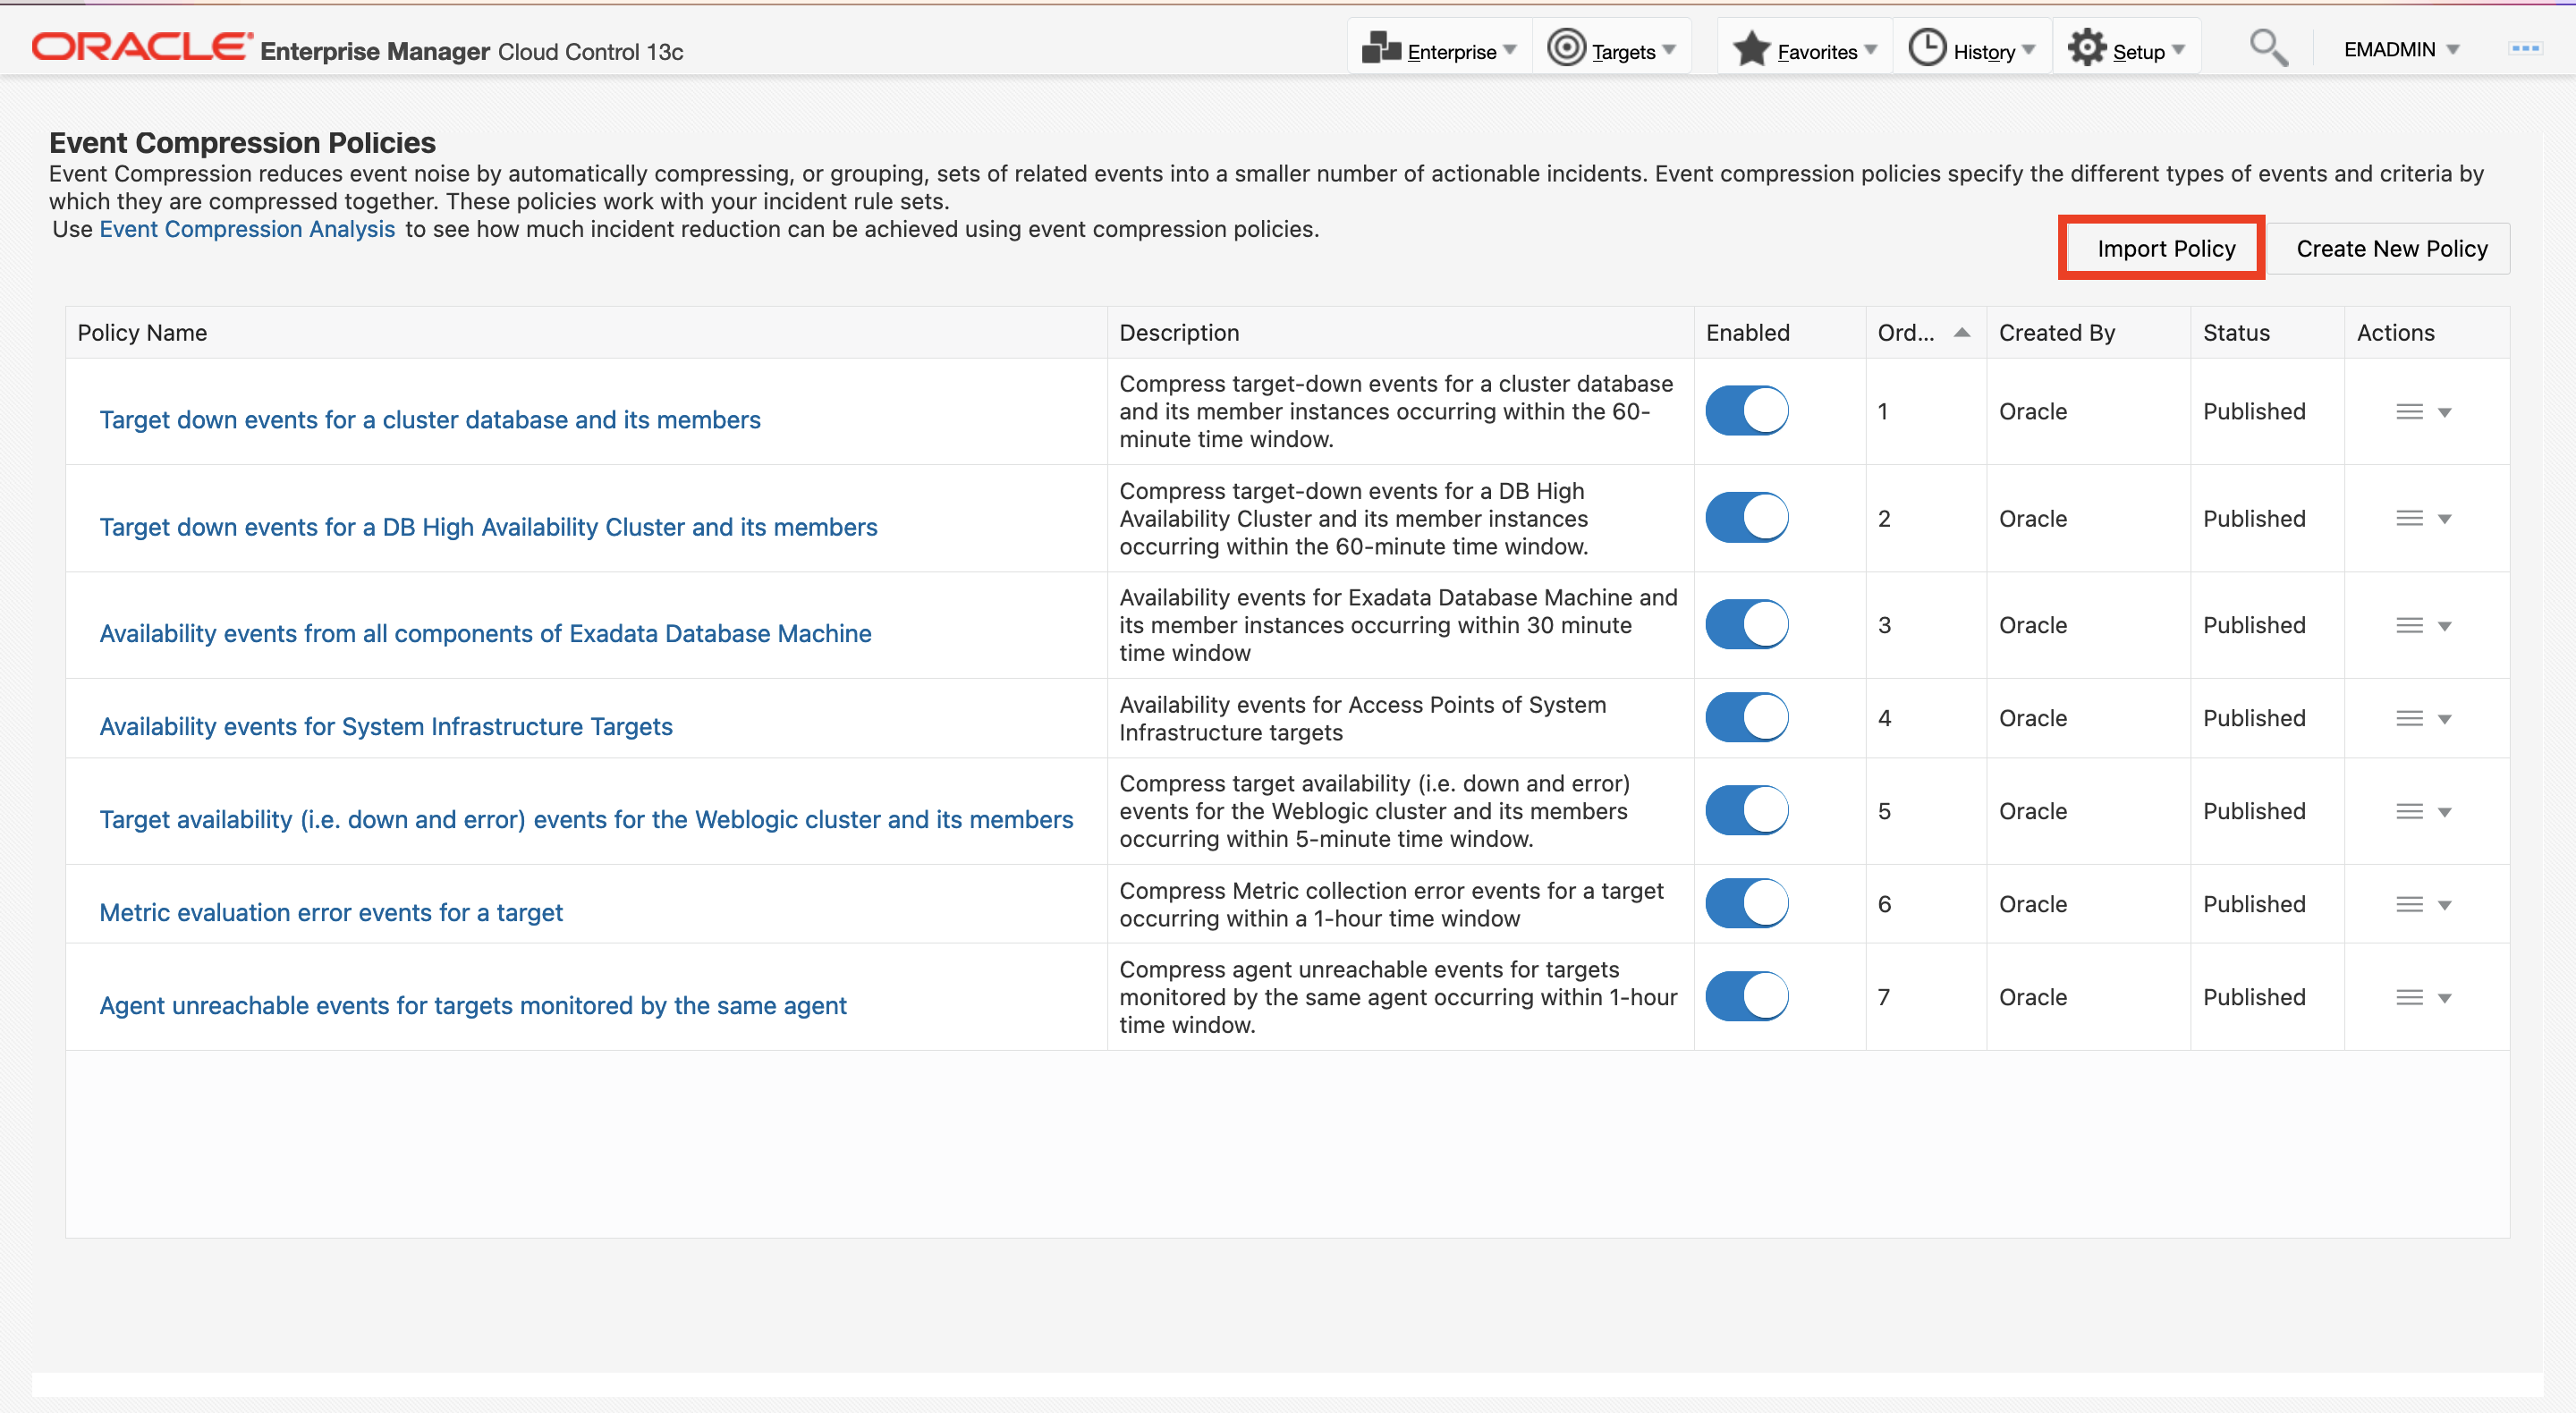
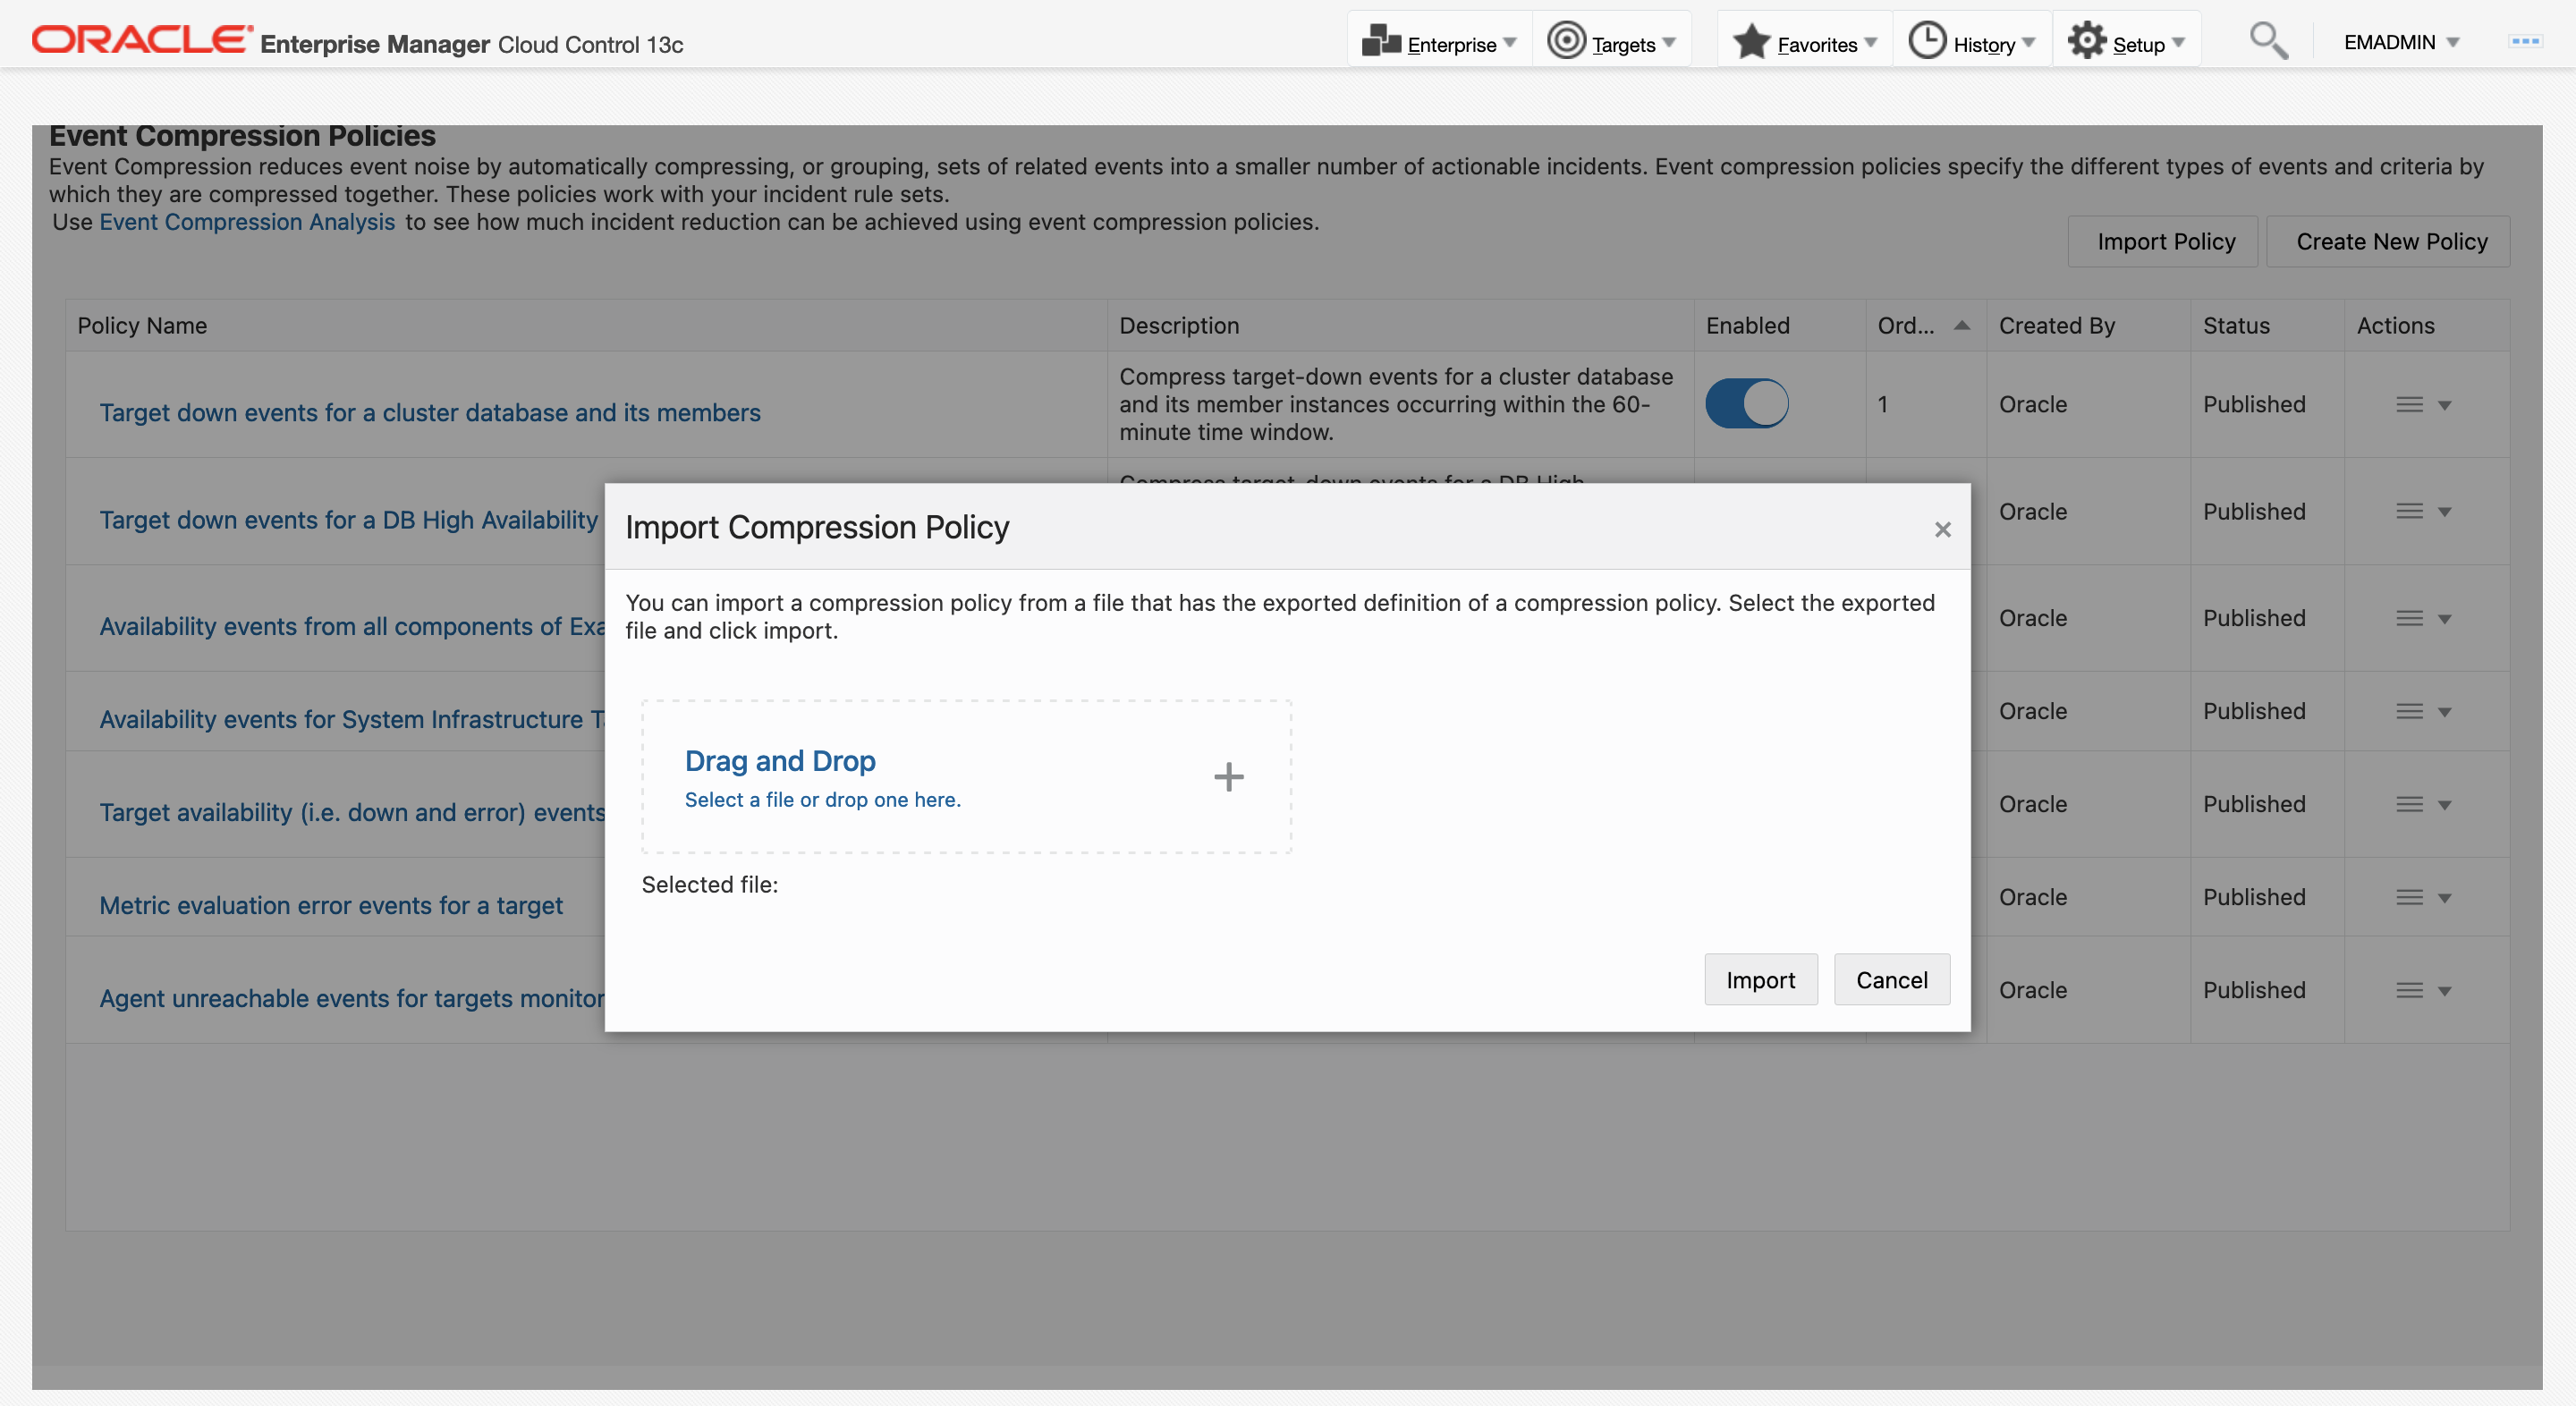
Import/Export feature in user defined compression policies enables users to export compression policies which are created by users where the policy details will be exported as a json file, similarly user can also create a compression policy by importing compression policies where the importing file must be in json format.
To import a compression policy from a json file:
-
Click the Import Policy button at the top right of the table.
-
Select a file or drop one in the dialog box.
-
Check the import status.
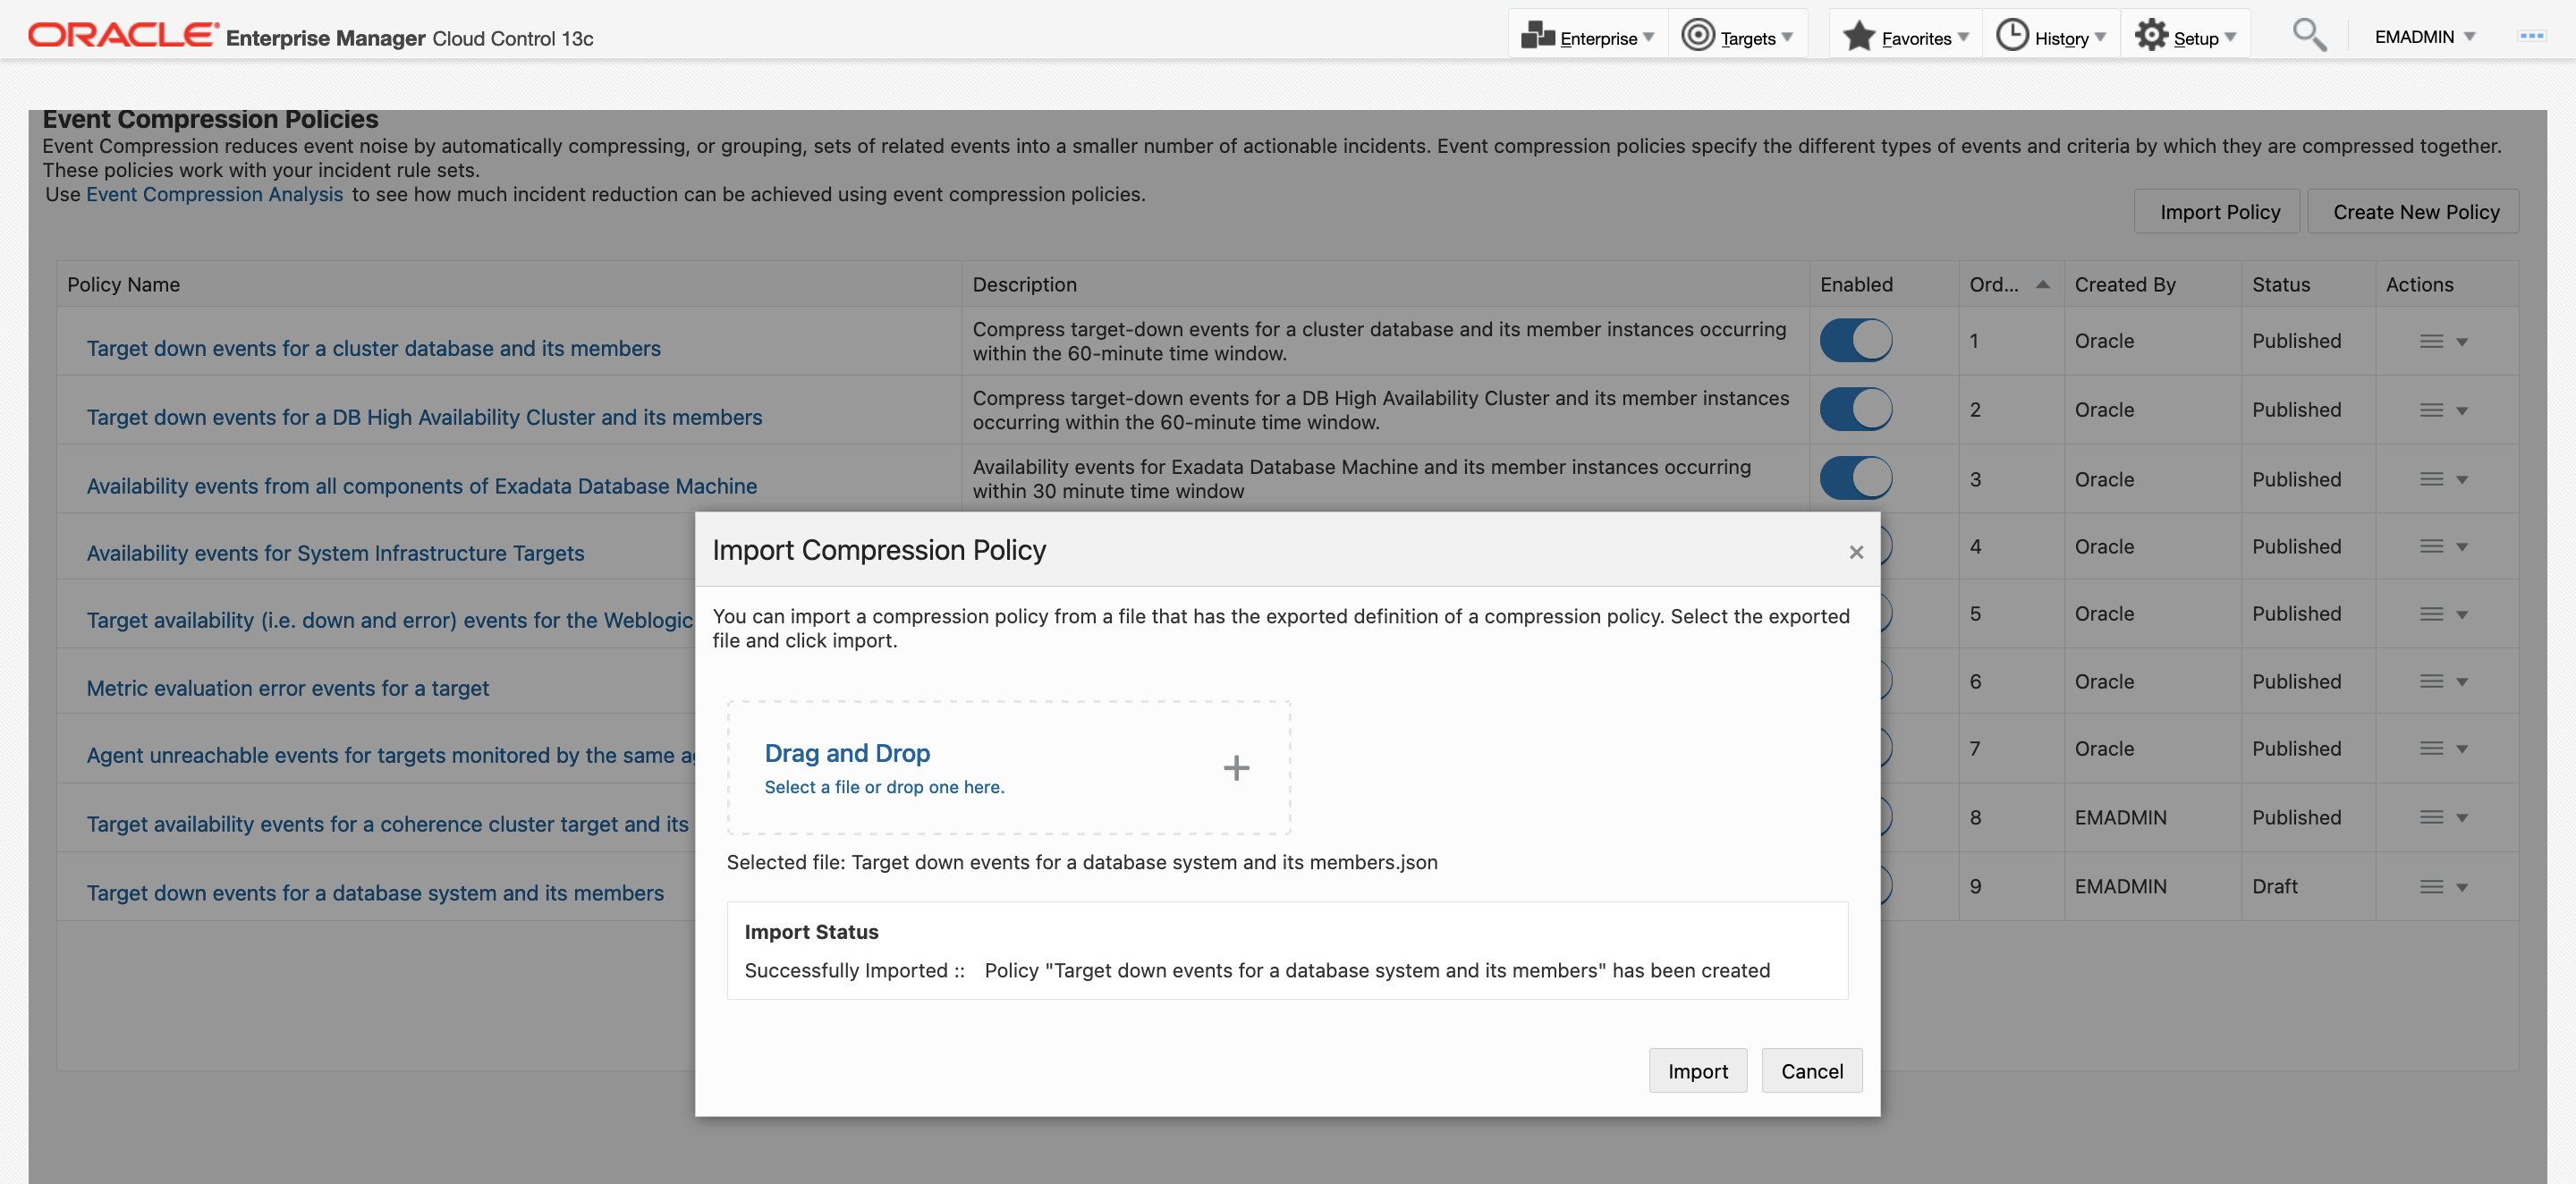
- If the Import Status is Successfully Imported, click Import
To export a compression policy to a json file:
-
Open the drop-down Actions menu of the policy you want to export and click Export.
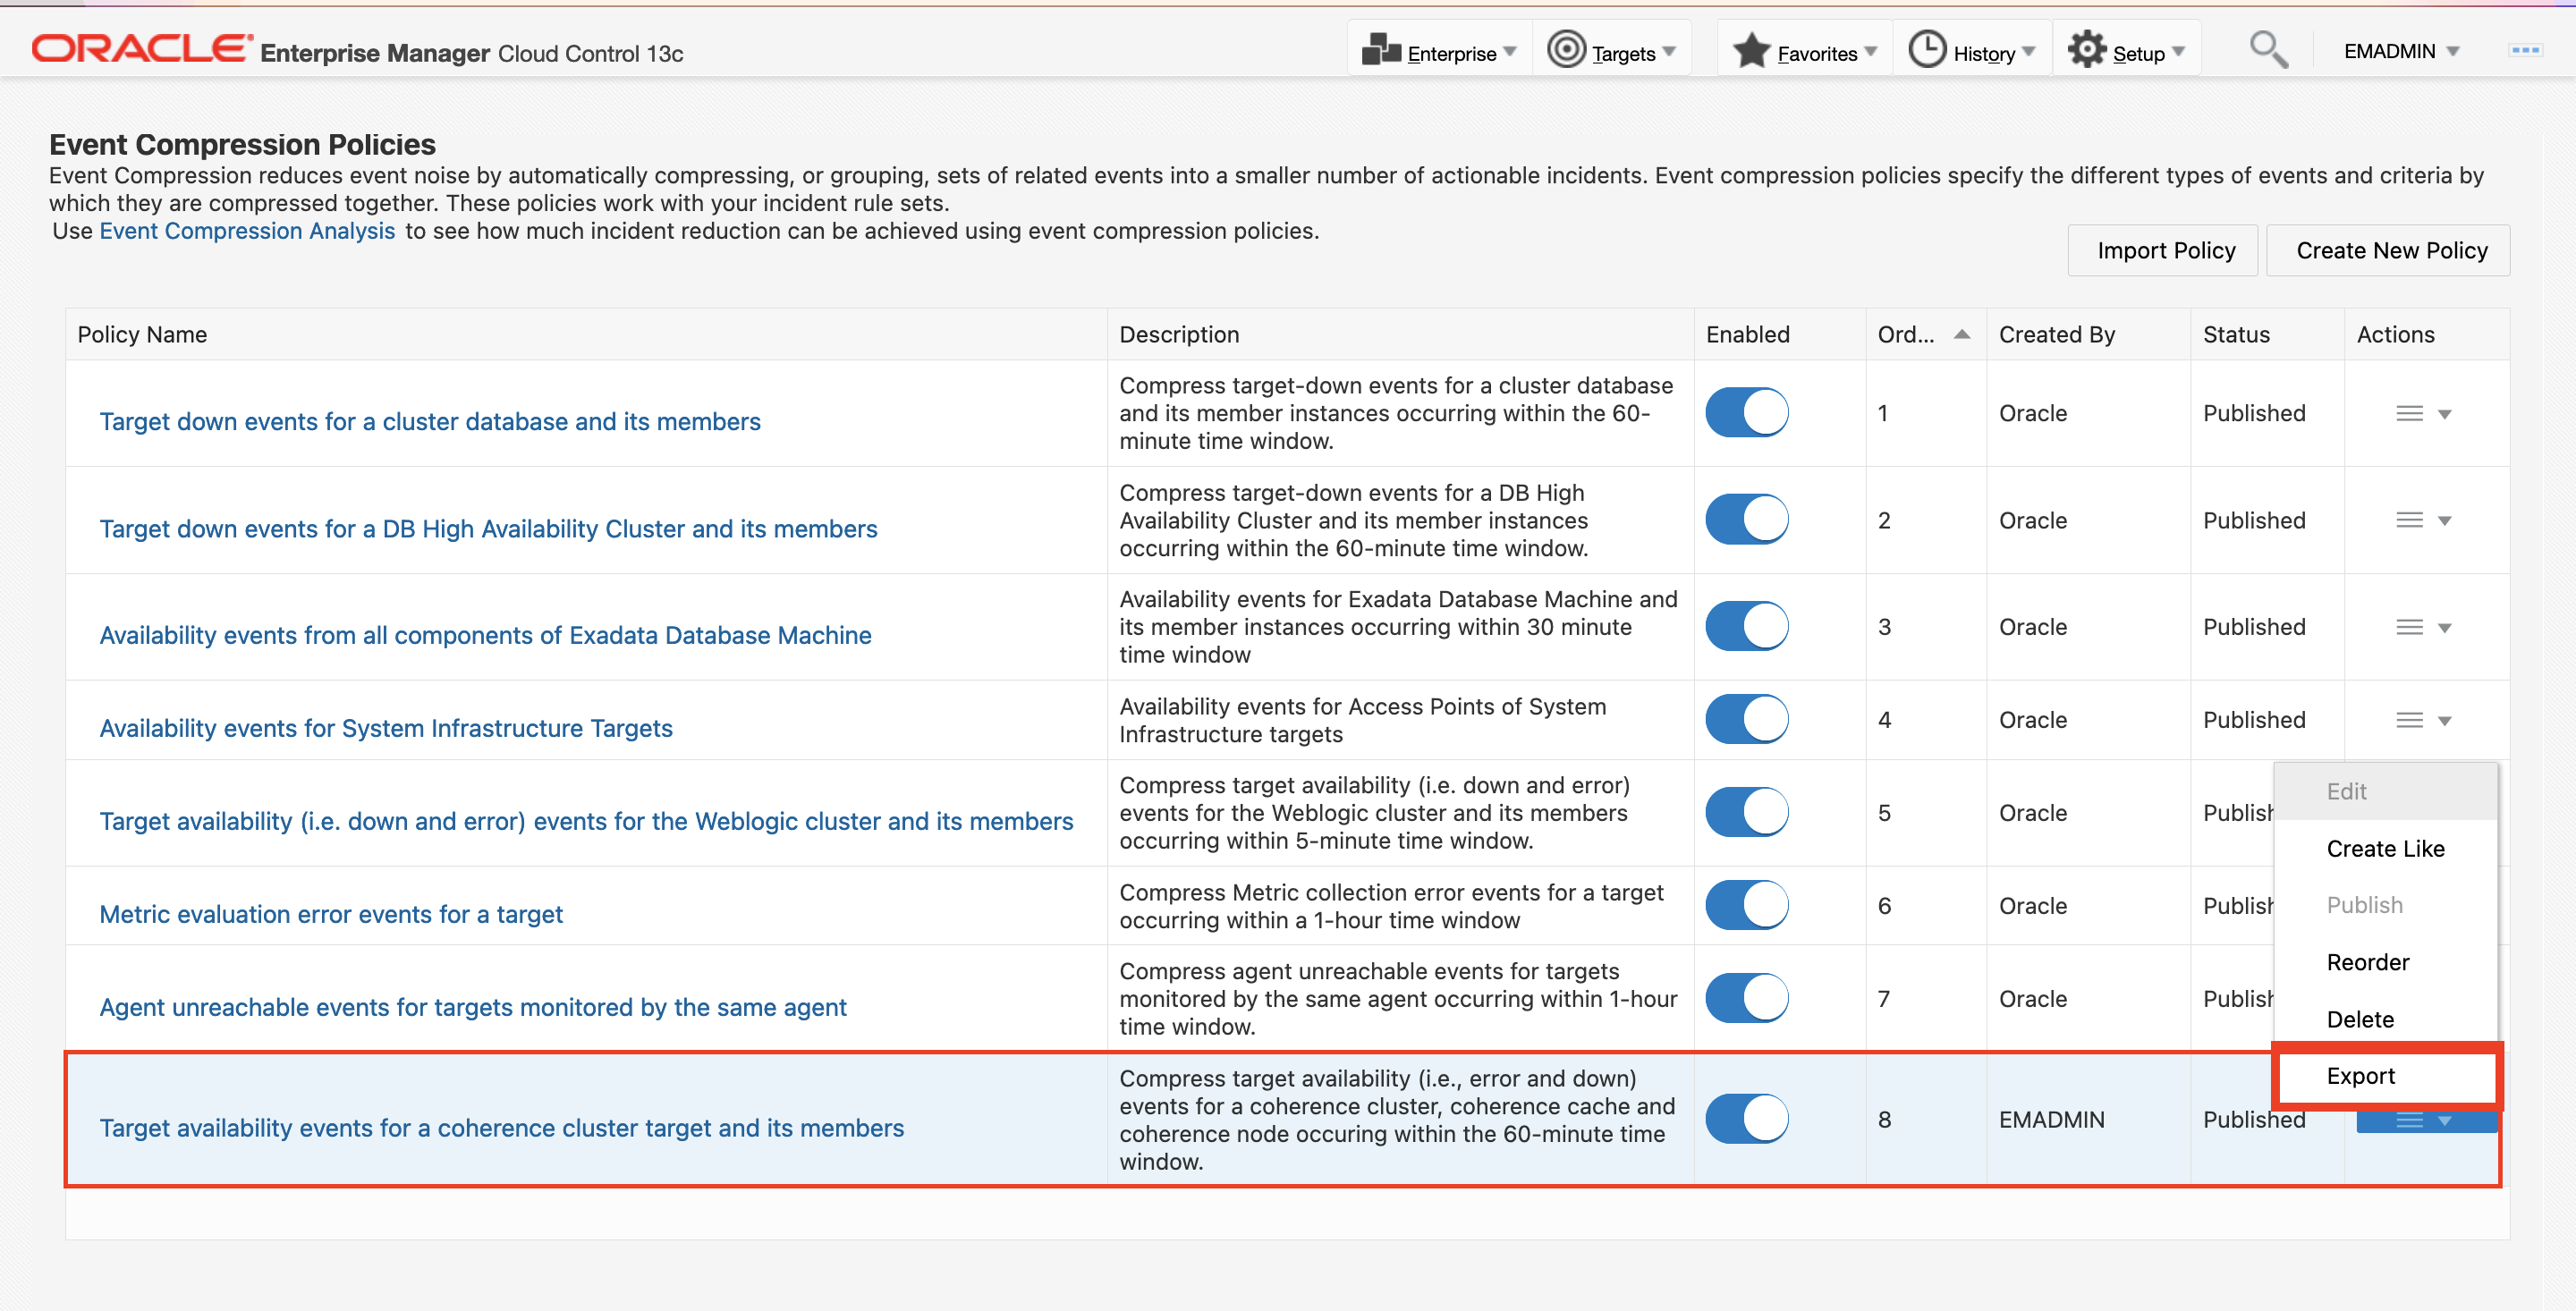
-
Enter the a file name, and click Ok.
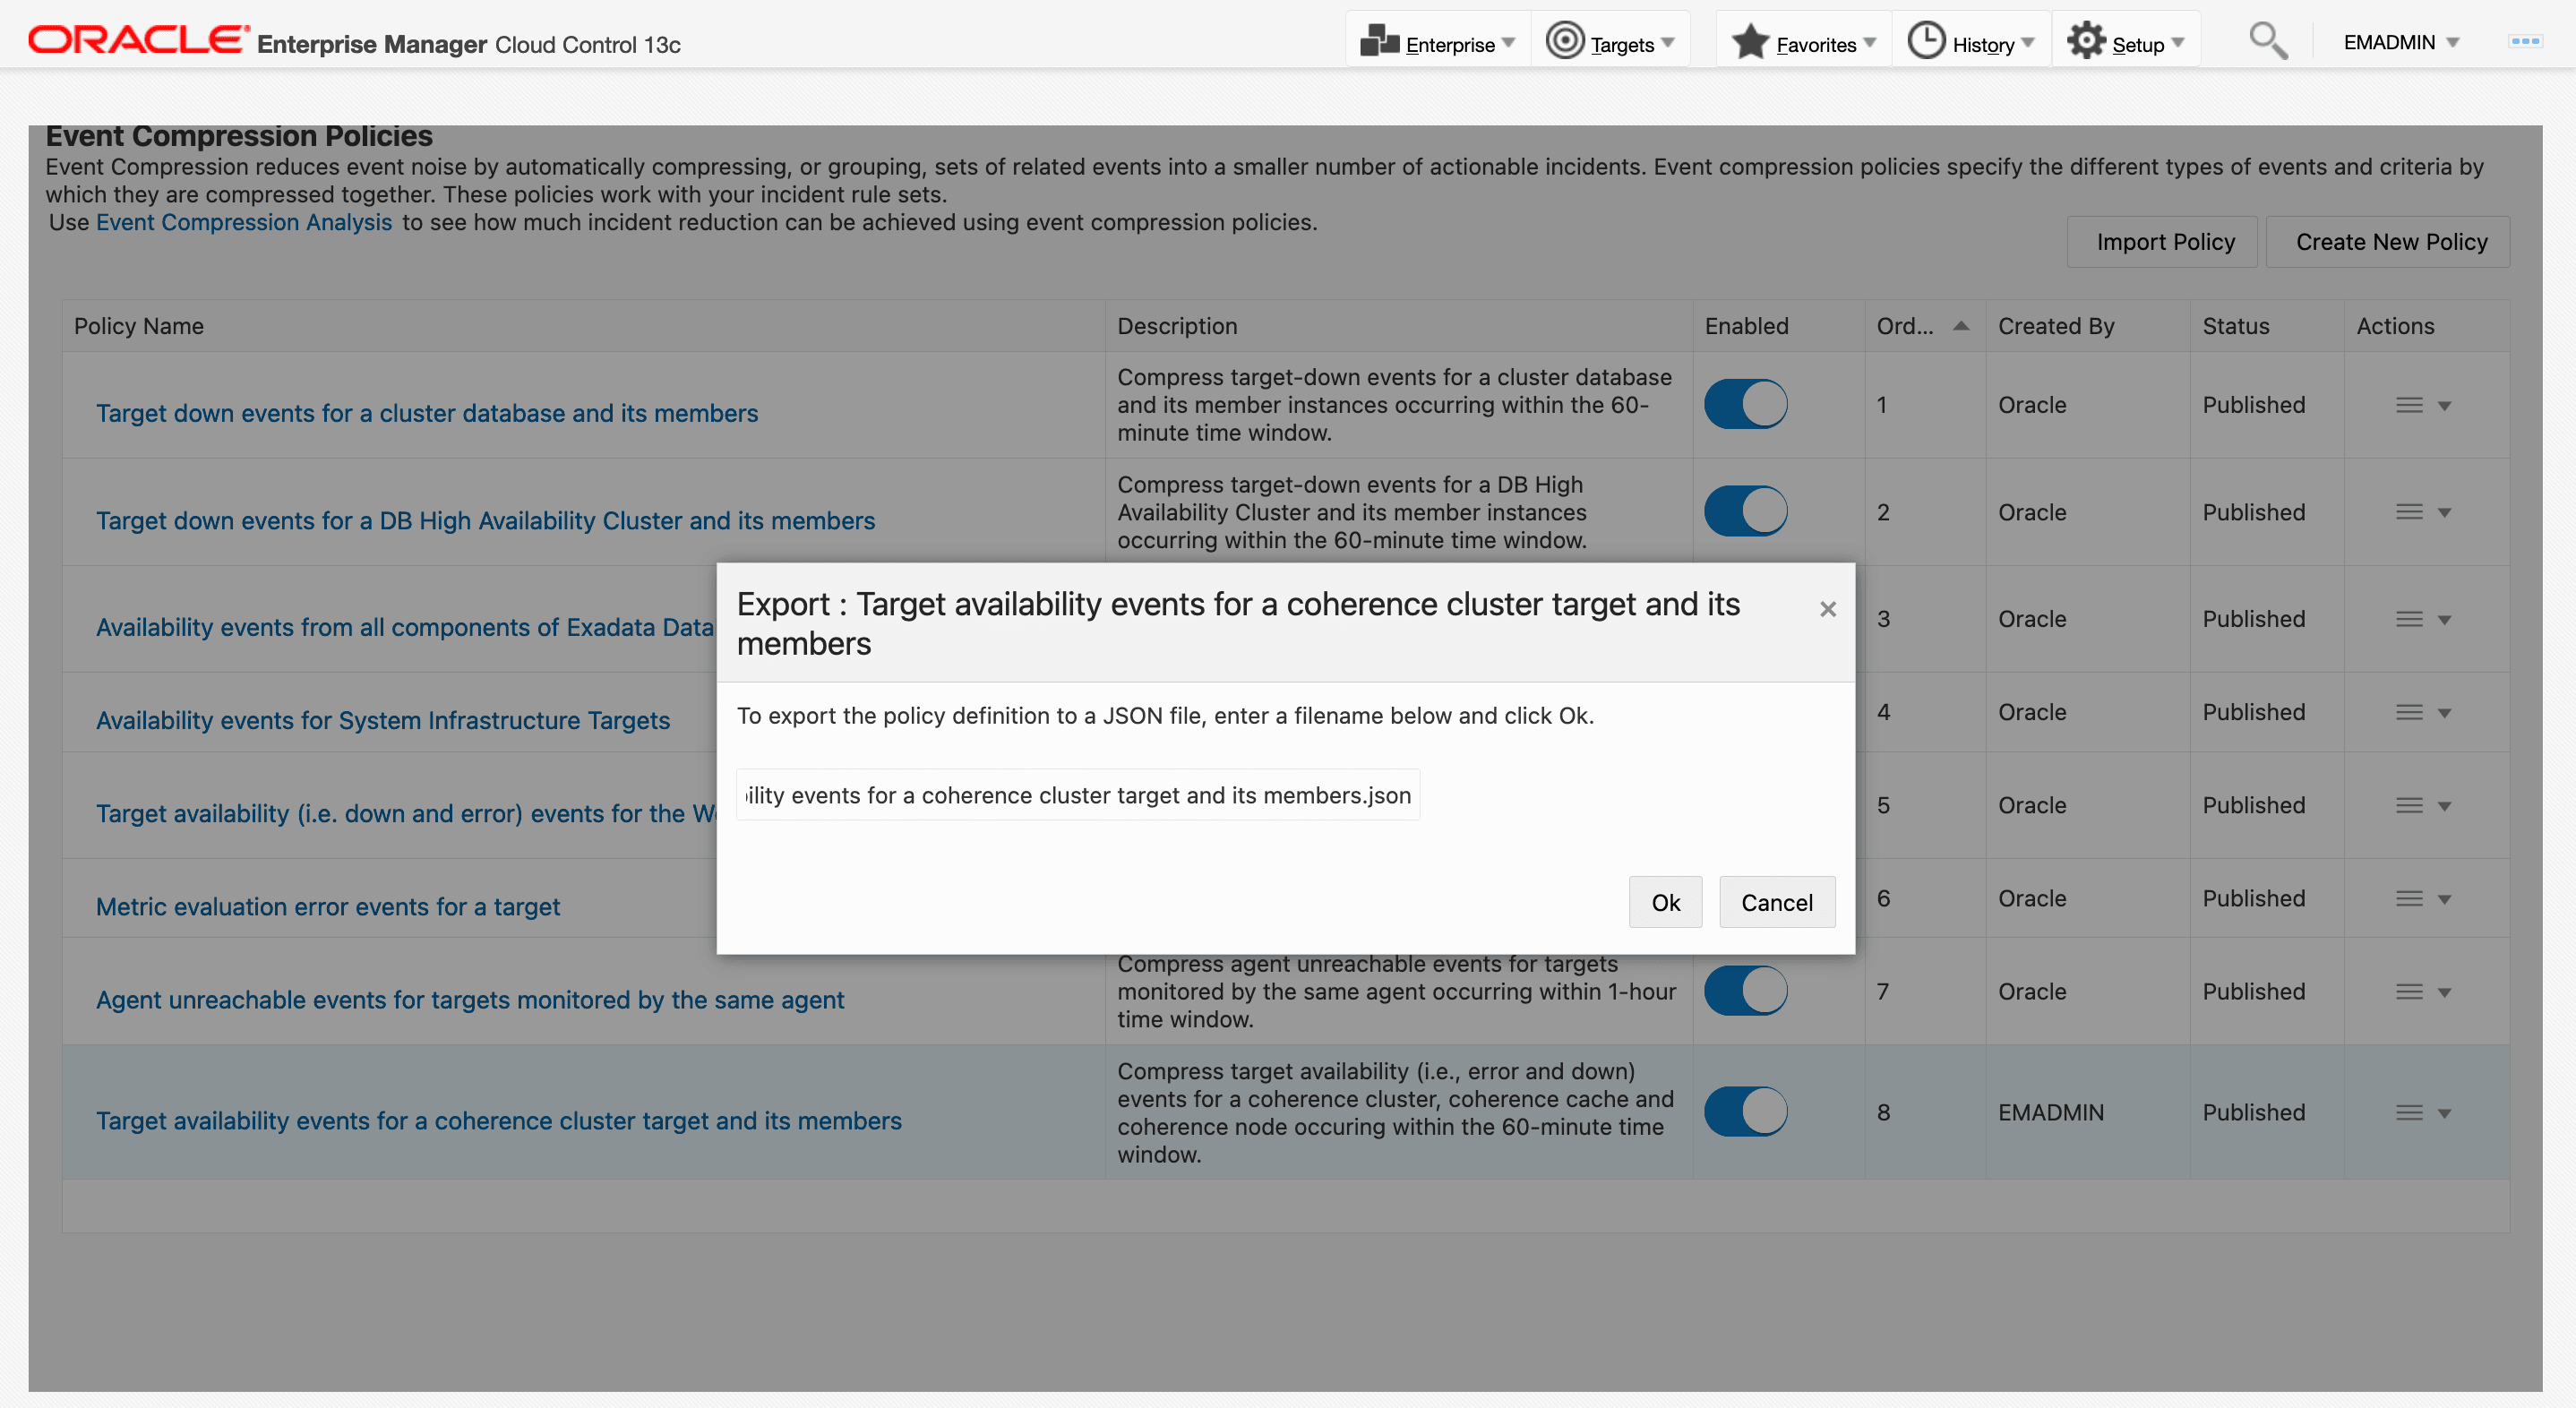
-
After the policy is successfully exported a confirmation pop-up will show.
