Visualize Resource Usage for Exadata Infrastructure
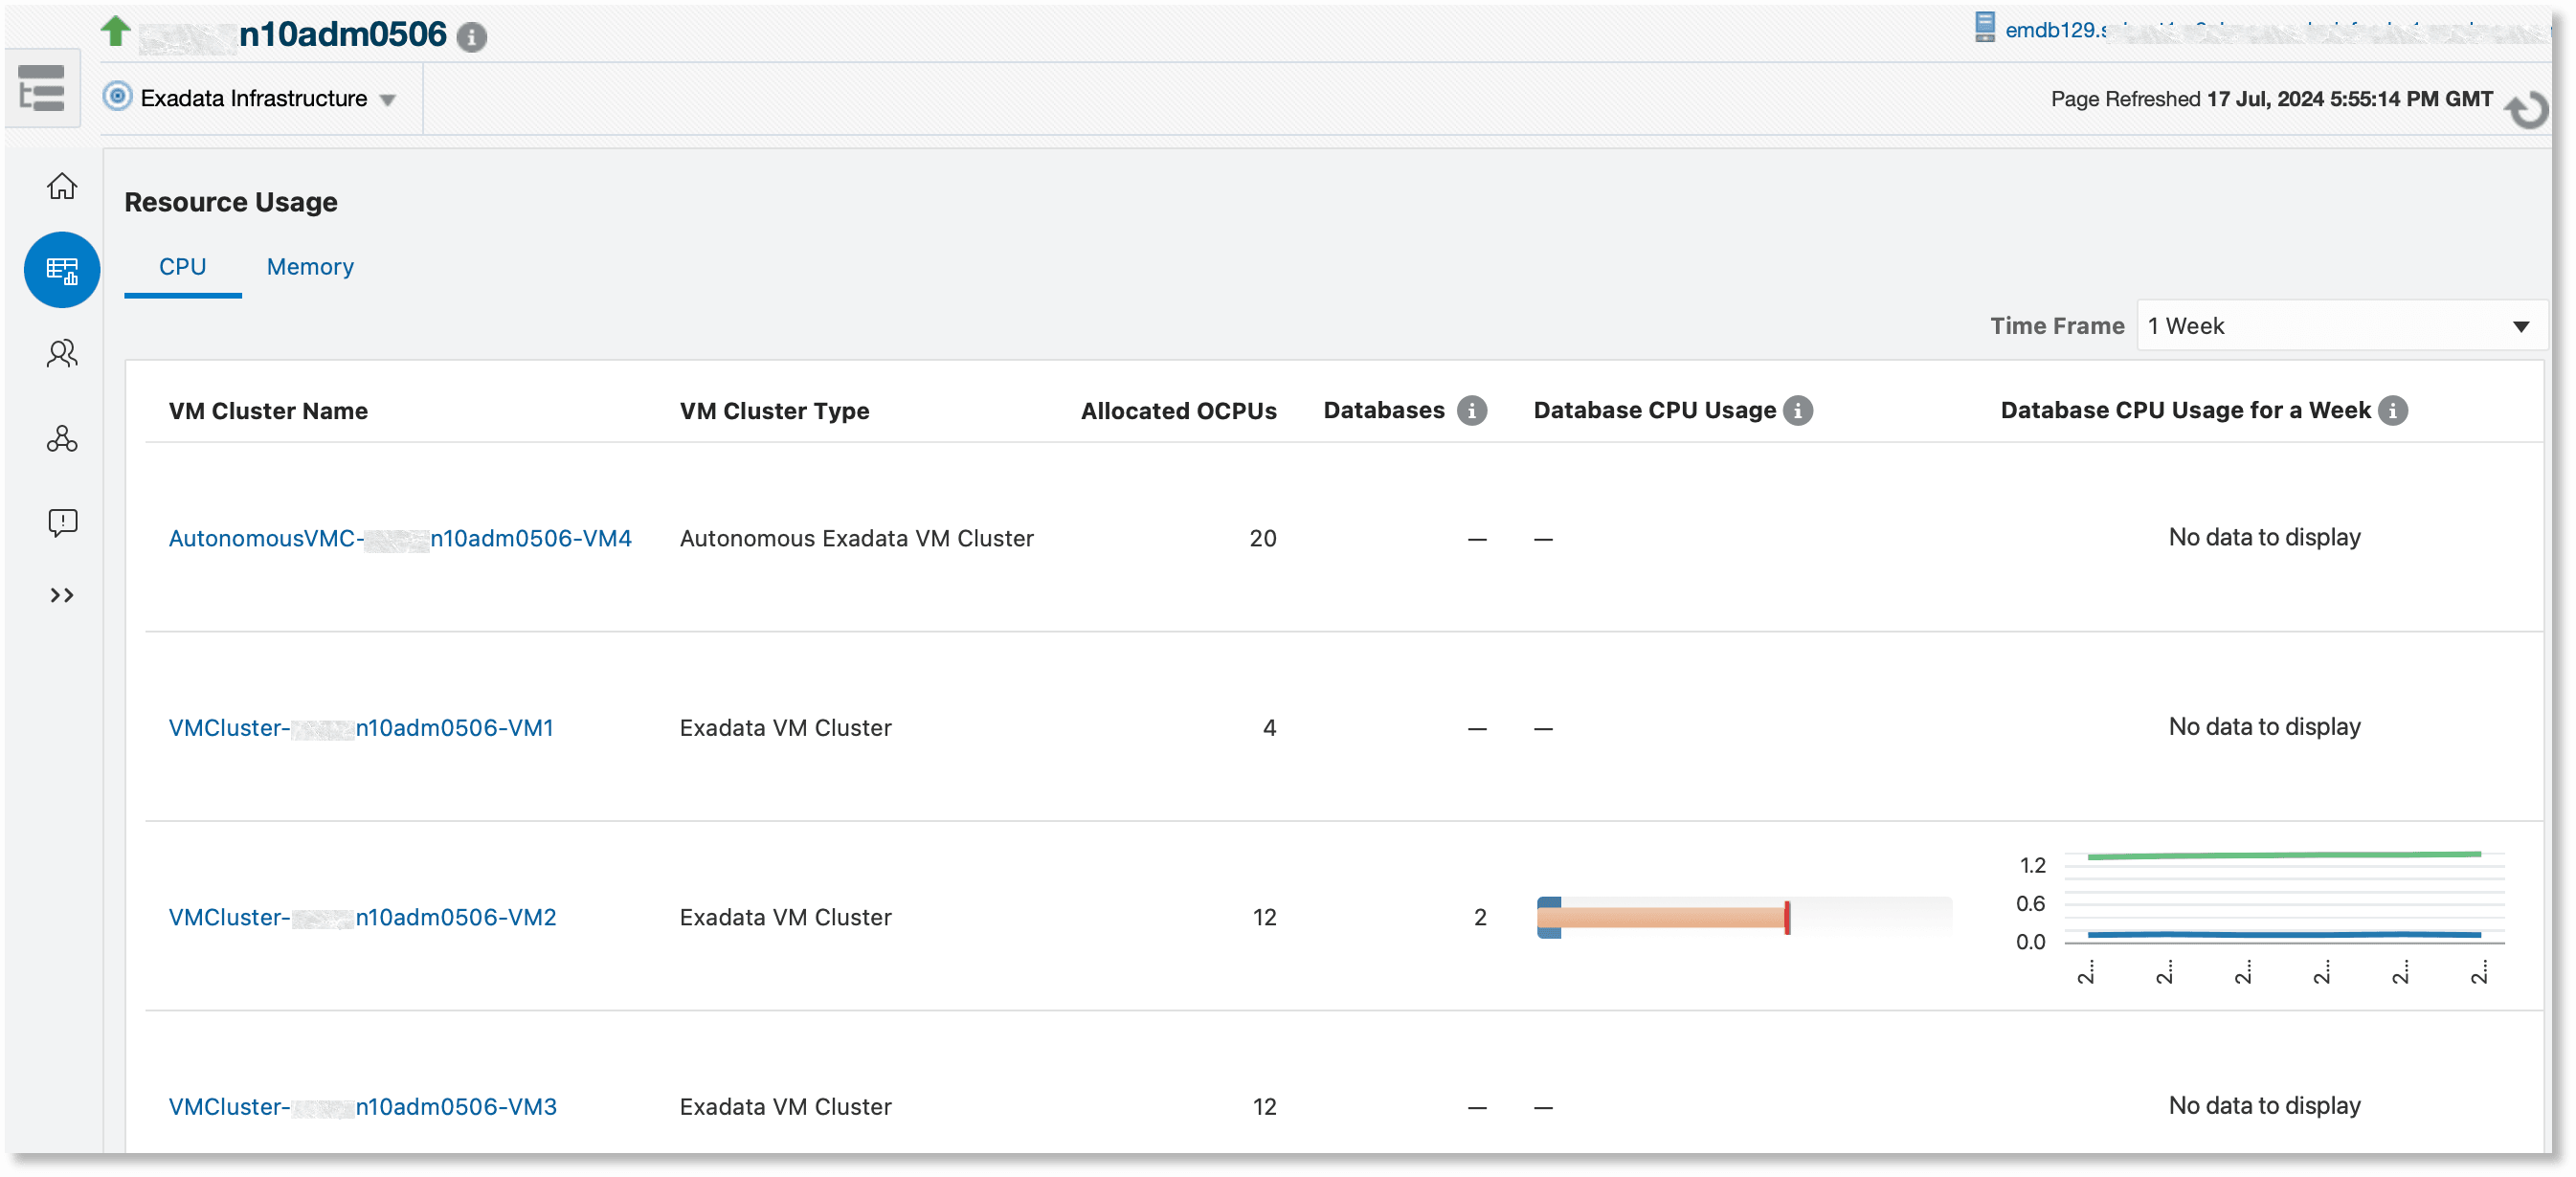
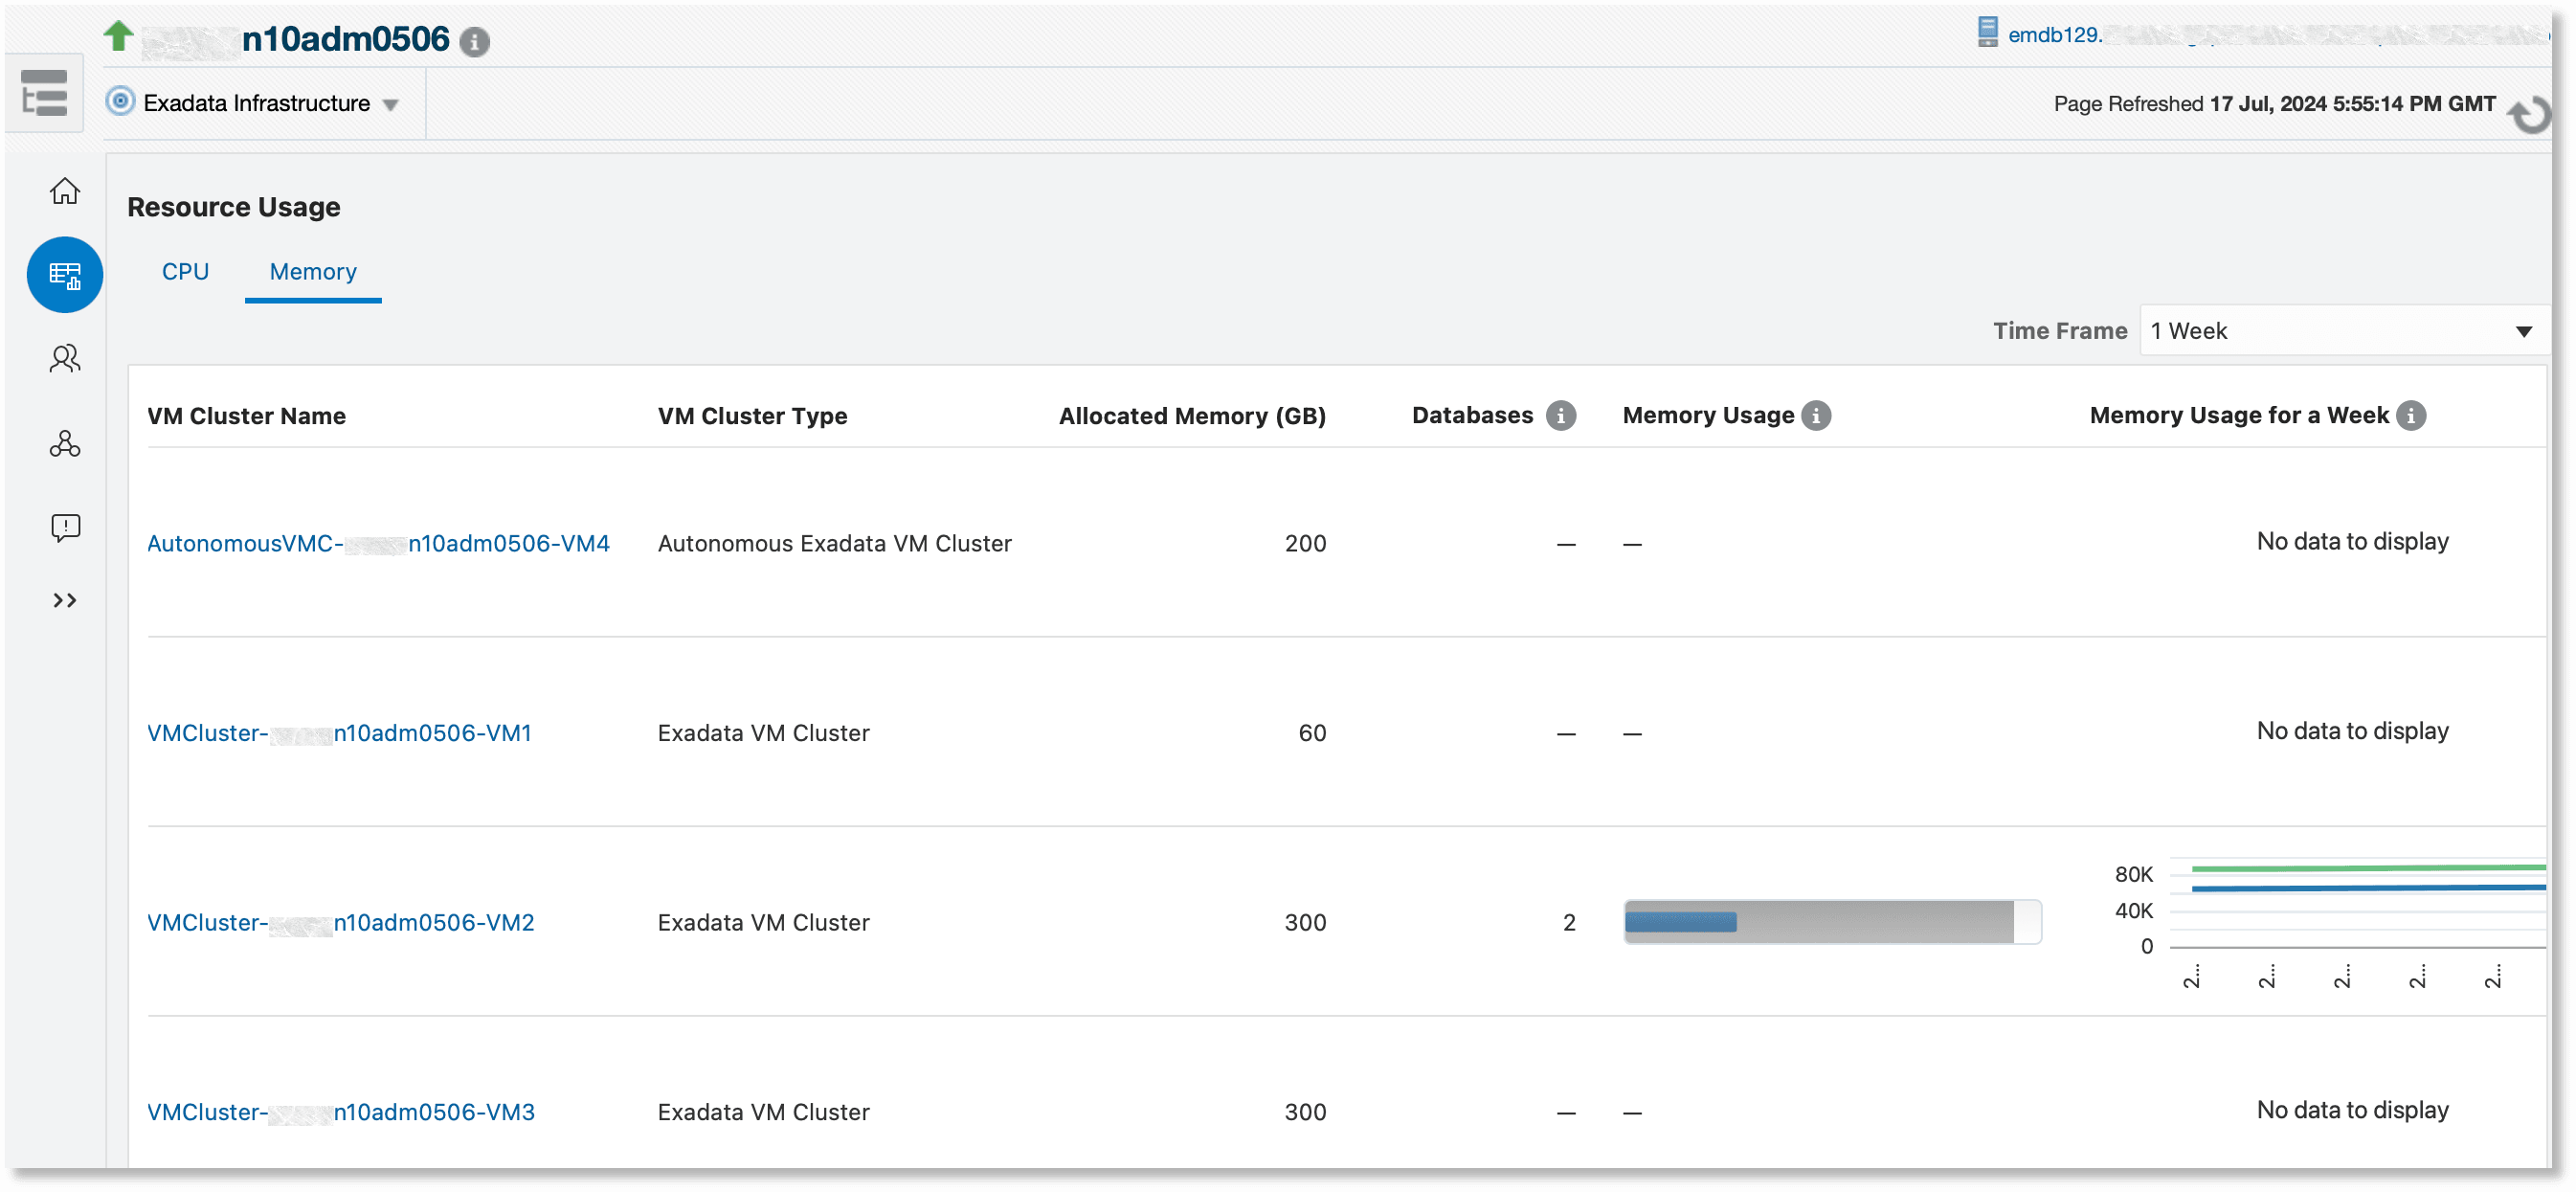
The Exadata Infrastructure target home page includes additional monitoring features in the Resource Usage tab when the Exadata Management Pack is enabled for the Exadata Infrastructure target. The tables in the CPU and Memory sub-tabs provide graphical usage visualizations in the last two usage-related columns for the selected time range.
Topics:
To ensure that the visualizations provide a holistic picture of database CPU and memory usage, ensure that all the hosts and databases on the Exadata Infrastructure are discovered. These features are not available for Autonomous VM clusters. See Monitor Exadata Cloud Service in Oracle Enterprise Manager Cloud Control for Oracle Exadata Cloud.

Monitoring Database CPU Usage
In the table on the CPU sub-tab, the Database CPU Usage columns contain line charts corresponding to each VM Cluster that depict the historical CPU usage over the selected time interval:
- The X-axis represents the time interval.
- The Y-axis represents the CPU usage.
- The blue line represents the average CPU usage of all databases across all hosts in the VM cluster.
- The green line represents the average CPU usage of all hosts in the VM cluster.

These charts can be customized to display CPU usage for the selected time period. Since the CPU usage is aggregated across all the components of the VM cluster, this chart can be used to compare CPU usage of the databases against the usage of other processes running on the system (such as application servers, business applications, and so on) that could potentially impact database performance. These charts facilitate analysis of relative historical trends and patterns in CPU consumption, providing insights into how resource usage fluctuates over time. They can also aid consolidation planning by helping to identify periods when CPU usage is concurrently high or low across VM clusters.
Database Memory Usage
In the table on the Memory sub-tab, the Memory Usage columns depict historical memory usage through line charts with the same characteristics as the CPU table described above.
