Exadata Exascale Advanced Monitoring
Advanced performance monitoring consists of an interactive Sankey-based illustration of IOPS allocations from the Exascale cluster down through vaults, storage pools and databases. The historical IOPS usage charts at the storage pool and vault levels allow granular IOPS usage analysis and identification of IOPS distribution issues at different levels. Advanced filtering options provide the ability to visually identify IOPS bottlenecks, view them in context with historical Exascale IOPS utilization, and adjust IOPS distribution for specific entities. These capabilities assist in maintaining maximum I/O performance for databases that use Exascale storage.
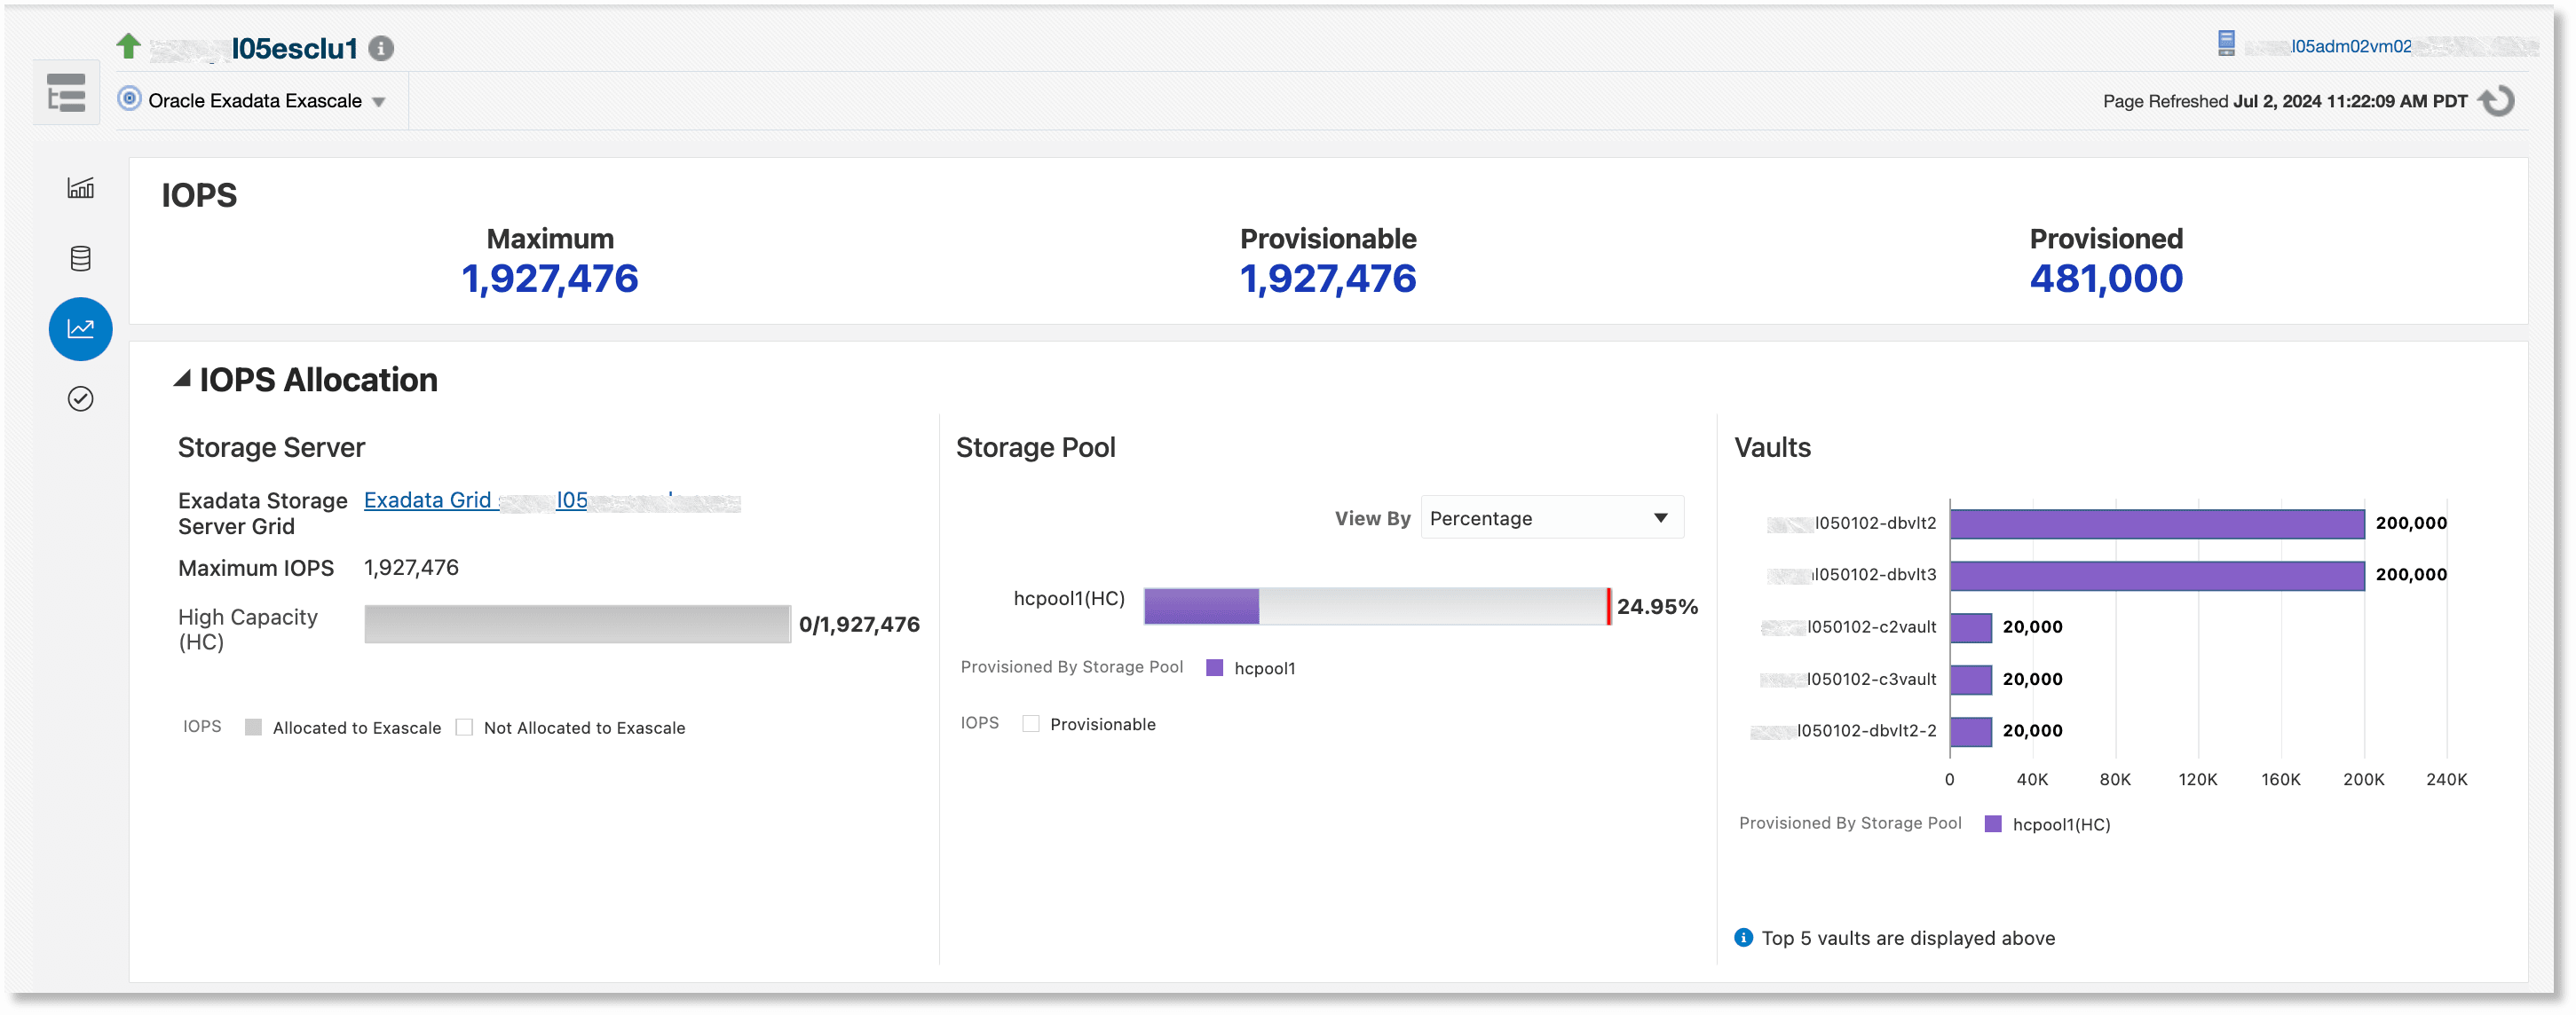
The Exascale home page Performance tab has two standard monitoring sections - IOPS and IOPS Allocation. For details, see Monitoring Exascale in Oracle Exadata Database Machine Getting Started Guide.

The Performance tab also offers advanced performance monitoring functionality that is part of the Exadata Management Pack. This advanced performance monitoring is available only if the pack is enabled for the Database Machine target that is the parent of the Exascale target.
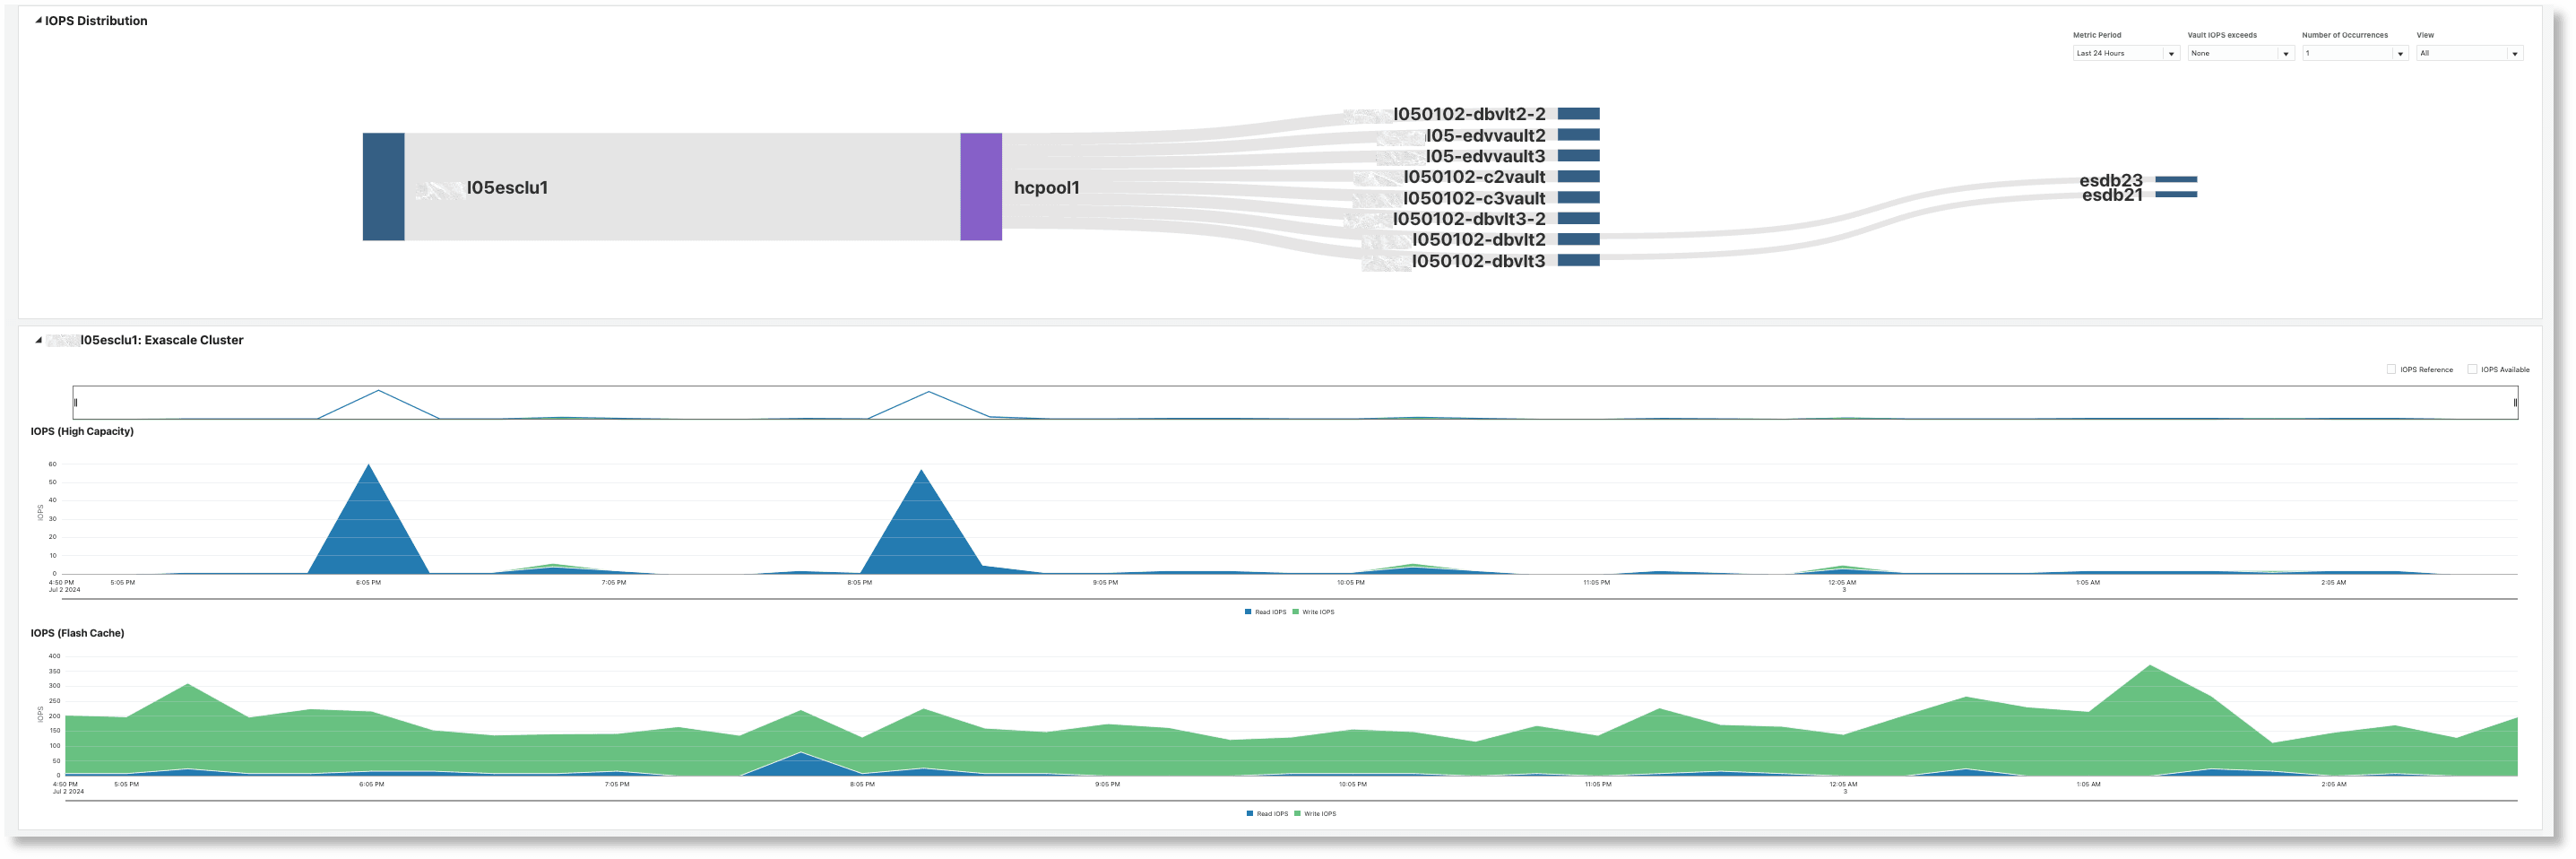
The advanced performance monitoring functionality has a Sankey-based diagram that displays the Exascale IOPS distribution. It has the following nodes and links:
- Exascale Cluster: Shows the name of the Exascale cluster. On mouse-over, IOPS information is displayed.
- Storage Pool: Shows all storage pools (color-coded) that are provisioned in this cluster. On mouse-over of a storage pool, information about provisionable, provisioned, and raw IOPS for the storage pool is displayed.
- Vaults: Shows vaults with links to the storage pool which provisions IOPS for each vault. On mouse-over of a vault, information about provisioned IOPS for the vault is displayed.
- Database: The terminal nodes show the databases that are consuming the IOPS.
- Links: The link between two nodes shows how the IOPS are provisioned. On mouse-over, the provisioned IOPS is displayed.

You can use the following options to filter the data in the Sankey diagram:
- Metric Period: The metric data time span is
24 hoursor7 days. - Vault IOPS Exceeds: The threshold value to use for determining whether IOPS has exceeded within the specified metric period. The values are prepopulated with the Oracle Enterprise Manager Vault Performance metric threshold values, if set.
- Number of Occurrences: The number of times IOPS has exceeded the specified threshold over the metric period. Once the values for Metric Period, Vault IOPS Exceeds, and Number of Occurrences are specified, the vaults that exceed the specified threshold for the specified number of occurrences in the specified metric period are identified.
- View:
Allcan be specified to display all vaults and to highlight vaults that match the above filter criteria.Highlightedcan be specified to view only the highlighted vaults.
Once the vaults of interest are identified, click a node (which is an Exascale cluster, storage pool or vault) in the diagram to obtain the chart for the aggregate IOPS consumed at the selected level over the specified time period, broken out into separate charts for the different media types that are used. The charts displays the following information:
- IOPS (High Capacity): Read and write IOPS for High Capacity storage.
- IOPS (Extreme Flash): Read and write IOPS for Extreme Flash storage.
- IOPS (Flash Cache): Read and write IOPS for flash cache.
You can select the following reference lines to display in the charts:
- IOPS Reference: The IOPS threshold selected in the filter
- IOPS Available: Maximum IOPS available