Determine I/O Headroom
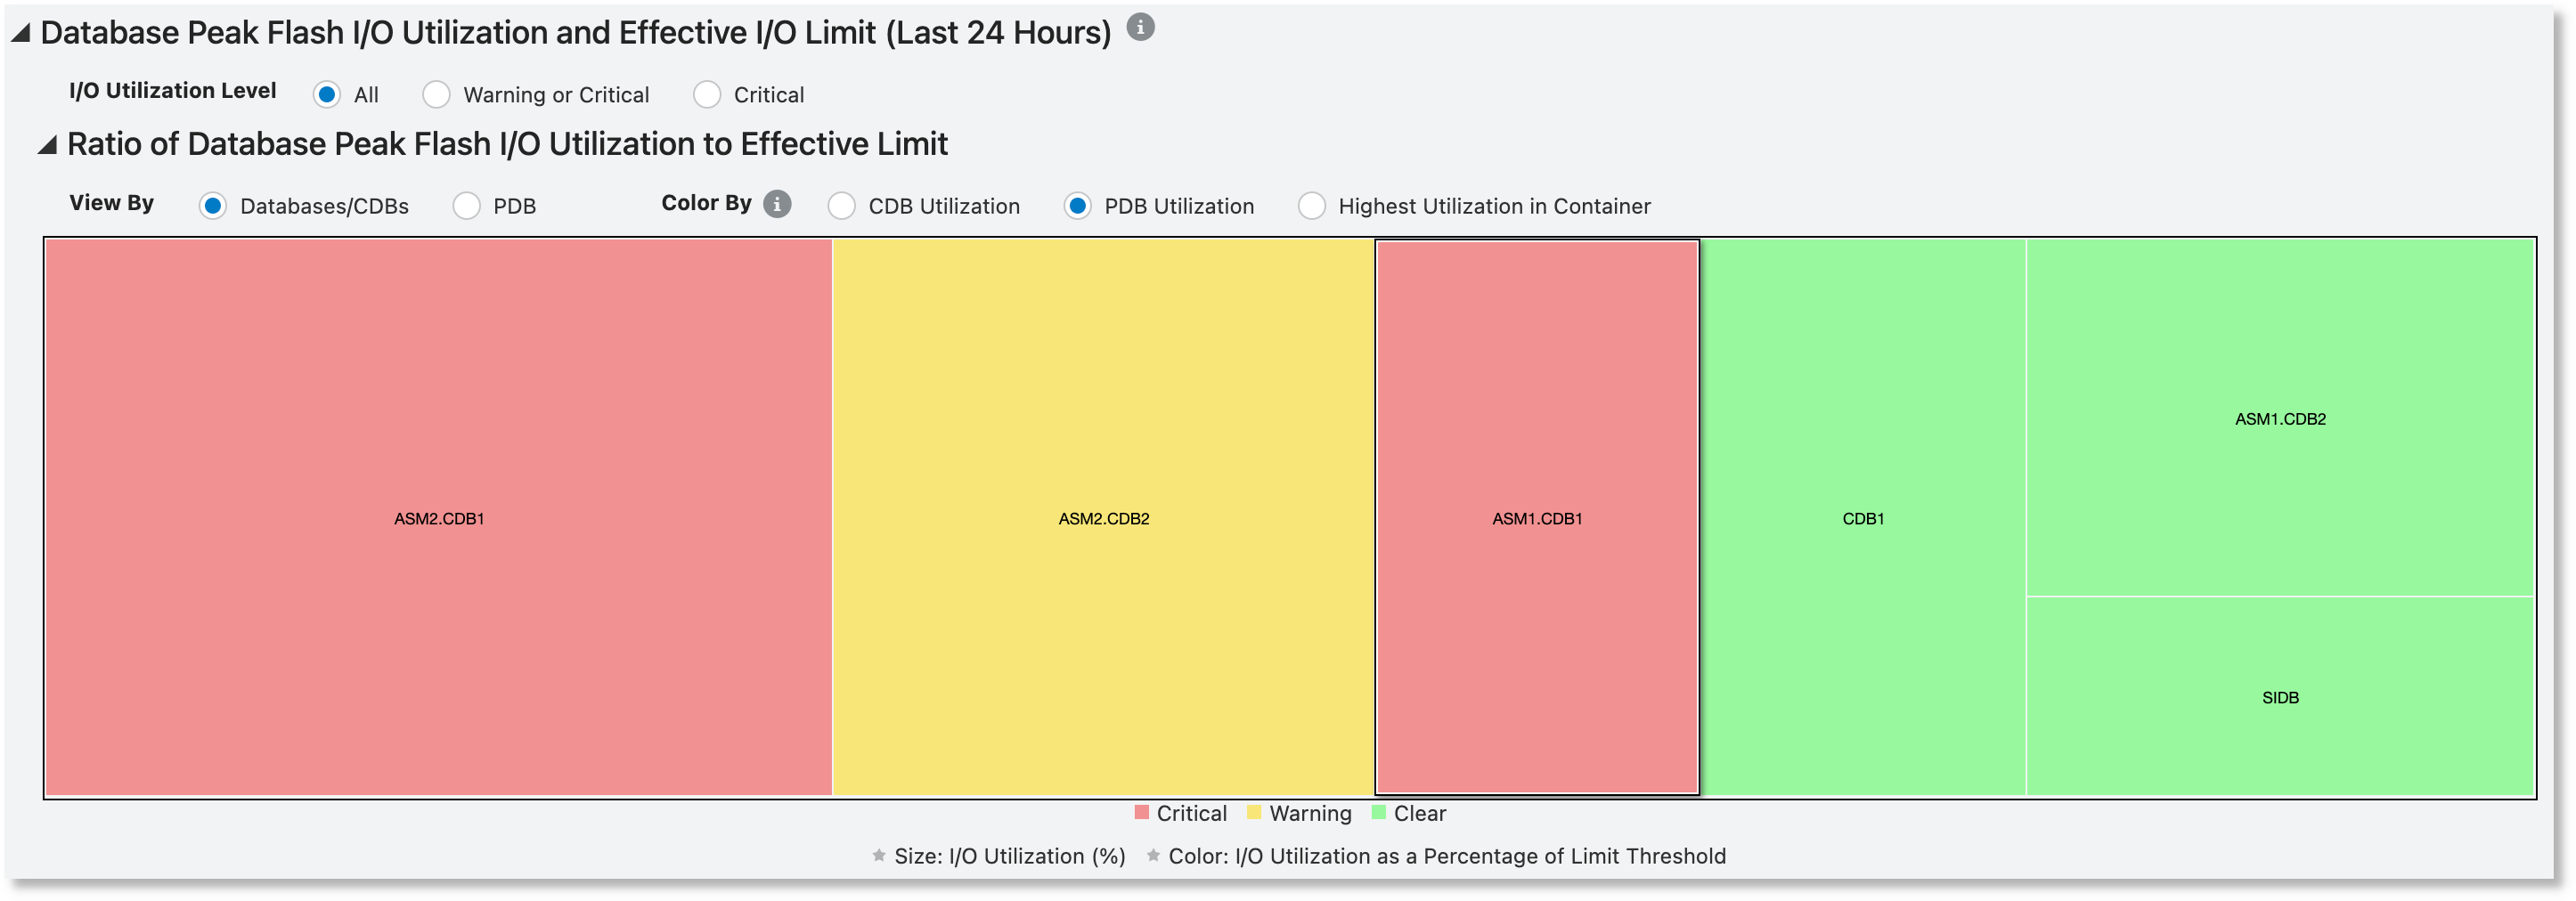
Once the databases to focus on are identified, you may want to analyze if they have capacity to handle larger I/O workloads. This can be done by comparing the peak flash I/O utilization against the effective I/O limit of these databases to determine if they have sufficient headroom. In addition to the heatmap described above, the Database Peak Flash I/O Utilization and Effective I/O Limit for Last 24 Hours section also displays a hierarchical table view of the databases running on the Exadata system. The I/O utilization values displayed in the table are the peak values for the corresponding row within the last 24 hours.
While correlating this table with the heatmap to analyze CDBs in the critical range, this hierarchical view can be used to identify PDBs that are reaching their respective I/O limits within those CDBs. For example, consider the following scenario using the container database ASM1.CDB1:
- View By is specified as
Databases/CDBsand Color By is specified asCDB Utilization. The tile for ASM.CDB1 would be green because its peak I/O utilization is 10%, which is far below the warning threshold of 50%. - If Color By is changed to
PDB Utilization, the color of the ASM.CDB1 tile would change from green to red. The table shows why the color changed - One of the PDBs (ASM1.CDB1.PDB2) in the ASM1.CDB1 reached its I/O limit, and hence crossed the critical threshold of 75%. - If Color By is changed to
Highest Utilization in
                    Container
, the ASM1.CDB1 tile would still be red because the peak I/O utilization of ASM.CDB1 is considered along with the peak I/O utilization of its three PDBs in it, and at least one of the PDBs (ASM1.CDB1.PDB2) crossed the critical threshold.
If the low I/O limit for pluggable database ASM1.CDB1.PDB2 is a concern, its I/O limit can be increased using the CDB plan.


By default, the historical performance charts are rendered for all the databases running on the Exadata system. One or more rows in the table above can be selected to limit the charts to only the selected databases.
- Select a CDB and click Synchronize Charts to view the historical performance charts for all its PDBs.
- Select one or more PDBs in a CDB and click Synchronize Charts to view the historical performance charts for the selected PDBs.
- Select a non-CDB database and click Synchronize Chart to view the historical performance statistics for that database.