Analyze Historical Usage of I/O Resources
After reviewing the table above, you can examine the historical trends of the metrics to understand whether the peak I/O utilization was seen frequently, and whether these periods of high I/O utilization coincide with high response times and/or high IORM wait times. You can select a single non-CDB, CDB or PDB to analyze its metrics, and these can be stacked against the same metrics for neighboring databases to understand how they compare with each other.

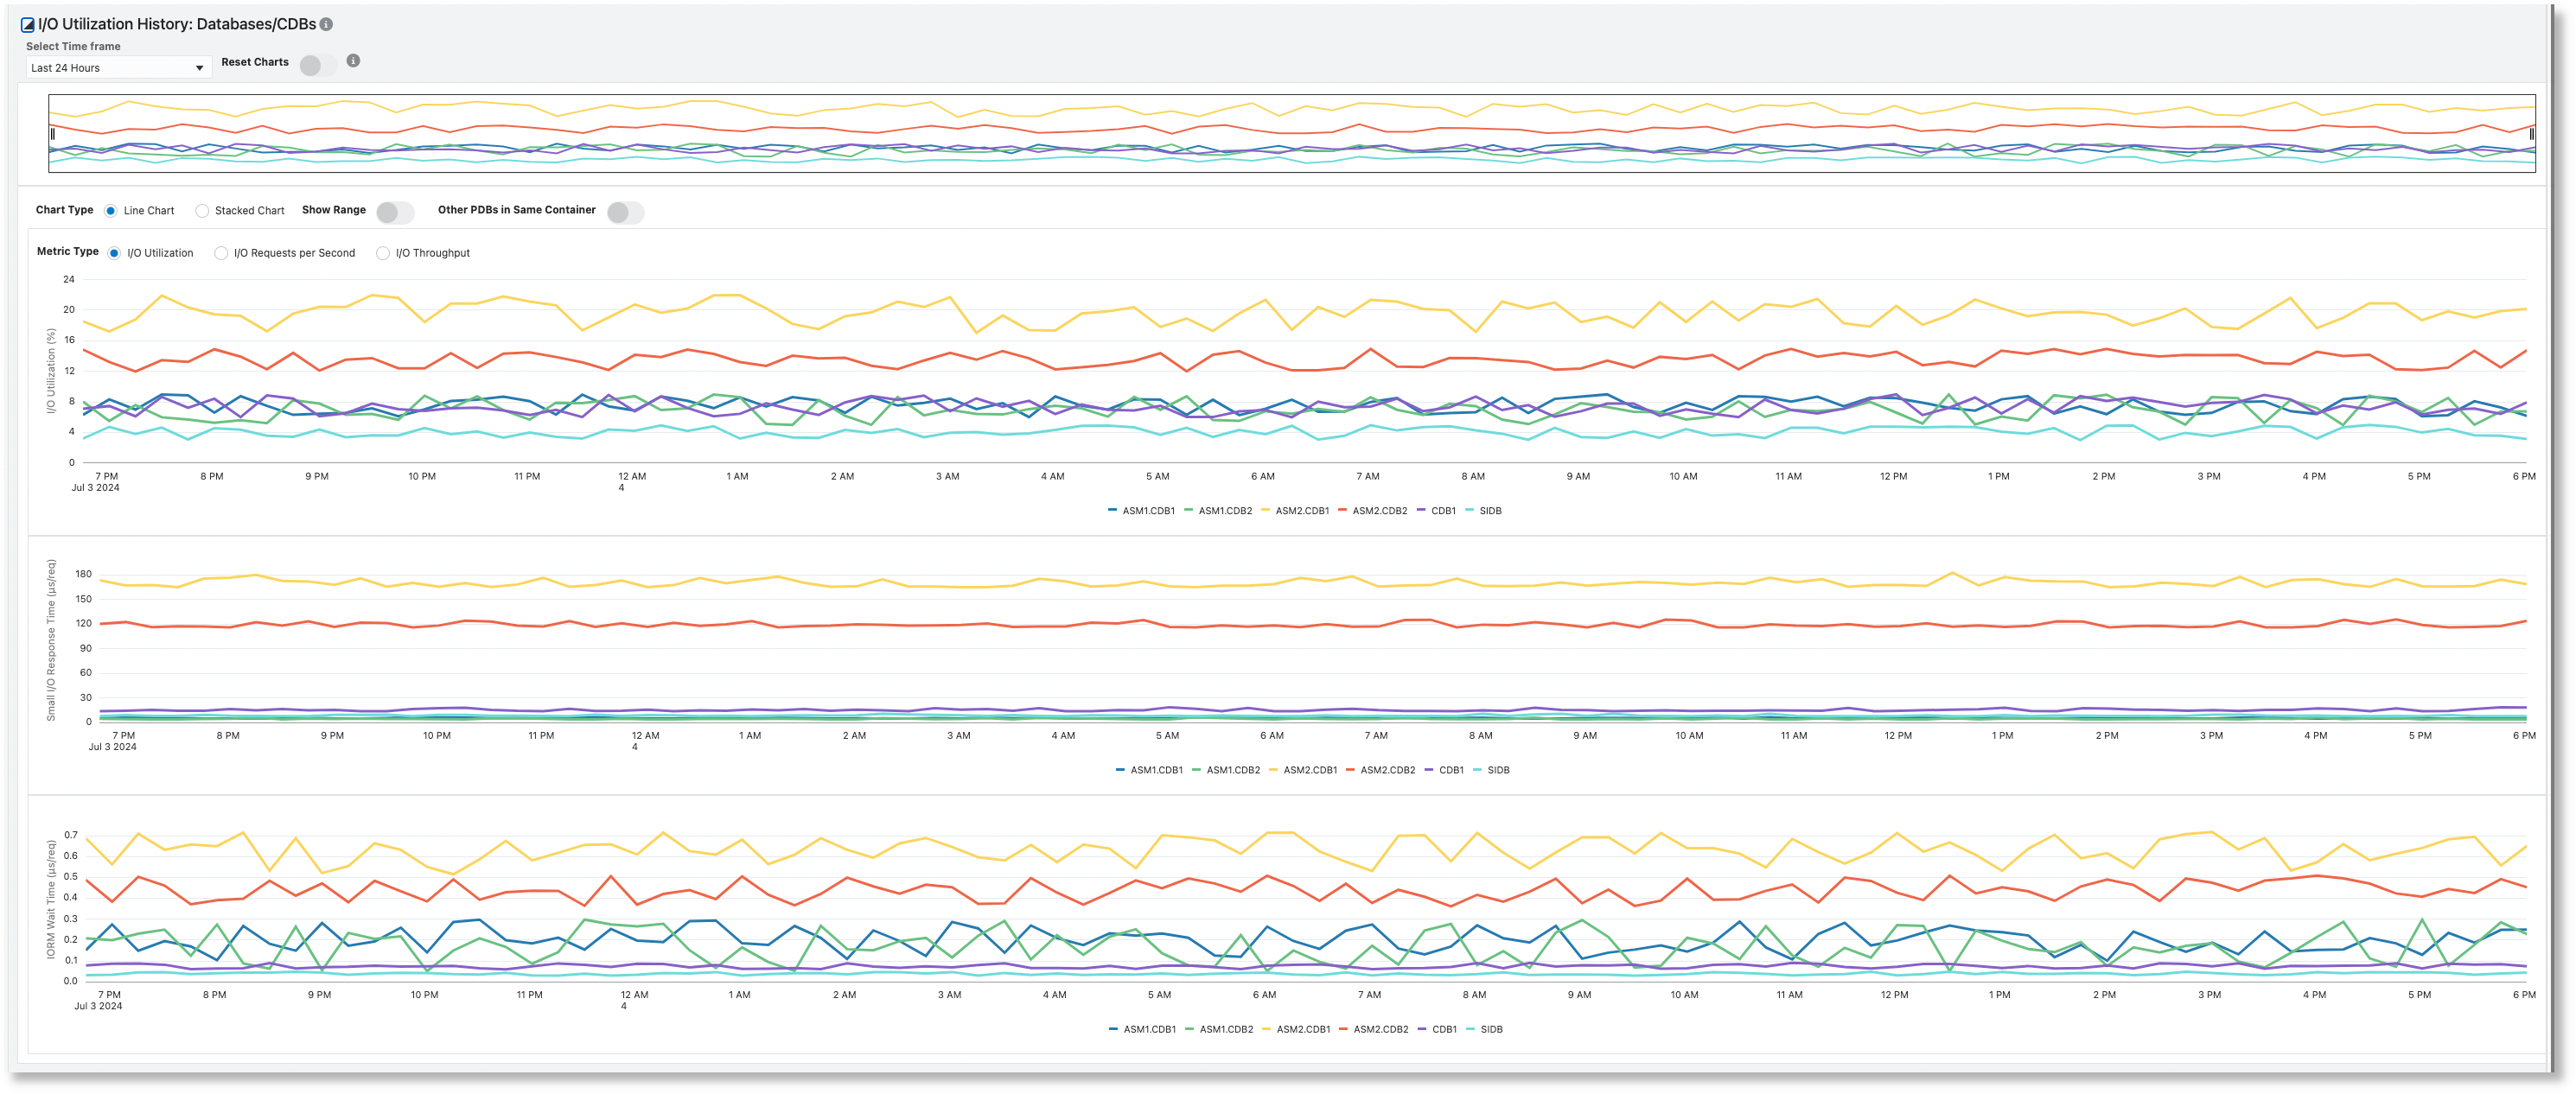
The I/O Utilization History section shows a set of line charts that
help correlate performance metrics related to I/O. By default, the historical
performance charts are displayed for last 24 hours. Zoom in and out
using the time selector above the charts to focus on a specific time period.
The following controls are available in this section:
- Select Time Frame option allows customization of the time range
used for the charts, which determines the granularity of the chart data. The
available values are
Last Hour,Last 24 Hours,Last 7 Days,Last 31 Days, andCustom Time Period. -
Use Reset Charts button to reset the filters:
- Turning this switch on resets the charts to show data for all the databases/CDBs present in the table above.
- Turning this switch off reverts the charts back to the state they were in prior to turning the switch on. (That is, show data only for the specific databases selected in the table.)
- Chart Type controls the chart style - Line Chart or Stacked Chart.
- Show Range controls the display of the threshold values (50% and 75%) along with the defined I/O limit on the I/O utilization chart. This option is enabled only when a single CDB or PDB is selected in the table. It is especially useful to see the range when Chart Type is specified as Stacked Chart, as it helps to see how the aggregate IOPS usage of all databases compares against these thresholds.
- Other PDBs in Same Container shows an aggregation of historical data values for all the PDBs that are not selected in the table. The aggregation line is plotted as the Others series, alongside the lines for the selected PDBs.
- Metric Type allows the following additional performance statistics to be displayed: I/O Utilization, I/O Requests per Second, I/O Throughput.