Identify Databases Approaching Their I/O Limit
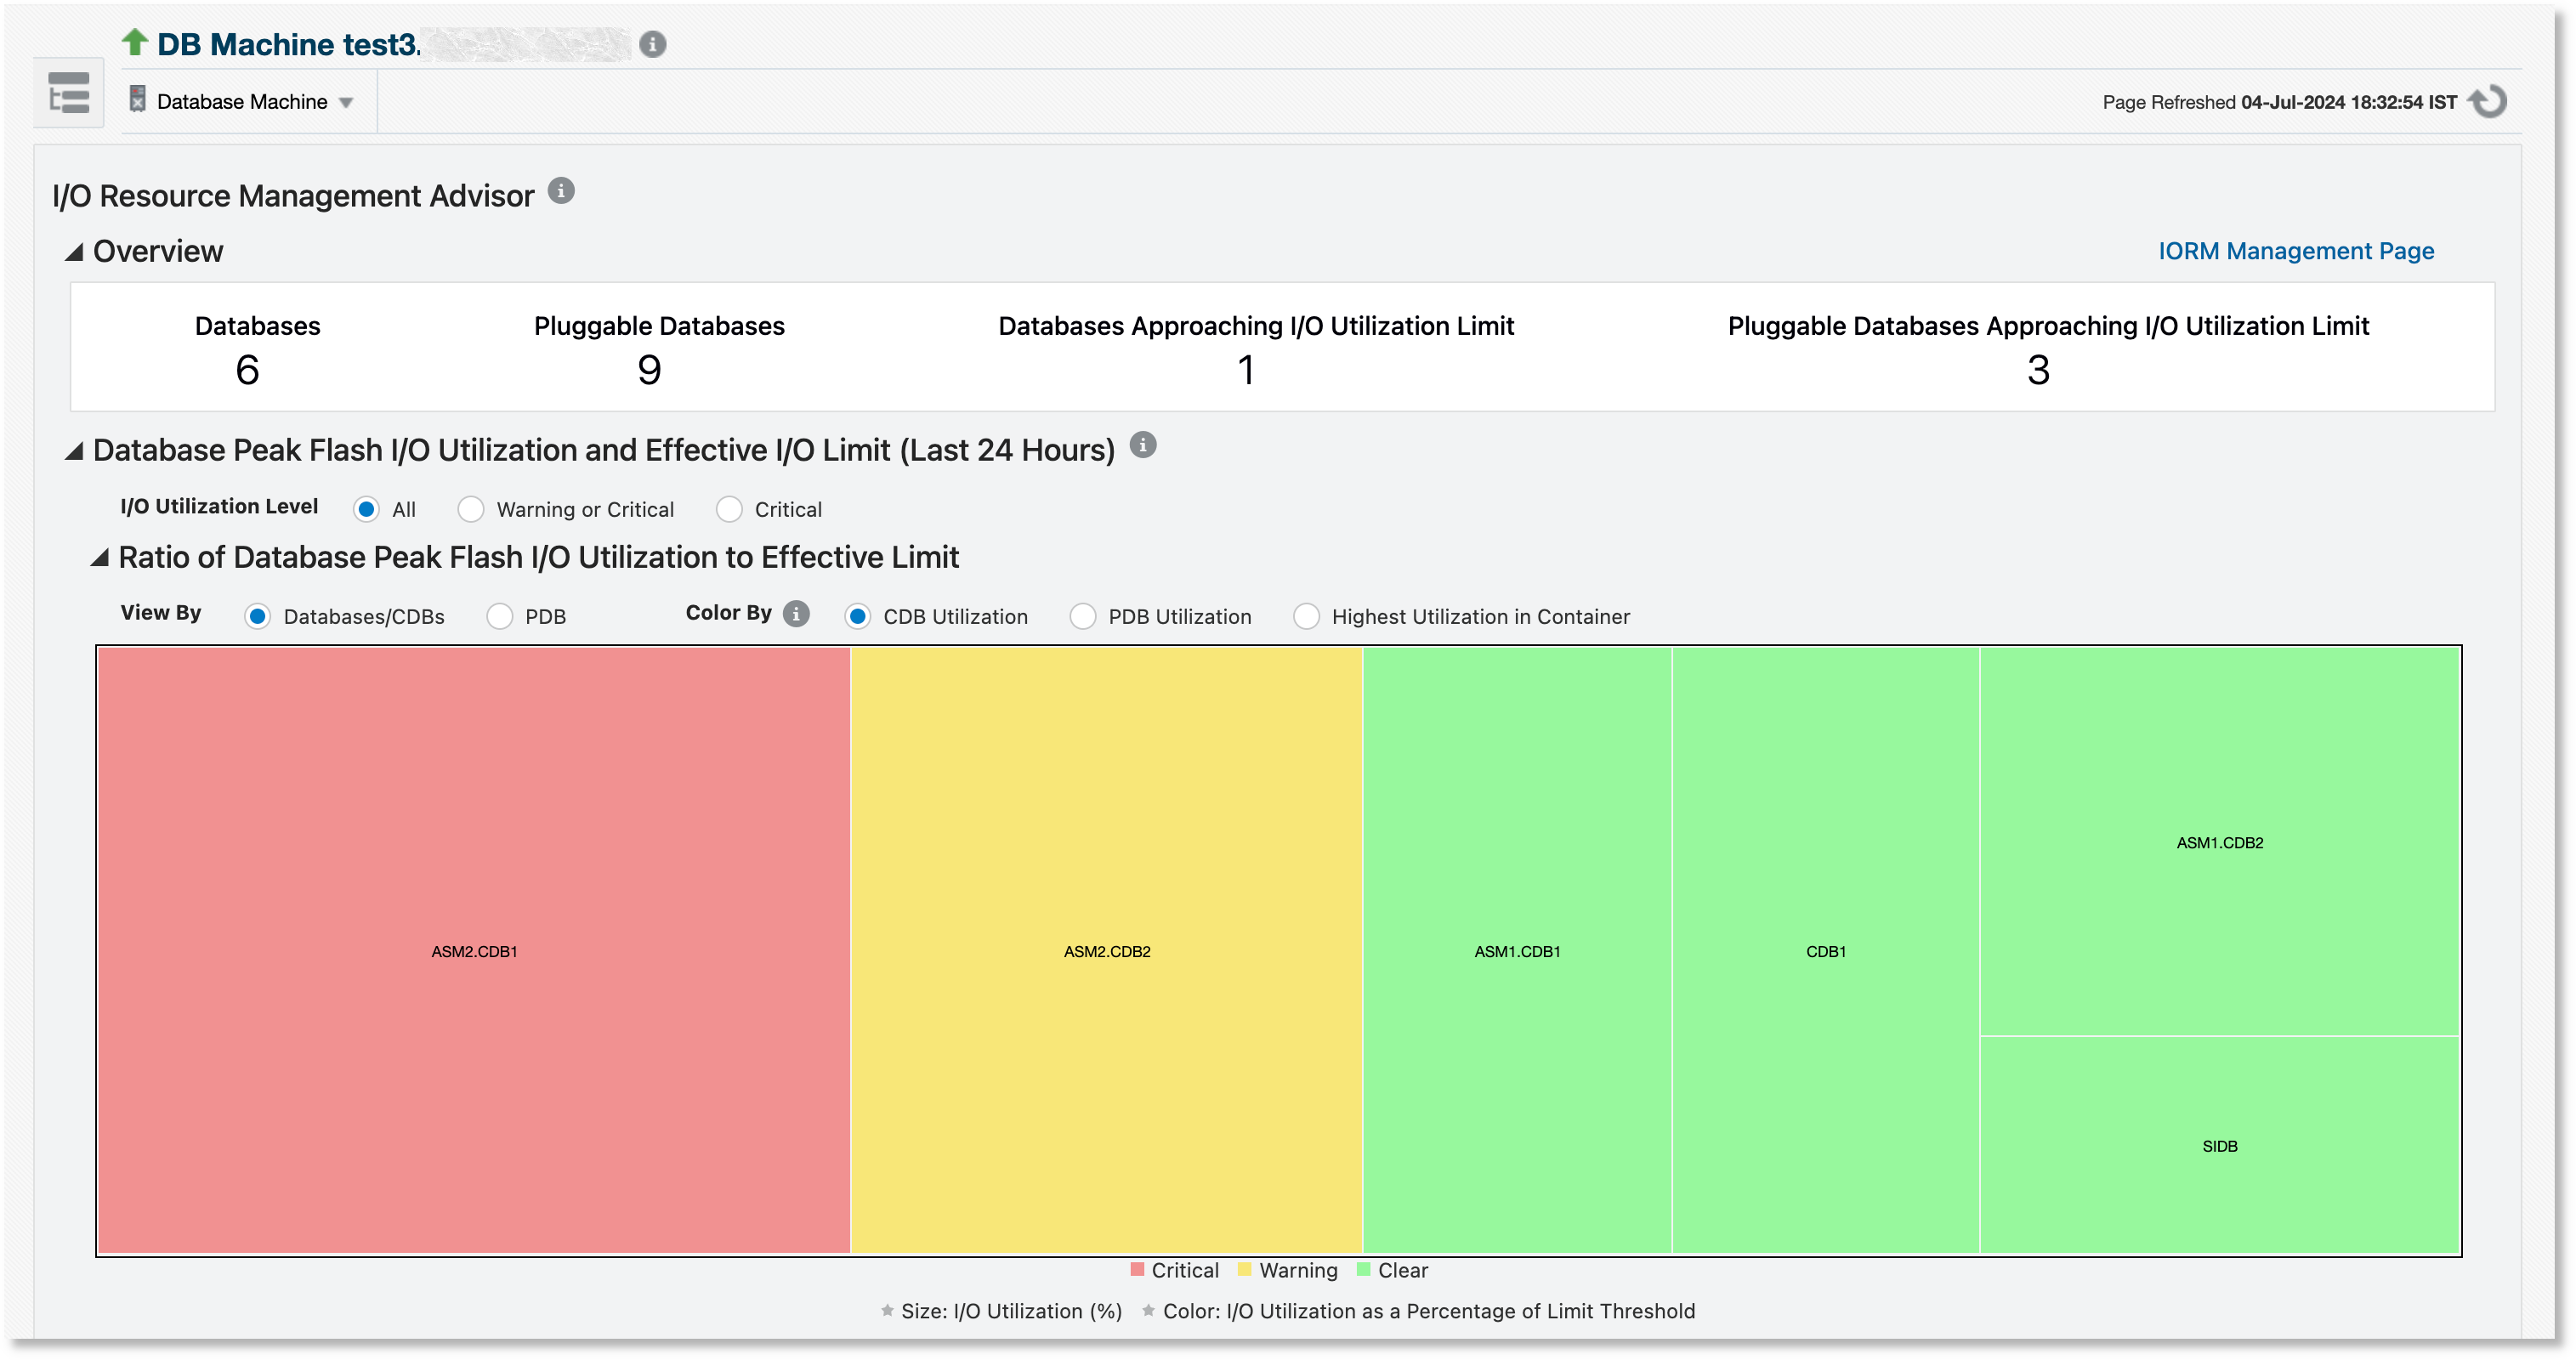
The Overview section provides a summary of the I/O situation for all the databases running on the Exadata system, including the databases that are not monitored by Oracle Enterprise Manager:
- Databases Approaching I/O Utilization Limit: The total number of databases/CDBs for which the flash I/O utilization crossed the flash I/O limit critical threshold in the last 24 hours
- Pluggable Databases Approaching I/O Utilization Limit: The total number of PDBs for which the flash I/O utilization crossed the flash I/O limit critical threshold in the last 24 hours

The heatmap in the Database Peak Flash I/O Utilization and Effective I/O Limit for Last 24 Hours section provides a visual indication of I/O utilization for all databases, and can be used to quickly identify databases that are under or over utilizing their allocated I/O resources, The heatmap tiles, one per database, provide the following visual indicators:
- Tile Size: Proportional to database flash I/O utilization
- Tile Color: Reflects peak database flash I/O utilization over
the last 24 hours, as follows:
- Red (Critical): The I/O utilization exceeded the built-in critical threshold (75%).
- Yellow (Warning): The I/O utilization was between the built-in warning (50%) and critical (75%) thresholds.
- Green (Clear): The I/O utilization was under the built-in warning threshold.
The heatmap offers two sets of view options to organize the data: View By and Color By.
Following are the View By options:
- Databases/CDBs: View peak flash I/O utilization at the database or CDB level. Use this option if the Exadata system has both CDBs and non-container single-instance and/or cluster databases (non-CDBs).
- PDB: View peak flash I/O utilization at the PDB level. This is useful if the Exadata system has only CDBs (and therefore PDBs).
The Color By option controls the level at which to apply the peak flash I/O utilization comparison when rendering the heatmap. Following are the Color By options:
- Database/CDB Utilization: The color is determined by comparing the aggregated peak flash I/O utilization at the CDB level (or non-CDB level, if applicable).
- PDB Utilization: The color is determined by the highest value of the peak PDB flash I/O utilization across all PDBs in the CDB.
- Highest Utilization in Container: The color is determined by the highest flash I/O utilization reached between the two scenarios above. This is the most comprehensive option, as it helps to visualize I/O hotspots, whether it is at the non-CDB/CDB level or the PDB level.
Click a tile in the heatmap to view the utilization metrics for the corresponding database in the table in the Database Peak Flash I/O Utilization and Effective I/O Limit for Last 24 Hours sections.
Usage Example: Container database ASM1.CDB1 has three PDBs, of which only one ASM1.CDB1.PDB2 has a lower I/O limit. The peak I/O utilization of the CDB is low but the peak I/O utilization of ASM1.CDB1.PDB2 has reached its limit at least once over the past 24 hours. The tile for this CDB would show as green if Color By was set to Database/CDB Utilization, but would show as red if set to Highest Utilization in Container.
A large number of databases or PDBs in critical range does not necessarily indicate a problem. The primary goal is to ensure that the most important databases (for example, those serving production applications) are displayed in green or yellow. If the important databases are in the critical (red) range, then remediation measures could be considered, such as increasing their I/O limit, re-examining how the databases are consolidated, or re-analyzing the I/O workload. From the perspective of overall resource management, it may help to understand whether the Exadata system has more headroom, the capacity to handle more I/O workload.