31 Using the MWaaS Self Service Portal
Using the MWaaS Self Service Portal
The Middleware Self Service Portal allows self service users to view, monitor, and request middleware services. Users can request middleware services using any of the predefined service templates. They can deploy, undeploy applications, create data sources, scale up, and scale down services with minimal or zero intervention by the self service administrator.
Prerequisites
To view the Middleware Cloud Self Service Portal, log in to Enterprise Manager as a user with EM_SSA_USER role or an user with the EM_SSA_USER_BASE role. Users with these roles must be part of the Middleware Cloud Service Family and must have privileges for the Service Bus, SOA Infrastructure, and WebLogic service types.
Setting the Preferences
From the User menu in the top right hand corner of the page, select Preferences and then select SSA Portal Settings to set up your preferences such as the Default Service Type, Default Email Address for Notifications, Default Locale, Default PaaS Infrastructure Zone, and so on. To set the Middleware Cloud Self Service Portal as the default page that appears when you log in to the Self Service Portal, select Middleware in the Default Service Type drop down list and click Apply. For more details on setting the preferences, see Viewing Preferences.
Defining Dynamic Elasticity Policies for Middleware Services
Note:
These policies are applicable only for the WebLogic Service type.
To define a policy, follow these steps:
Creating a MWaaS Schedule Policy
For instance, if you want to create a schedule based policy that states that a middleware service must be scaled up every Monday, follow these steps:
Requesting a Middleware Service
You can use the Request New Service option to request a new middleware service. You can request the following types of middleware services:
-
WebLogic Service, see Requesting a WebLogic Service
-
SOA/OSB Service, see Requesting an Oracle Service Bus or SOA Infrastructure Service
Requesting a WebLogic Service
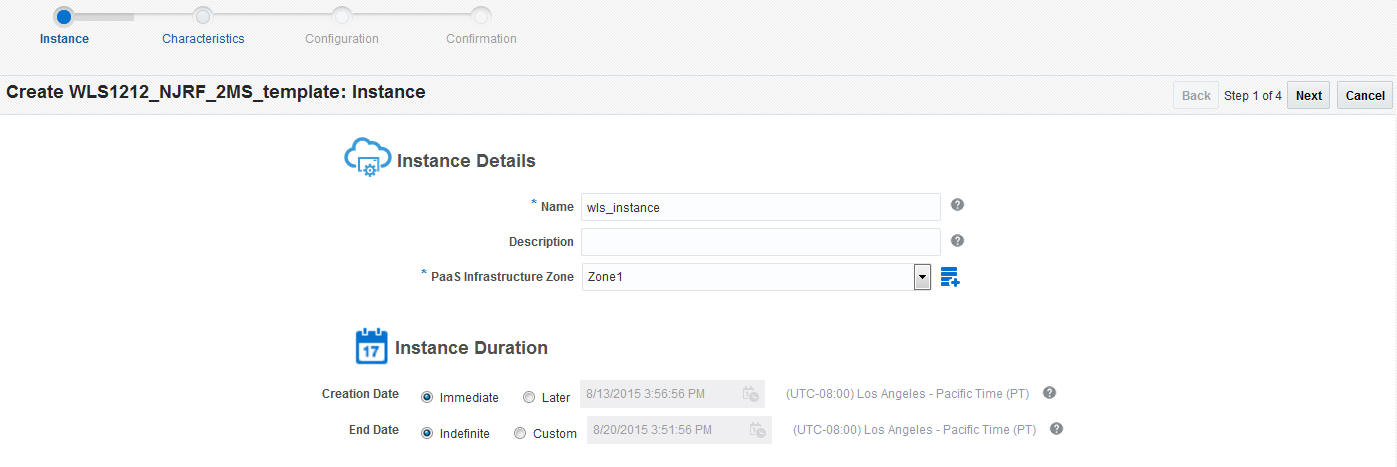
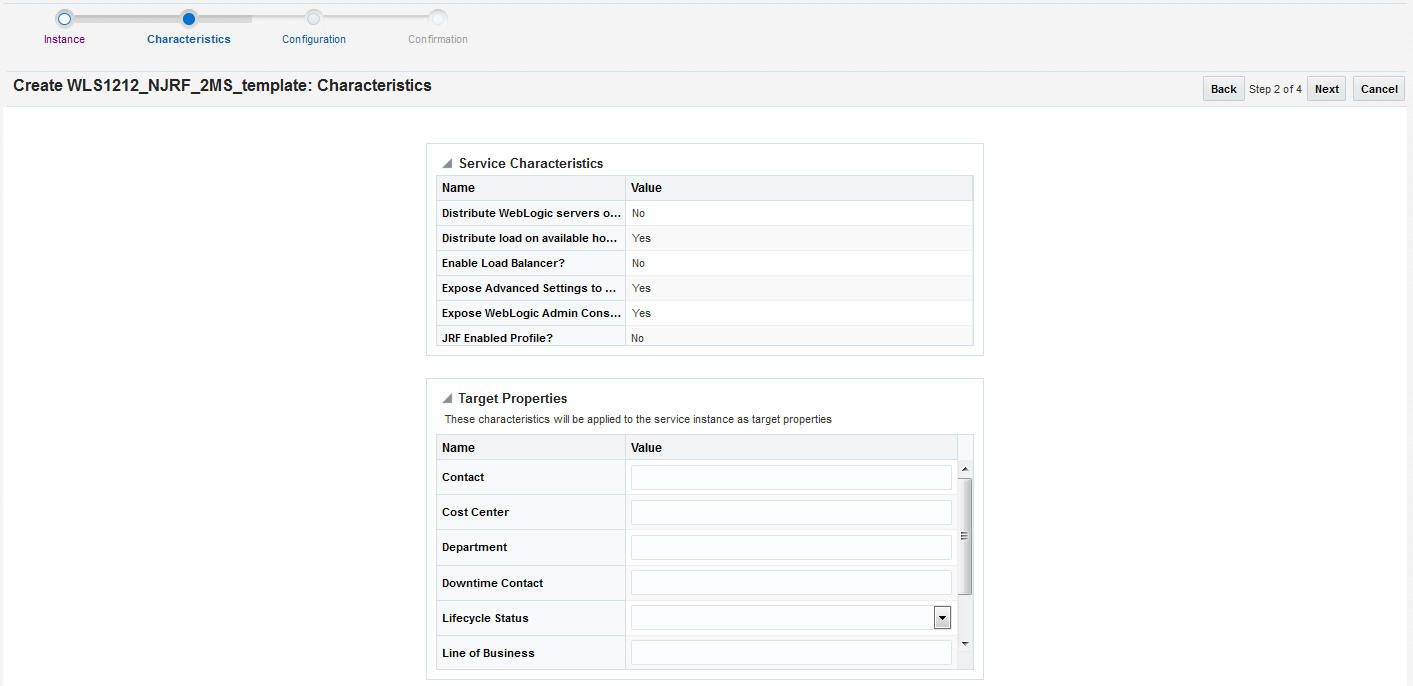
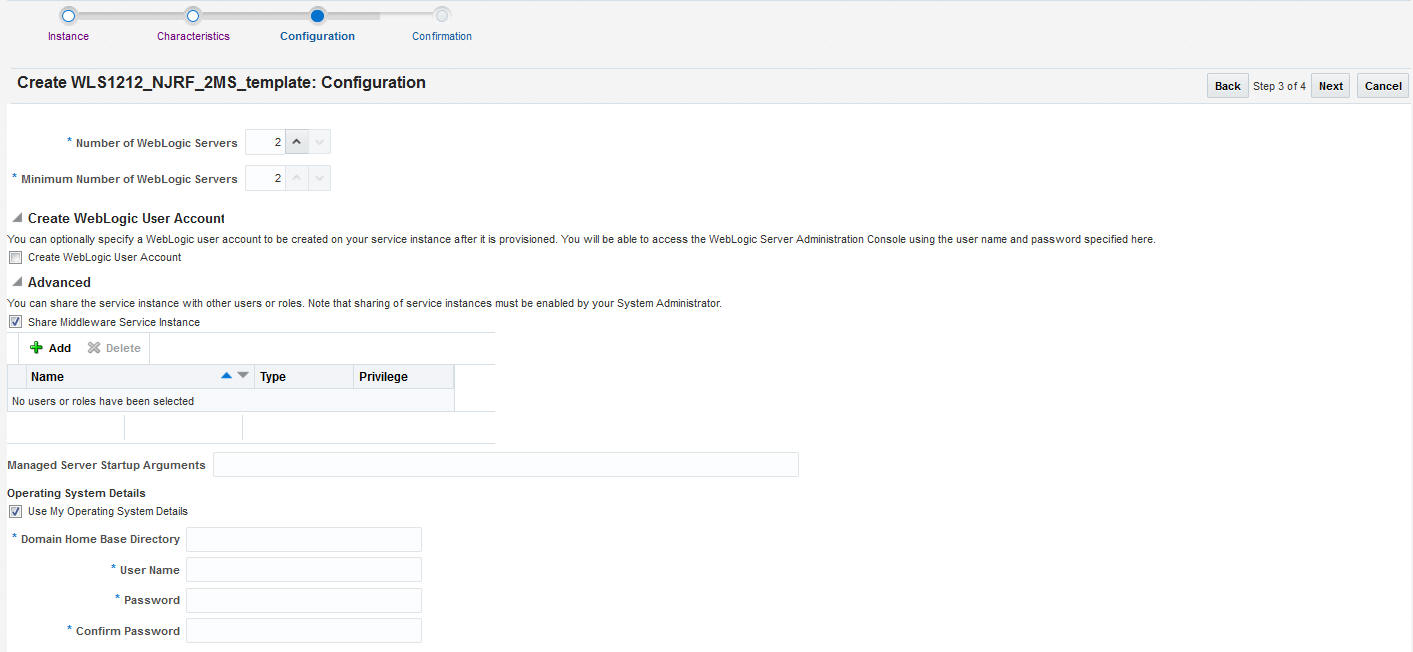
You can request a new WebLogic service on this page.
To request a service, follow these steps:
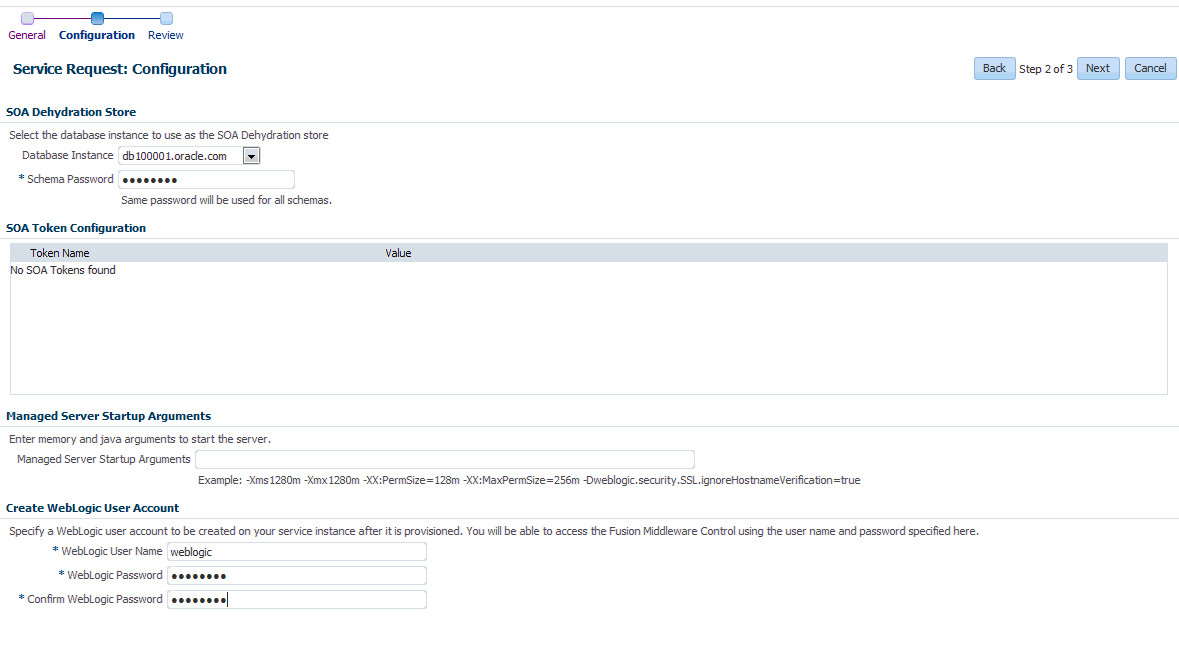
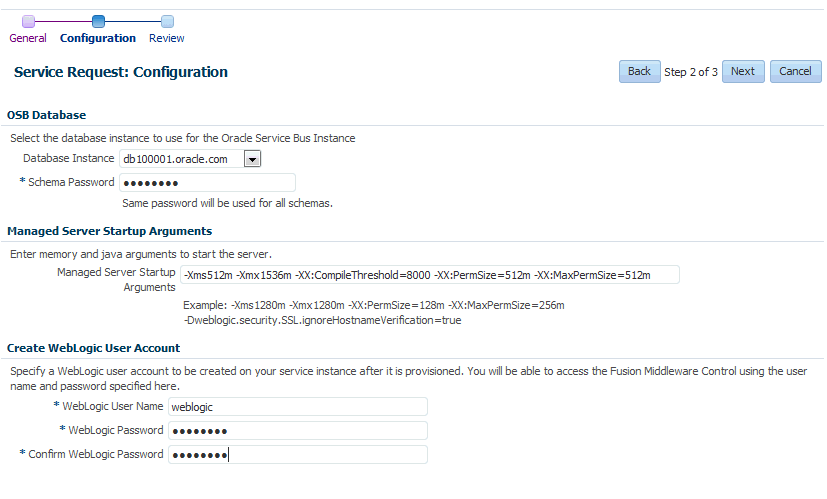
Requesting an Oracle Service Bus or SOA Infrastructure Service
Log in with SSA_USER role to view, monitor, and request for SOA/OSB services using the Middleware Self Service portal.
Prerequisite
Oracle recommends that the database is cloned using DBaaS. If database is cloned using another SSA User account (for example, user1), then user1 needs to grant access on the database service instance to user2, assuming user2 is requesting for SOA / OSB instance.To request for a service, follow these steps:
Middleware Service Home Page
The Middleware Service Home page provides detailed information about the services you have requested using the Request Service option. To view the Middleware Service Home page, click the Name link in the Middleware Services region in the Middleware Cloud Self Service Portal: Home tab. This page contains the following regions:
-
Summary: Shows the availability status of the service, status summary of the WebLogic Servers, and the performance metrics for the underlying WebLogic cluster associated with this service. The following charts are displayed.
-
Availability: The availability status of the service.
-
Resource Usage: Shows the CPU and Heap Usage charts for all the servers in the cluster.
-
Response and Load: Shows the request processing time and number of requests per minute for the current service.
-
General: Shows charts for various performance metrics for the service.
-
-
Applications: Lists all the applications deployed to this service. For each application, the name, status, and the key metrics such as Active Sessions, Request Processing Time, and Request per Minute are displayed. Click the Name link to drill down to the Application Home page. You can do the following: :
-
Deploy: Click Deploy to deploy the application to the service. See Deploying and Redeploying an Application for details.
-
Delete: Select an application and click Delete to undeploy an application.
-
Redeploy: If you have an updated Java EE application component, you can select the application and click Redeploy to redeploy the application. See Deploying and Redeploying an Application for details.
-
Start / Stop: Select an application and click Start or Stop to start or stop the application.
-
Test: Select an application and click the Test icon. A list of URLs is displayed in the Application URLs dialog box. Click the URL to navigate to the associated page.
-
-
Libraries: If any applications have been deployed as libraries, they are listed here.You can do the following:
-
Deploy: Click Deploy to deploy the application to the service. See Deploying an Application for details.
-
Delete: Select an application and click Delete to undeploy an application.
-
Redeploy: If you have an updated Java EE application component, you can select the application and click Redeploy to redeploy the application.
Note:
If you select a library that is being referenced by an application, the Redeploy and Delete buttons are disabled and this library cannot be deleted or redeployed.
When deploying using the Self Service Portal you can create the deployment as a normal application or a library. Libraries are deployments that can be shared with other deployments. The Middleware Service home page shows normal applications in the Applications table and libraries in the Libraries table. Libraries may be deleted and redeployed, but only if they are not being referenced by any applications.
-
-
Data Sources: This region is displayed only for WebLogic services. It shows all the data sources that are available for this service. For each data source, the Name, Database Service Name, JNDI name and the URL for the database is displayed. If the data source has been created using a database service, the name is displayed in the Database Service column. Click on the name to drill down to the Database Service Home page. You can create new data sources, edit or delete existing data sources, and test the connection of any specified data source.
-
Requests: This table shows all the requests that have submitted for this service. These include requests such as Deploy, Undeploy, Redeploy, Scale Up, Scale Down, Start, Stop, Create, Edit, and Delete Data Source.
The following options are available from the Middleware Service Instance menu:
-
Set End Date: Select this option to specify an end date for the middleware service. You can set the end date for a service. Select a service from the table and click Set End Date. In the popup window that appears, you can specify a new End Date for the middleware service instance. If you do not want the service to expire, select Indefinitely and click OK.
-
Start and Stop: You can start or stop the service by selecting the appropriate option from the Middleware Service menu.
-
Scale Up and Scale Down: See Scaling Up and Scaling Down a Service.
-
Service Instance Settings: This shows the current value of the Minimum Number of WebLogic Servers and allows you to modify this value.
-
Select Metrics: Click Select Metrics to add new charts, remove existing ones, and drag and drop metrics to charts. In the Metric Palette window that appears, select a metric or drag and drop a metric into an existing chart or create a new chart. By default, all new charts are displayed in the General section but you can drag and drop them to a different section. You can remove a metric/chart by unchecking a box in the Metric Palette or by clicking the x on the drag bar on the right side of the chart. You can move charts within their section by dragging them by that bar.
-
Restore Default Charts: Click Restore Default Charts to restore the charts to the default settings. All chart additions, modifications and deletions are applicable to a specific service. An SSA user can have different charts for each service.
-
Log Messages: Click Log Messages to view a list of messages sorted by message type, date, and so on. Select the date range, message type, and specify other filters in the Message field. Click Add Fields, select other fields to be included in the message, and click Search. The first 1000 messages that meet the search criteria are displayed. Click Export Messages to File to export the messages to a log file in
.txt,.xml, or.csvformat. -
WebLogic Server Administration Console: Click this option to launch the WebLogic Administration Console.
-
Fusion Middleware Control: Click this option to launch the Fusion Middleware Control console.
Note:
The WebLogic Server Administration Console and the Fusion Middleware Control interfaces allow you to manage and monitor the Oracle Fusion Middleware components. The WebLogic Server Administration Console and Fusion Middleware Control options are available in the Middleware Service menu only if the Expose WebLogic and FMW Console URLs to SSA User field has been set to Yes in the Middleware Service Template. See Creating a WebLogic Service Template for details.
-
Deploying and Redeploying an Application
You can deploy a preconfigured Java EE application to a Service Instance. To deploy an application, follow these steps:
Redeploying an Application
You can redeploy an application that has been deployed to a Service Instance. To redeploy an application, select a deployed application from the Applications table and click Redeploy. In the Redeploy Application page, select the Application Component that is to be redeployed, the deployment plan if any, and click Redeploy. You will see a confirmation message indicating that the application has been redeployed.
Scaling Up and Scaling Down a Service
You can scale up or scale down a service.
Note:
The Scale Up and Scale Down options are available only if the service is based on a middleware service template that contains a middleware provisioning profile with one cluster. If the profile does not contain a cluster, these menu options will not be available.
On the Middleware Service Home page, select the following options from the Middleware Service menu:
-
Scale Up: You can scale up a service by adding one more servers. The number of servers you can add is limited by your quota. Click Scale Up and enter the number of servers by which the service is to be scaled up. Click Submit to submit the scale up request and add more servers.
-
Scale Down: Click Scale Down and enter the number of servers by which the service is to be scaled down. Click Submit to submit the scale down request and reduce the number of servers.
Creating a Data Source
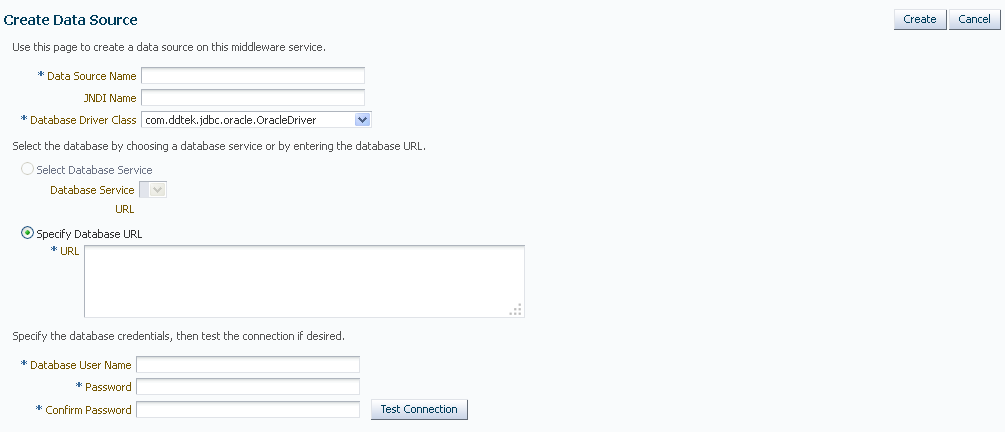
In a WebLogic Server, you configure database connectivity by adding data sources to your WebLogic domain. WebLogic JDBC data sources provide database access and database connection management. Before an application can access a database, it must be configured to use the JDBC data source.
To create a data source for a service, follow these steps:
Editing a Data Source
You can edit the properties of a data source. Click the Name link in the Data Sources table in the Middleware Service Home page. The Edit Data Source page appears. You can edit the properties of the data source. If some of the properties are changed, the data source needs to be redeployed and applications using this data source need to be restarted.
SOA/OSB Service Home Page
The SOA Home page provides detailed information about the services you have requested using the Requests option. To view the Middleware Service Home page, click the Name link in the Middleware Services region in the Middleware Cloud Self Service Portal: Home tab.
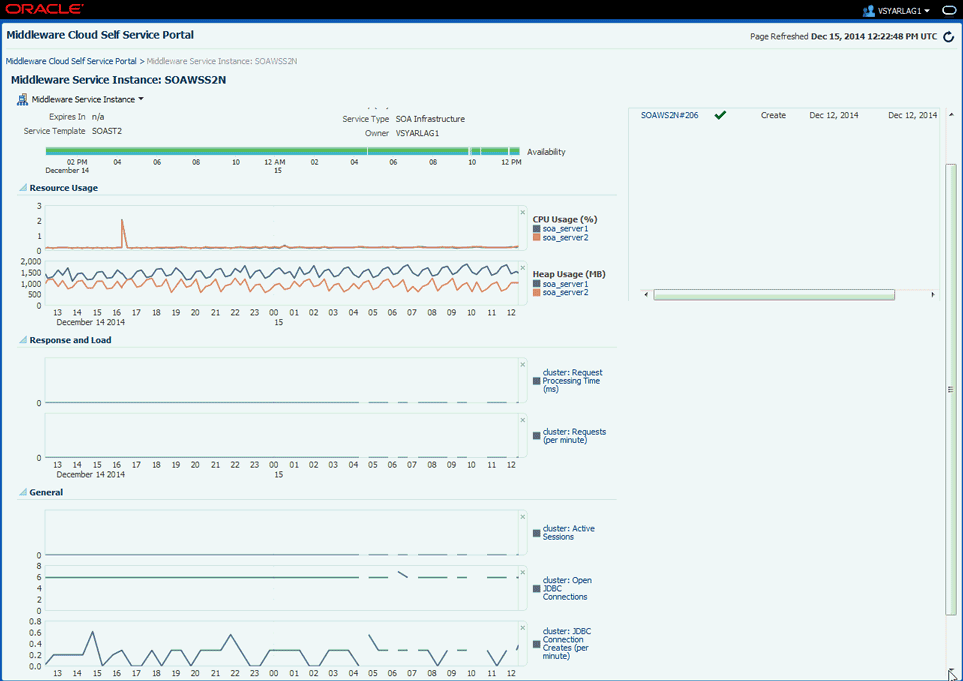
This page contains the following regions:
-
Performance Summary: Shows the availability status of the service, status summary of the WebLogic Servers, and the performance metrics for the underlying WebLogic cluster associated with this service. The following charts are displayed.
-
Availability: The availability status of the service.
-
Resource Usage: Shows the CPU and Heap Usage charts for all the servers in the cluster.
-
Response and Load: Shows the request processing time and number of requests per minute for the current service.
-
General: Shows charts for various performance metrics for the service.
-
-
Requests: This table shows all the requests that have submitted for this service.
The following options are available from the Middleware Service Instance menu:
-
Set End Date: Select this option to specify an end date for the middleware service.
-
Start and Stop: You can start or stop the service by selecting the appropriate option from the Middleware Service menu.
-
Scale Up and Scale Down: See Scaling Up and Scaling Down a Service.
-
Select Metrics: Click Select Metrics to add new charts, remove existing ones, and drag and drop metrics to charts. In the Metric Palette window that appears, select a metric or drag and drop a metric into an existing chart or create a new chart. By default, all new charts are displayed in the General section but you can drag and drop them to a different section. You can remove a metric/chart by unchecking a box in the Metric Palette or by clicking the x on the drag bar on the right side of the chart. You can move charts within their section by dragging them by that bar.
-
Restore Default Charts: Click Restore Default Charts to restore the charts to the default settings. All chart additions, modifications and deletions are applicable to a specific service. An SSA user can have different charts for each service.
-
Log Messages: Click Log Messages to view a list of messages sorted by message type, date, and so on. Select the date range, message type, and specify other filters in the Message field. Click Add Fields, select other fields to be included in the message, and click Search. The first 1000 messages that meet the search criteria are displayed. Click Export Messages to File to export the messages to a log file in
.txt,.xml, or.csvformat. -
WebLogic Server Administration Console: Click this option to launch the WebLogic Administration Console.
-
Fusion Middleware Control: Click this option to launch the Fusion Middleware Control console.
-
Note:
The WebLogic Server Administration Console and the Fusion Middleware Control interfaces allow you to manage and monitor the Oracle Fusion Middleware components. The WebLogic Server Administration Console and Fusion Middleware Control options are available in the Middleware Service menu only if the Expose WebLogic and FMW Console URLs to SSA User field has been set to 1 in the Middleware Service Template. .
Java Application Service Instance Home Page
The General section displays a URL that can be used to access your service. Click Download JVMD Agent to download the JVM Diagnostics Agent war file. Ensure that you deploy the war file on the WebApps folder of the Application Server that is to be monitored. This enables the JVM Diagnostics Agent to start monitoring the Java Application target in Cloud Control.
The Java Application Service History section provides a quick view of the event log for your application, along with the time stamp. Basically details like when a particular application starts or when it was created, is captured and logged in this section.
Parameters that are printed to the service.out file is displayed in the Service Details section. This is particularly useful, when you want to view the port numbers assigned to the JVM JMX port.
In addition to this, memory usage and performance summary details are also available on this page.
Uploading a Java EE Component to the Software Library
You can upload pre-configured ear, war, jar, or rar files to the Software Library. These files are uploaded to the Software Library as Java EE Application components, which are then deployed to your service. To upload a file to the Software Library, click the Library tab. The Upload to Software Library field appears.
Figure 31-8 Upload to Software Library
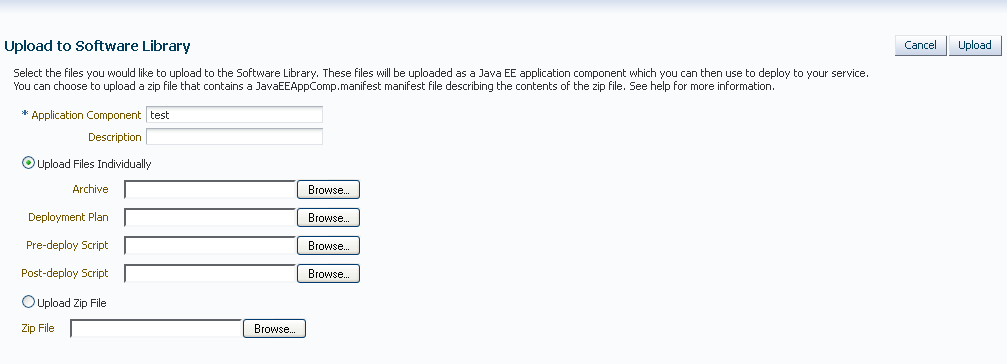
Enter the name and description of the file being uploaded. You can then choose to upload files as follows:
-
Individual Files: If you choose the Upload Files Individually option, you need to specify the following:
-
Archive: Select the archive file to be uploaded to the Software Library. This can be an
ear,war,jar, orrarfile. You can also optionally specify the following:-
Deployment Plan: This is an
xmlfile containing the deployment options for the Java EE Application component. -
Pre Deploy Script: This is a script containing WLST commands. The Management Agent runs this script on the Administration Server associated with each instance before the application is deployed. You can use this script to create data sources, JMS end points, and any other resources that might be needed by the application that is being deployed.
-
Post Deploy Script: This is a WLST script that is executed by Management Agent on the Administration Server after the application is deployed. You can use this script to perform any post deployment configuration. For example, if you need to roll back and undo the changes made by the pre deploy script, you can select this option.
-
-
-
Zip File: If you select the Upload Zip File option, you must upload a zip file that contains the
JavaEEAppComp.manifestfile that describes the contents of the zip file.
Click Upload to upload the file to the Software Library.
Application Home Page
To view the Application Home page, select an application, and click the Name link in the Applications table on the Middleware Service Home page.
Figure 31-9 MWaaS Application Home
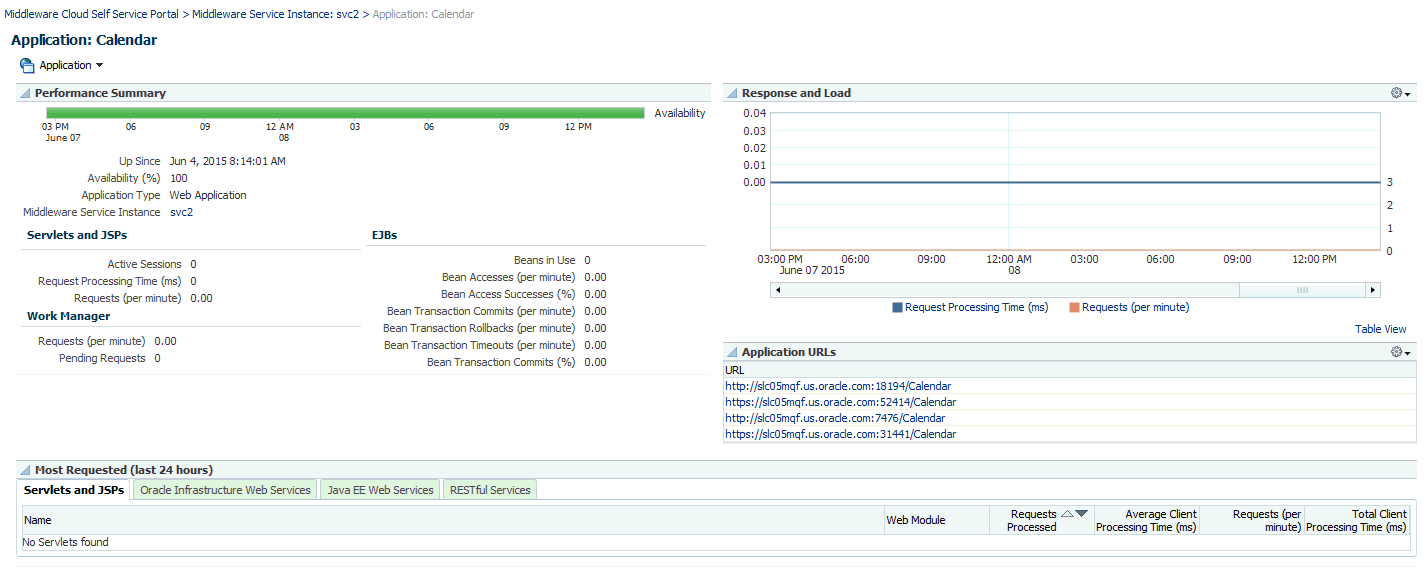
This page displays performance and availability for the application, along with a chart that shows response and load. You can redeploy, delete (undeploy), start, or stop the application using options from the Application menu.


