6.3 Expert Mode
Expert mode facilitates an advanced analysis of the metrics and their observed values against the predicted ones.
Section 2 cover the Standard mode of operation. However, since this diagnosis is based on an applied machine learning model of predicted metric values, there is always a probability that an abnormal condition will not be diagnosed correctly - either raising a warning too late or providing a false one. To facilitate an advanced analysis of the metrics and their observed values against the predicted ones, an Expert mode is provided.
Parent topic: Analyze Issue Root Cause
6.3.1 Activating the Expert Mode
Press "e" to toggle the Expert mode, or use the right-click pop-up menu, and then select "Expert". The probe status timelines change their appearance, and an additional "Expert" tab appears. Only the target timeline stays unchanged.
In the Expert mode, timelines of probes contain now an overlapping display of three values:
- Time series for the expected (or predicted) value displayed as light blue lines from 0 to its value.
- Time series for the observed value. Plotted on top of the predicted values in green or in red to indicate the state.
- State of the probe marked in green or red of the observed value plot.
Figure 6-27 Activating Expert Mode
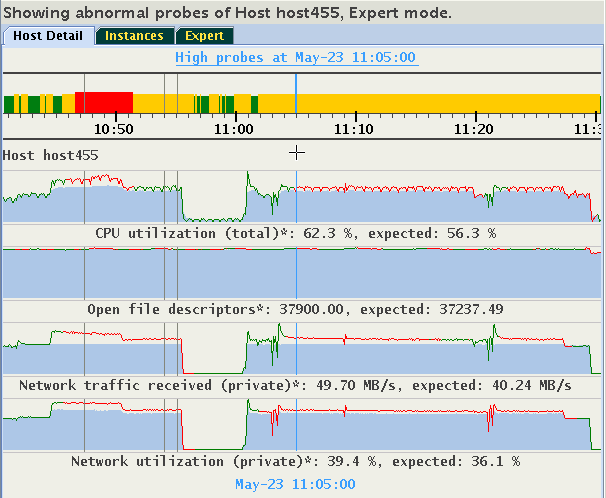
This display helps to evaluate how well the existing model aligns the actual observed values with the predicted values. If the observed values are consistently and significantly different from predicted values, then it is likely that the model is not well-calibrated to a particular workload. Performing a CHA calibration based on this workload should be considered.
The histograms of the probes are dynamically self-adaptive to the range of values of each metric predicted or observed value. This might cause that parts of the visible time series appear "flat". The predicted and observed values might be so similar to each other that the differences between them would be barely visible. See the "Open file descriptors" in the above image. In such cases, you might prefer to see a plot of a difference between the observed and predicted values, called a "residual". Select "Display Residuals" on the floating menu, or press "r" to toggle between the display of residuals or of the pair predicted/observed. The time series shown originally in Figure 13-27 changes to what is shown in Figure 13-28.
Figure 6-28 Activating Expert Mode
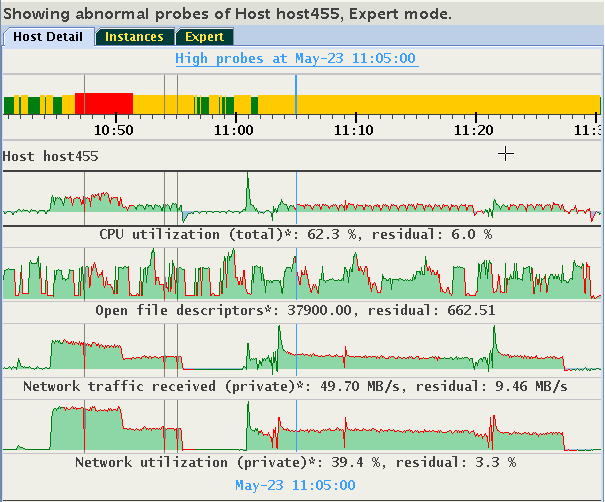
Note how the differences in values of "Open file descriptors" become visible. Positive residuals are displayed as "green hills" (observed value is greater than the predicted), and negative residuals are displayed as "blue pools" (observed value less than predicted).
This display will be meaningful only for probes for which CHA provides both expected and observed values. Otherwise, they will appear empty. Consider the following example, in which the metric "Network used bandwidth" does not have expected values.
Figure 6-29 Activating Expert Mode
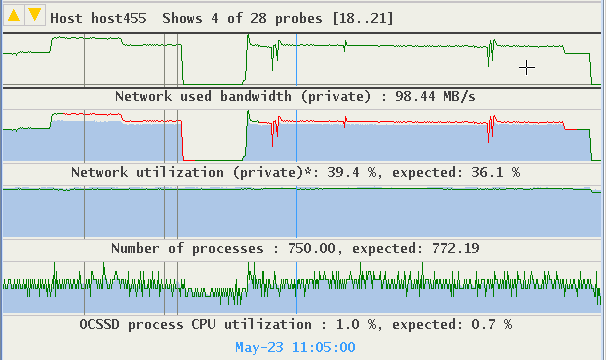
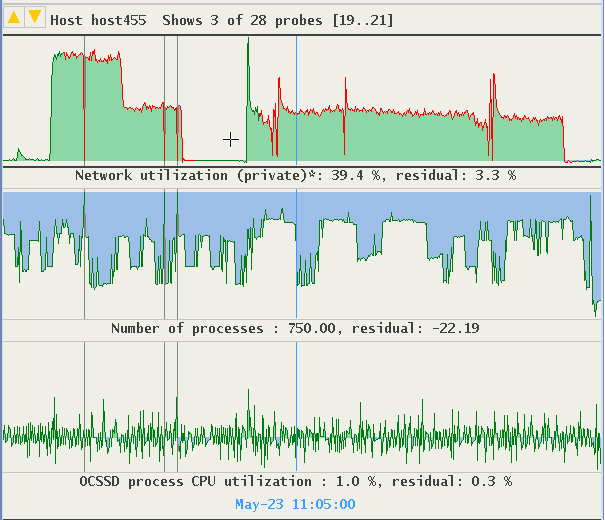
Display of residuals for this metric is empty. The display for "Network utilization" and "Number of processes" provide good visualization of differences between their expected and observed values.
Figure 6-30 Activating Expert Mode
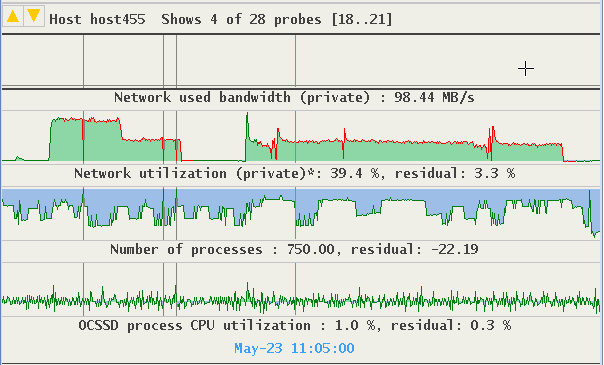
The time series of "OCSSD process CPU utilization" suggest a good similarity between the observed and predicted values.
Parent topic: Expert Mode
6.3.2 Resizing Expert Diagrams
Due to auto-scaling, important details in observed and predicted values may not be easily visible. A vertical zoom function is available by placing the cursor over the area of interest and pressing Control+Left mouse button to drag the cursor up or down. The maximum height of each graph is 128 pixels. The example below shows the previous image enlarged to display more detail in graphs.
Figure 6-31 Resizing Expert Diagrams
Parent topic: Expert Mode
6.3.3 Selecting Custom Set of Probes
Probes monitored by CHA are grouped into categories. A custom set of probes may be specified based on their categories, or on individual probes from different categories. Click the "Expert" tab, or use the tab and left/right arrow key to navigate to the Expert panel.
Figure 6-32 Selecting Custom Set of Probes
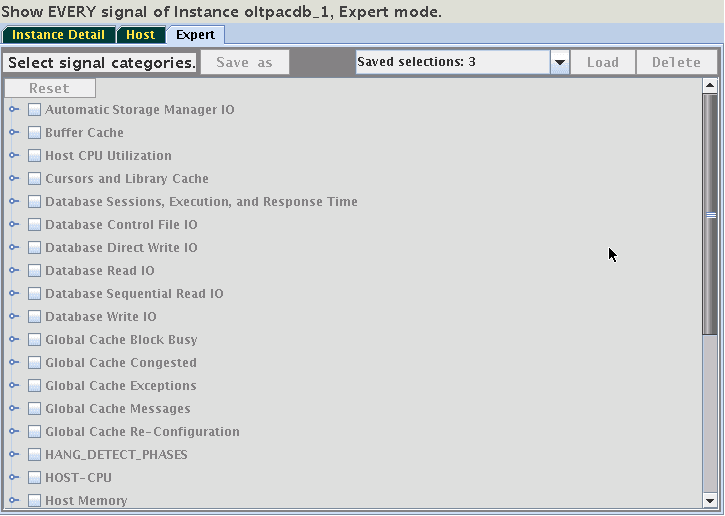
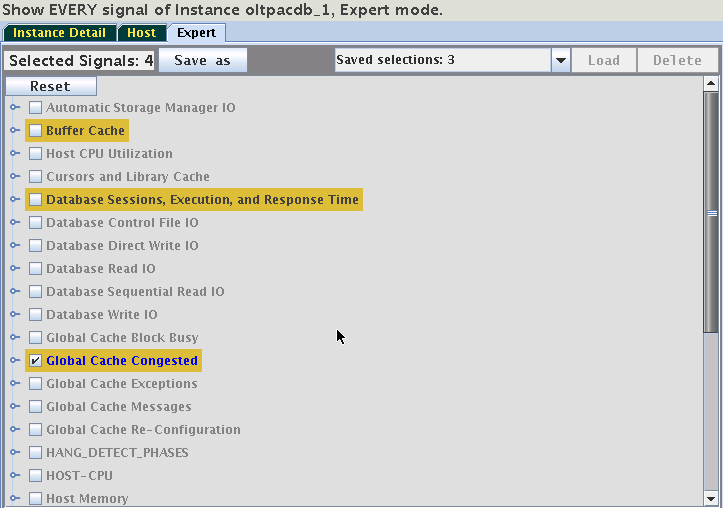
This panel provides access to a hierarchical tree with probe categories. The number of probe categories may vary between CHA models. To create a custom set of displayed probes, select either a category or expand its tree, and then select individual probes from any category. For example, select the category "Global Cache Congested". Its name is highlighted in yellow and its checkbox is selected. Note, two additional categories became highlighted without their checkboxes being selected. This means that one or more of the probes from "Global Cache Congested" are also their members.
Figure 6-33 Selecting Custom Set of Probes
Expand the selected category and one of the other yellow highlighted categories to see which probe they share. In this case, it is the "cpu_used_pct":
Figure 6-34 Selecting Custom Set of Probes
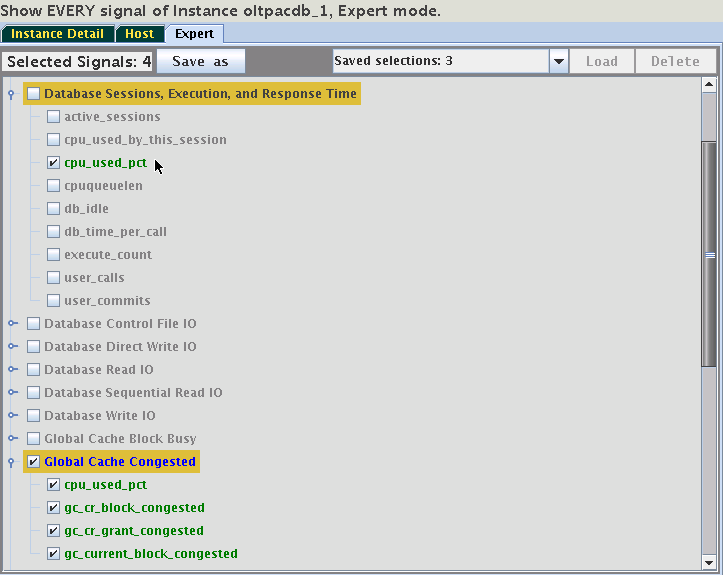
By unchecking the probe "cpu_used_pct", only one category will remain highlighted. Switch to the "Instance Detail" tab to see that now only the three signals of the category "Global Cache Congested" are being displayed on the Instance tab. Selections may be stored for reuse. On the Expert tab use the button "Save As" to save the selection under a specified name.
Figure 6-35 Selecting Custom Set of Probes

These saved selections will be available after a restart of AHF Scope on the same host. Use the drop-down menu "Saved selections" to retrieve any of the saved sets of probes. Press "Load" to activate it, or press "Delete" to remove it from the persistent storage. Note, that selecting of the saved set without a corresponding Loading does not activate it.
Parent topic: Expert Mode