6.2 Cluster View: Connecting and Basics of Monitoring
Start AHF Scope using the script ahfscope on Linux/UNIX or
ahfscope.bat on Microsoft Windows. This script is located in the
/opt/oracle.ahf/ahfscope/bin/ directory.
To connect to GIMR, the script obtains connection parameters using Oracle Wallet services. AHF Scope displays a top-level Cloud View upon starting and connecting to GIMR. AHF Scope will terminate upon closing the main window.
- Basics of Navigation Through Entity Panels
- Target Entities
- Browsing Through Time and Pin Operation
- Changing the Set of Visible Probes
- Selecting Abnormal Probes in Any Time Range
- Problems or Anomalies
- Browsing through active time of a Problem
Parent topic: Analyze Issue Root Cause
6.2.1 Basics of Navigation Through Entity Panels
This is the default window that will appear when AHF Scope is started:
Figure 6-1 AHF Scope default window
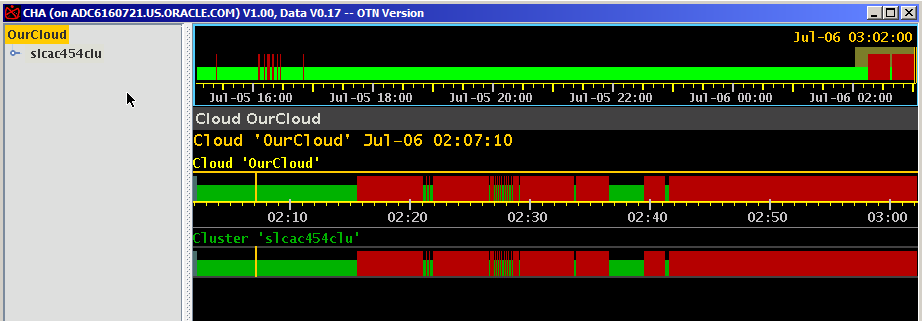
The window contains a navigation tree on the left and an analysis panel on the right. The navigation tree always starts in a symbolic top-level system "OurCloud" and displays all components within its connected Cloud. AHF Scope currently connects to only one GIMR, and thus contains data for all monitored nodes and Oracle RAC databases within a single cluster.
The analysis panel contains three components:
- A system timeline at the top showing a condensed long term system history.
- A status line.
- An entity panel associated with the entity selected in the navigation tree.
The currently selected navigation tree entity is marked with a yellow background.
The analysis panel initially appears with a dark background called "Night Theme". A "Day Theme" displaying dark text on a light background is also available. You can toggle the themes by moving the cursor onto the entity panel and pressing lowercase "w", or by using the right mouse click to access the floating menu and selecting "Night/Day Mode
Figure 6-2 Night/Day mode
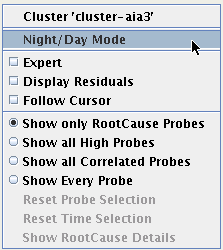
This is the first example of how to use either a Hot Key or a floating menu to perform the same function. For more information about Hot Keys, see List of Hot Keys.
The main panel in Day Theme looks like as follows:
Figure 6-3 Main Panel in Day Theme
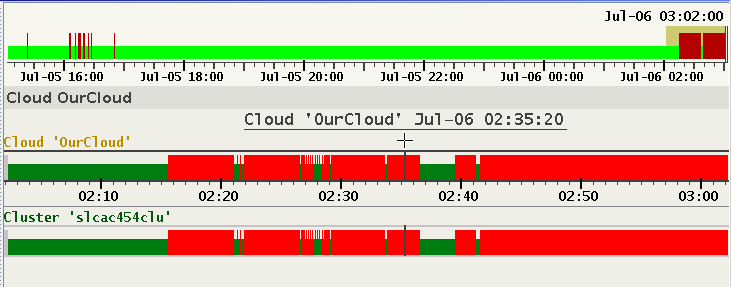
This change is persistent. With every consecutive start, the most recent selected theme is used. For more information about the settings that AHF Scope persists, see Set of Persistent Settings.
Note:
The persistent storage for these settings is associated with a specific user on a specific host. These settings need to be repeated when using AHF Scope on multiple hosts.The status timelines in the entity panel display for each timestamp the state of its entity marked either green, red, or gray.
- Green means that at that point in time, none of its sub-entities indicate any problem flagged as "abnormal".
- Red means that at least one of its sub-entities is in abnormal state. Mathematically, this means that AHF Scope calculates a union of sets of all sub-entities and propagates its value upward to the top most entity, which is here OurCloud.
- Gray marks periods in time in which no data was received for any of the sub-entities.
- Gray over green marks periods in time in which some sub-entities received no data.
Click the cluster entity under OurCloud. AHF Scope now marks the cluster name with a yellow background, and the entity panel changes to display the cluster details.
Note:
When a cluster entity is selected, the status line under the timeline displays the number of hosts and databases in this cluster.Figure 6-4 Number of hosts and databases in this cluster
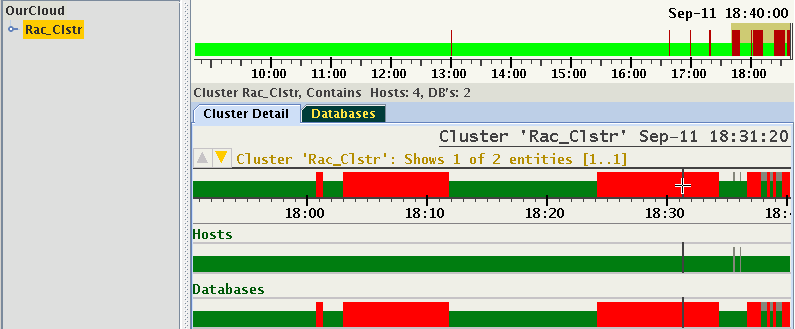
In this hierarchy, the cluster entity contains two sub-entities "Hosts" and "Databases". The above display indicates that all red-marked abnormal states come from one of the databases only.
Any entity in the navigation tree may be expanded to show its sub-entities. Note that expanding the navigation tree does not change the entity panel on the right. This panel changes only when a different entity is selected in the tree.
Note the position of the cursor on the status timeline of the cluster. The entity name will change color to indicate that it has focus. Moving the cursor over the "Databases" status timeline switches the highlighting and focus accordingly. Focusing on a specific entity allows you to enter its panel without moving the mouse pointer to the navigation tree. To step down to the panel of any sub-entity, for example, "Databases" in the image above, you can choose between these methods:
- Select the entity in the navigation tree on the left. This requires a movement of the mouse pointer to the tree.
- Place the cursor on the entity name and double-click it.
- Use a Hot Key without moving the mouse pointer. Press Enter on your keyboard. AHF Scope will select the focused entity and enter its panel. The selected entity will be automatically expanded and highlighted in the navigation tree.
This is the second example of how to use Hot Keys. Instead of moving the pointer across distances to expand an entity in the navigation tree, focus the entity using one hand, and then hit the Enter key on your keyboard. This is by far the fastest way to traverse through the entities.
In this example Entity "Databases" contain two databases of which one indicates abnormal state. When you select this database and step down to its panel, you will see timelines of all its instances.
Figure 6-5 Entity 'Databases' containing two databases
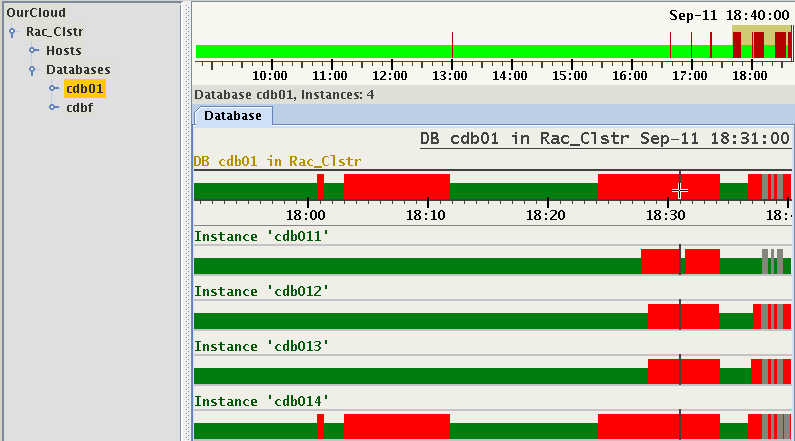
From this example, you can clearly see that the state of the database is a union of states of its instances. This example also shows gray areas in the status bars of instances. They indicate absence of monitored values for some periods in time. The entity might have been stopped, terminated, evicted, or non-responsive. The only known fact is that not a single value was recorded for this entity at this point in time.
With the Instances, we reached one of the final Sub-Entities. These are the Target Entities of CHA. Every type of Target entity has its own specialized panel in AHF Scope.
Related Topics
Parent topic: Cluster View: Connecting and Basics of Monitoring
6.2.2 Target Entities
CHA currently supports two types of target entities: "Host" and "Instance". Using the same example above, lets enter the panel of the second from the top instance cdb012:
Figure 6-6 Target Entities
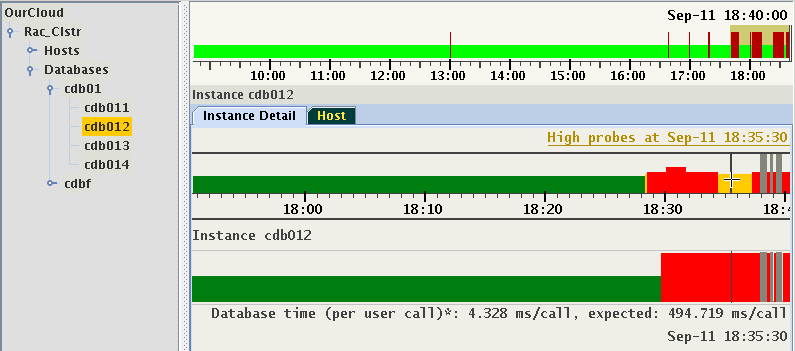
On the panel of an instance (or a host), the top timeline represents the state of the target entity. Any status timeline below represents a time series of individual metrics collected for the target entity, which are referred to as signals or probes. The state of a target entity is represented by four colors:
- Green: The state is normal. None of the probes are in abnormal condition.
- Yellow: Entity state is still normal, but some of the probes are in abnormal condition.
- Red: Entity is in abnormal state. At least one problem (also called "decision") indicates the reason for the abnormal state. The height of the red bar changes with the number of problems at that point in time.
- Gray: Data was not received.
Every single point in the timeline of a target entity holds a set of values:
- State of the entity, which may be green, yellow, red, or gray (missing).
- Set of problems (if indicating red state).
- Set of probes in abnormal state (if indicating yellow state).
The set of indicated probes may change with every time-point. By default, only probes which are in an abnormal state are shown. When there is no problem indicated, the target entity will be yellow on the timeline. There are a collection of options controlling selection of displayed probes that will be described later.
In the above illustration at the time 18:35:30, the state of the instance is indicated by a yellow bar, and below we see that the probe "Database time" is in an abnormal state. Its value at this point in time is 4.328 ms/call, albeit the predicted (or expected) value in the active calibrated model was 494.719 ms/call. The set of probes in abnormal state and their values may change in every individual point in time. When a probe value is reported in a sample, the data set contains:
- State of the probe (normal/high/low).
- Observed value, which may be missing at some points in time.
- Predicted value, which may also be missing at some points in time, or when no prediction for this probe is available, this value is missing at all points in time.
Not every probe is reported in every sample. Some probes might be reported only at certain points in time. A typical example of such probes are DB wait events. When a probe value is not reported, an empty space is displayed in the timeline denoted as gray. Below is another example for the same Target showing a sample at a different point in time. At this point in time, two probes are indicated as abnormal.
Figure 6-7 DB wait events
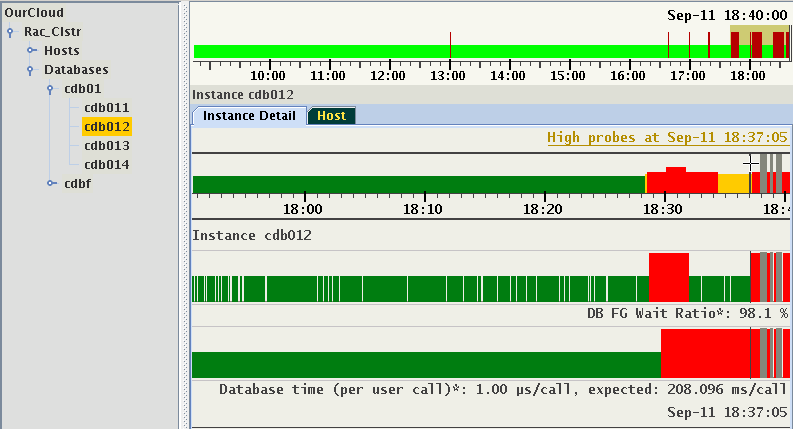
Notice the numerous gaps in the indication of "DB FG Wait Ratio". This is an example of a probe without expected values and whose observed value is not being reported with every sample. This differs from the indication in timestamps in which no values were reported for an entity. These periods of time are marked by the gray bars.
Every type of target entity has a unique panel with specialized tabs. For example, the panel of an instance has a tab "Host", which shows the host where the instance is running. Similarly, a panel of a host has a tab called "Instances", which shows a set of running database instances.
Generally, this panel is used to visualize dynamic dependencies between target entities. The navigation tree depicts only the hierarchy of the logical structure of the installation. The logical structure contains a mix of hardware and software target components in their hierarchical dependency. For example, an entity "Cluster" points to "Hosts", which contains a list of individual hosts. These relationships do not change with time. The dynamic dependencies describe how the target entities relate to each other. These relations may change with time. They are defined by pairs of target entities and ranges of time in which they are valid. Some of these relations may be exclusive. For example, at a specific point in time, an instance is said to run on one host. However, a host can have a number of instances running on it at the same point in time.
6.2.2.1 A Host Panel
A Host panel has two tabs: "Host Detail" and "Instances".
Figure 6-8 Host Panel
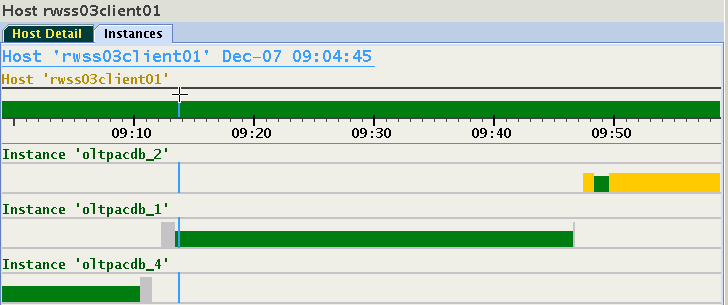
This host is running three different instances between 9 and 10 o'clock. Something happened around 9:11 and 9:46, which caused the instance to shut down, or change its host. As more than one instance from different databases may run on a host, there is a 1:N relationship. After approximately 9:48, two instances are running on this host.
Figure 6-9 Panel of a Host
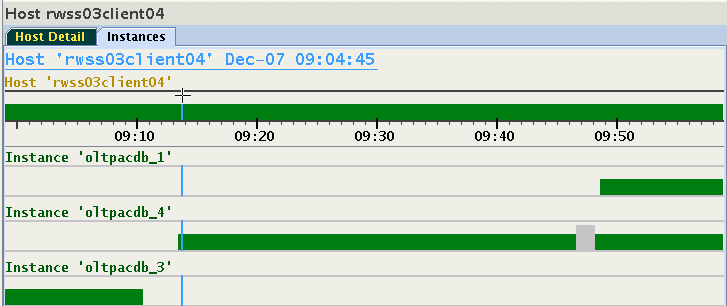
To switch from a host panel to the desired instance panel, move focus to any of the instances using down or up arrow key and hit the Enter key on your keyboard, or double-click any of the instance names. The display will switch to the panel of the chosen instance, select its node in the navigation tree, and expand the navigation tree to make this node visible.
Parent topic: Target Entities
6.2.2.2 An Instance Panel
From the above example, let us switch to the instance otlpacdb_3. It is the customary status
panel.
Figure 6-10 Instance Panel
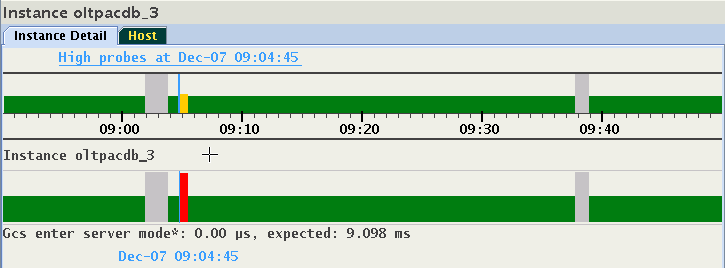
The panel displays two interruptions in service mentioned in the previous section. This display does not indicate that the instance was in fact running on more than one host at different points in time. Click the "Host" tab to visualize where the instance was running. The relationship is 1:1. An instance runs always on only one host at a particular point in time.
Figure 6-11 Instance Panel
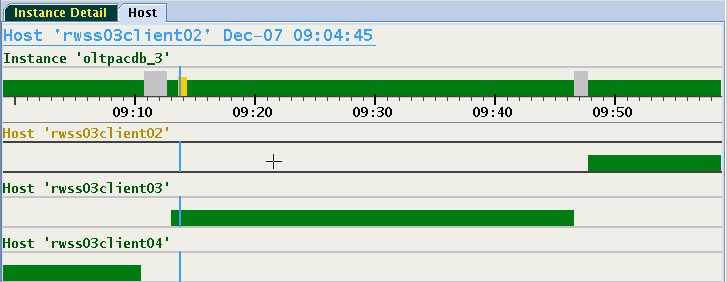
From this display, switching to any of the hosts is performed by either double-clicking its name, or by selecting the timeline and hitting the Enter key on your keyboard. Using this method, you can quickly switch between host and instances. As the image illustrates, this panel displays a form of cascaded time ranges from most recent on top to the oldest on the bottom. When resizing the window, the display may change dynamically causing timelines to be added or removed.
Figure 6-12 Instance Panel
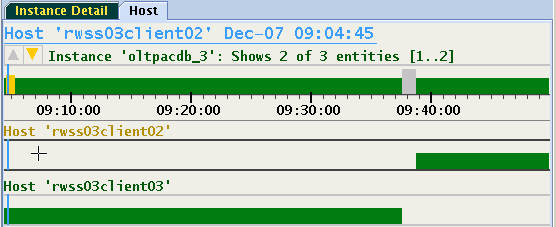
The run time of the instance on host rwss03client04 is no longer indicated because it ended prior to 9:04 and this time is not shown in the narrower window.
Parent topic: Target Entities
6.2.3 Browsing Through Time and Pin Operation
AHF Scope display is dynamic when connected to a GIMR and receiving live data in real-time. AHF Scope is receiving new samples and advancing all timelines. With every new sample or with a change of a cursor position, the corresponding time point is automatically displayed with a set of abnormal probes together with their values. This time point is indicated by a vertical marker. Once a time point of interest is identified, it can be "pinned" using
- Double-click any time at the target status timeline.
- Press the Hot Ley "p" while hovering over target status timeline.
- Press the left or right arrow key while hovering over target status timeline.
The pinned time point may be fine-tuned by pressing the left or right arrow keys and observing the displayed timestamp. Once the time point is pinned, the position marker will no longer follow the cursor. Its color changes from orange to blue to indicate this mode of operation. Moving the cursor to any other time and pressing "p" changes the pin point to the new location. Pressing "f" will unpin the time point causing it to again follow the cursor.
Note that pinning to a specific time point selects its corresponding set of probes in abnormal state. When browsing through the visible values of this set, the pin point can be preserved. To achieve this, either hover cursor over the timelines of the probes, or use the down arrow key to move focus to these timelines. Press and hold the Control key and move the timestamp marker sideward using mouse or left or right arrow keys. Besides the light blue pin marker, a second marker is displayed following the cursor position. The bottom information line shows the time point associated with this marker. The floating label at the bottom of each bar graph shows the values at the position of the cursor.
Figure 6-13 Browsing Through Time and Pin Operation
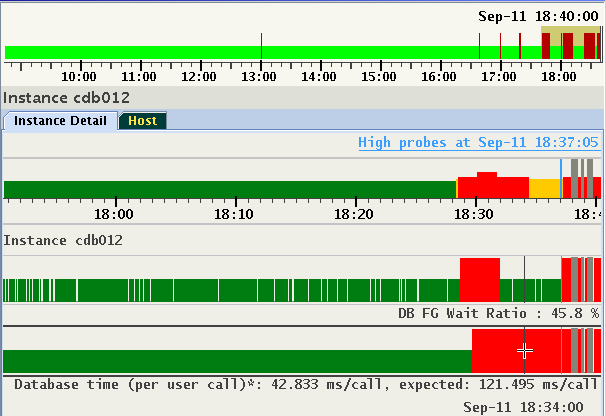
Image shows a set of two probes in abnormal state at pinned time 18:37:05. Press the Control key and move the cursor along the timeline. Each position corresponds to a different point in time. In this example, the values sampled at 18:34:00 of a set of probes selected at 18:37:05 are shown. With the Control key remaining pressed, use the left ot right arrow keys to step through time points one sample at a time.
To activate this feature permanently, select the checkbox "Follow Cursor" in the floating menu.
Pin point is automatically preserved in every entity sharing the same cluster. This feature is used to move between different panels and explore values of probes at the same time point. When viewing live data, the pin will be released when its timestamp reaches the left or right end of the viewport.
Parent topic: Cluster View: Connecting and Basics of Monitoring
6.2.4 Changing the Set of Visible Probes
By default, only probes in abnormal state are displayed in yellow for every time point. When the selected time point is marked red, a set of problems is active (see Problems or Anomalies), each with its own set of abnormal probes. At this point, only the description of the problem is displayed. Once a problem is selected, its associated set of abnormal probes are identified and displayed. This will be discussed further in Problems or Anomalies.
You may prefer to display all high probes at any time point, or perhaps explore visually the time series of every probe regardless of their state.
The following are the custom settings for the selection of probes:
- Display only abnormal probes (the "yellow" marked zone) or probes of a selected problem. This is the default behavior.
- Display always all abnormal probes (on "yellow" or "red").
- Display every existing probe regardless its state.
- Display all probes belonging to the same category (called "correlated probes").
- Display every abnormal probe in a specific time range. For more information, see Selecting Abnormal Probes in any Time Range.
- Display only a subset of existing probes (3) by their category. For more information, see Selecting Custom Set of Probes.
The following examples show how to select options (2), (3) and (4) from the above list. Use either floating menu or a Hot Key to change the mode in which probes are being displayed.
Figure 6-14 Changing the Set of Visible Probes
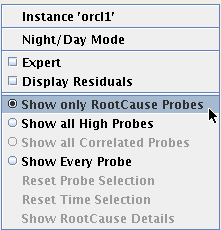
Either select "Show all High Probes" or press "a" to display every high probe at any point in time. Select "Show Every Probe" or press "A" to view every probe regardless of its state.
Figure 6-15 Changing the Set of Visible Probes
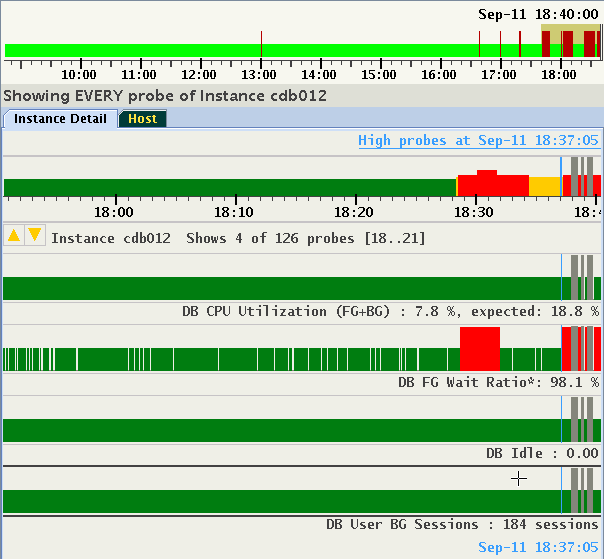
The number of probes may exceed the size of the display window. In this example, only four probes out of a total of 126 can be displayed. The Status label under the time line indicates which subset of probes is being shown and provides up or down arrows to navigate. In this example, probes 18, 19, 20 and 21 are displayed. Both up/down icons are highlighted indicating that scrolling both directions is available using cursor up/down or page up/down keys or using the mouse wheel.
It is also possible to display all probes belonging to the same category. Categories of probes will be explained in the section devoted to Expert Mode. Every probe may belong to one or more pre-defined categories. For example, "Buffer Cache," or "Global Cache Exceptions" are categories of probes associated with database instances.
Note that when the cursor hovers over any probe's timeline, its boundaries are highlighted as it gets focus. Alternatively, use the up or down arrow keys to move focus to a specific probe without moving the mouse pointer. Figure 13-17 focus is on "Log file sync":
Figure 6-16 Changing the Set of Visible Probes
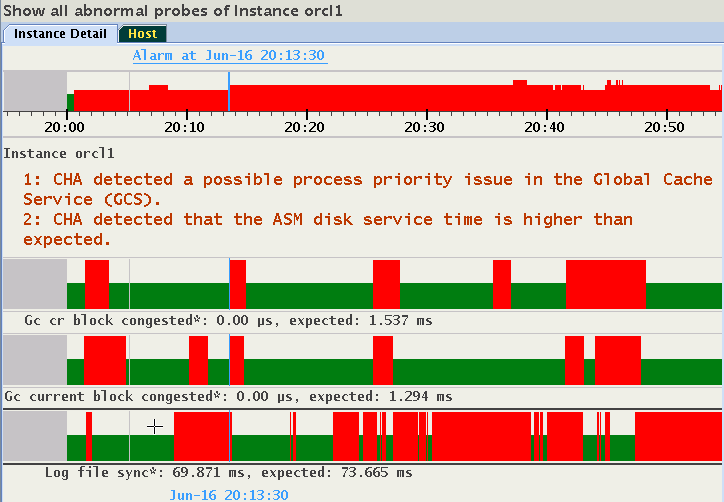
Use the right-click popup menu, or press "c" to display all correlated probes belonging to all "Log file sync" member categories.
Figure 6-17 Changing the Set of Visible Probes
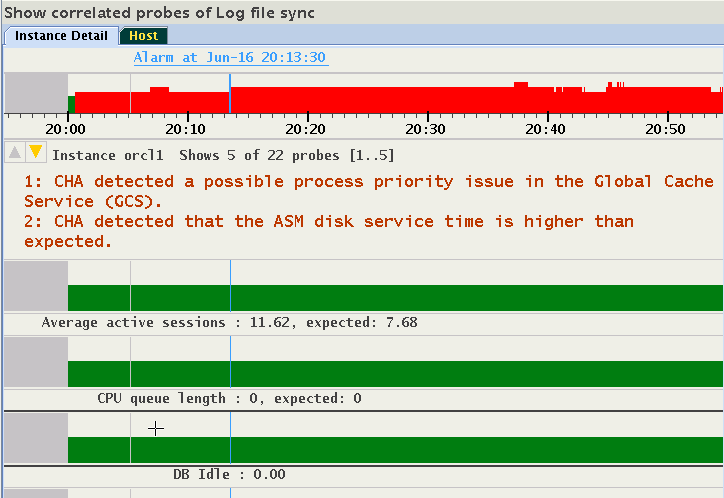
Should the number of probes not fit into the display, the up/down cursor icons appear and the status line shows details about visible subset of probes. See Expert Mode for the steps to select and create subsets of probes.
6.2.5 Selecting Abnormal Probes in Any Time Range
Tracking probes in abnormal state between times points is supported. Move the cursor to the first time point, press the Shift key, press the left mouse key and move the cursor to the second time point, release the mouse button, and then release the Shift key. The selected time range is indicated by a gray bar under the time line. The information strip indicates that a "Time Filter" is active. In the example, a total of 7 probes are indicated high between 18:27 and 18:40, with probes 1 to 5 visible in the display:
Figure 6-18 Selecting Abnormal Probes in any Time Range
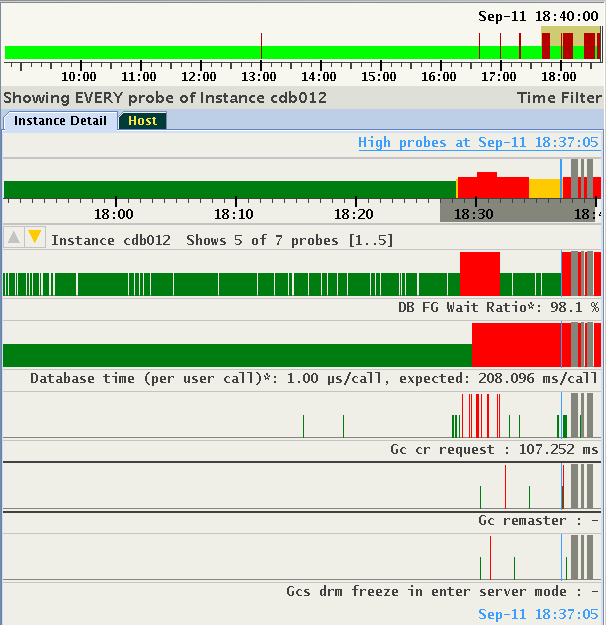
The selection of time range is preserved cluster-wide similar to a selection of pin point. You can change target entities and see the sets of abnormal probes in the selected time range. For example, in the same period in time, only four high probes for another instance of the database are detected.
Figure 6-19 Selecting Abnormal Probes in any Time Range
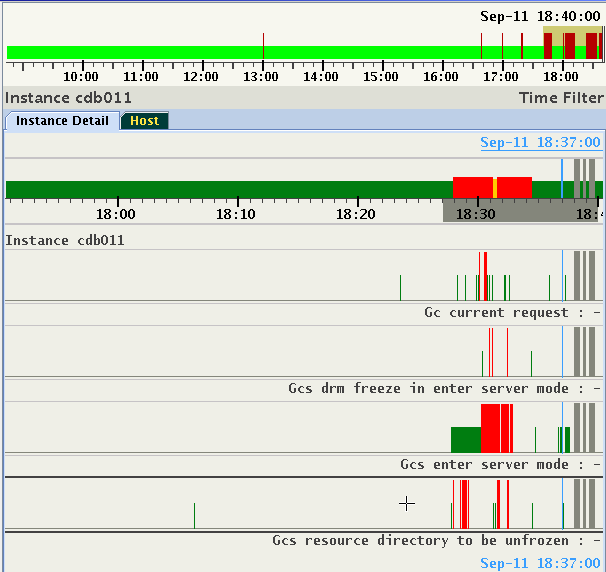
To deactivate the filter, either select "Reset Time Selection" on the right-click pop-up menu, or hit the Escape key on your keyboard.
Parent topic: Cluster View: Connecting and Basics of Monitoring
6.2.6 Problems or Anomalies
Whenever the timeline of the entity displays red, one or more problems exist at that timestamp. Every problem contains the following information:
- Name: This is an internal identifier.
- Description: An explanation of the nature of the diagnosed problem (displayed by default on the panel).
- Confidence probability in percentage (may differ at every time point).
- Root cause and diagnosis of the problem.
- Suggested corrective actions.
- Set of probes associated with the problem (may differ at every time point).
- Set of inference chains in Bayesian Network. One chain per probe associated with the problem.
- Set of tables with detailed information (optional, calculated per time point).
Portions of this information will be displayed only in the Expert Mode, described in Expert Mode. Below is an example of two problems indicated at 18:31:00:
Figure 6-20 Problems or Anomalies
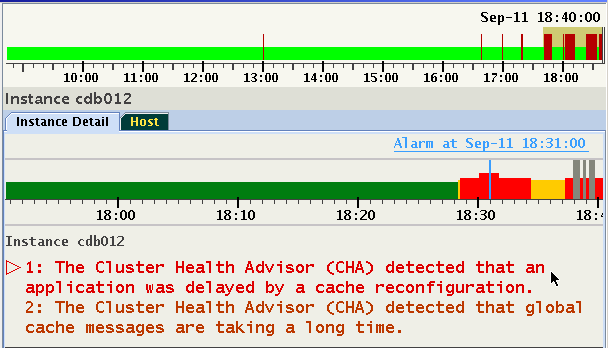
Problems are listed in the order of their confidence probability. Problems that have probes that are Key Performance Indicator (KPI) will be displayed at the top of the list regardless of their confidence probability. The order and set of problems may differ at each time point, and a set of probes raised for each problem may vary with every time point.
The problem with a focus is indicated by a color change and a right arrow to the left of its number. Focus may also be changed using the up or down arrow keys.
Each problem has a set of probes in abnormal state. As long a specific Problem is not selected, AHF Scope will not display any probes. This default preference for display of probes may be changed by using the right click pop-up menu, or by using a Hot Key. For example, when selecting radio button "Show all High Probes" or pressing "a", all abnormal probes across all problems at 18:31 are displayed.
Figure 6-21 Problems or Anomalies
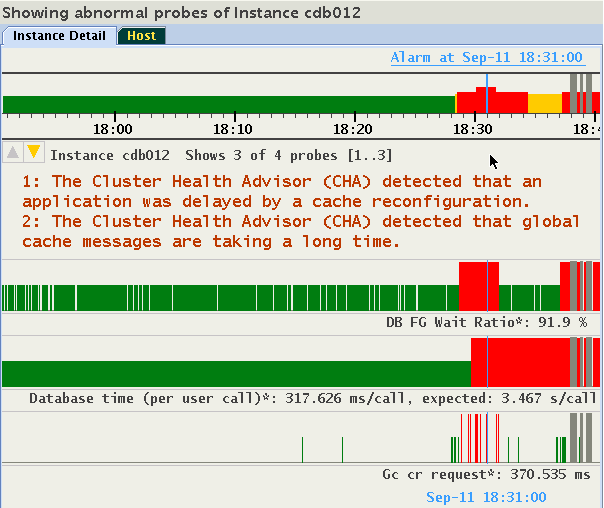
The highlighted up/down icons in the upper-left side of the panel indicates that not all probes can be displayed. In this example, the information bar displays "Shows 3 of 4 probes [1..3]". Use down/up Arrow or the page up/down keys to scroll through the probes while keeping same time position.
Probes specific to a problem are still available by returning to the default mode, and by selecting the problem of interest. Press "a" again to remove the display of all abnormal probes and return to the default mode.
To step through the analysis of a problem in detail, highlight the problem and either click it, or hit the Enter key on your keyboard. This action selects the highlighted problem and displays the root cause diagnosis and a recommended corrective action. In addition, on the status timeline every occurrence of the same problem is displayed in magenta. In the example below, the top problem was indicated between 18:28 and 18:34:
Figure 6-22 Problems or Anomalies
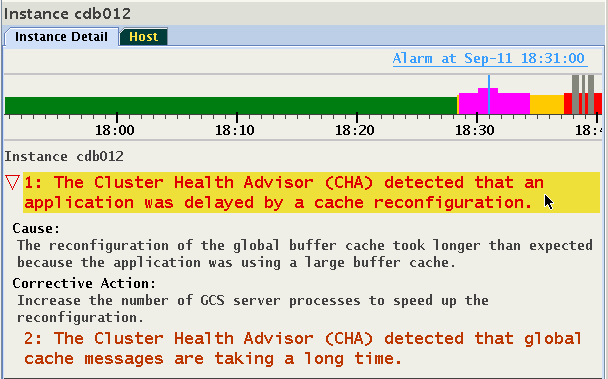
To switch to another problem, either click it, or use the up/down arrow to highlight it, and then hit the Enter key on your keyboard. Note how the magenta marked time period has changed on target's status timeline.
Figure 6-23 Problems or Anomalies
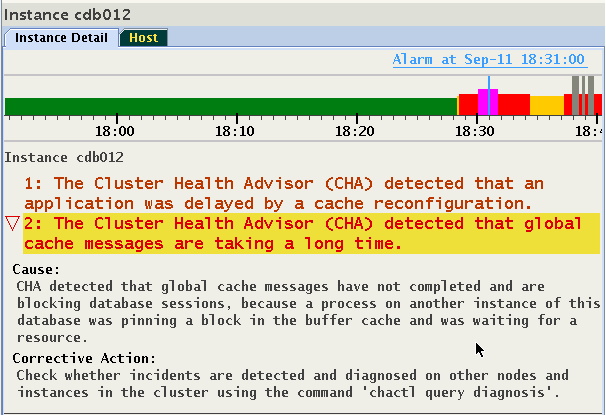
Click once more on the selected problem, or hit the Enter key on your keyboard to display the set of the probes providing evidence supporting the problem determination. In this example, the problem has only one probe, "Gc cr request":
Figure 6-24 Problems or Anomalies
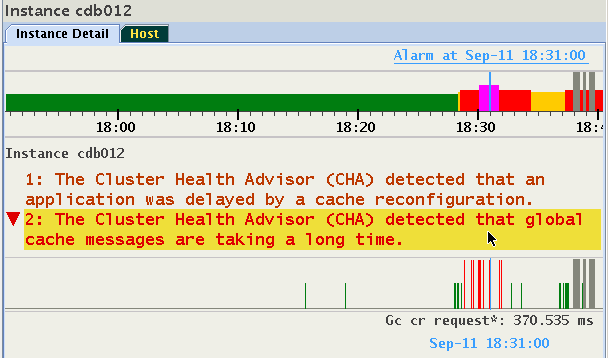
Hit the Enter key again, and note that the display returns to its list of problems to facilitate analysis of the additional ones. There are the following three problem displays which cycle upon clicking or pressing Enter.
- Problem is highlighted (empty right arrow points to the problem name).
- Problem is selected, shows textual descriptions of cause, corrective action (empty down arrow points to the descriptions).
- Problem is selected, shows status timelines of probes associated with the problem (filled down arrow points to the probe timelines).
Note that when selecting a different problem by a mouse click or using Enter, the display mode stays the same allowing stepping through each problem in the same mode.
Related Topics
Parent topic: Cluster View: Connecting and Basics of Monitoring
6.2.7 Browsing through active time of a Problem
Once a problem is selected, the time periods in which it was active is marked by a magenta color on the status timeline. Press and hold the Shift key and use the left or right arrow key to fast forward to a previous or next active time point in which this problem was indicated. As shown in Figure 13-25, for example, at 22:17:55 a "DB Writer checkpoint" problem is displayed. The magenta color shows several time ranges in which this condition was also diagnosed.
Figure 6-25 Browsing through active time of a Problem
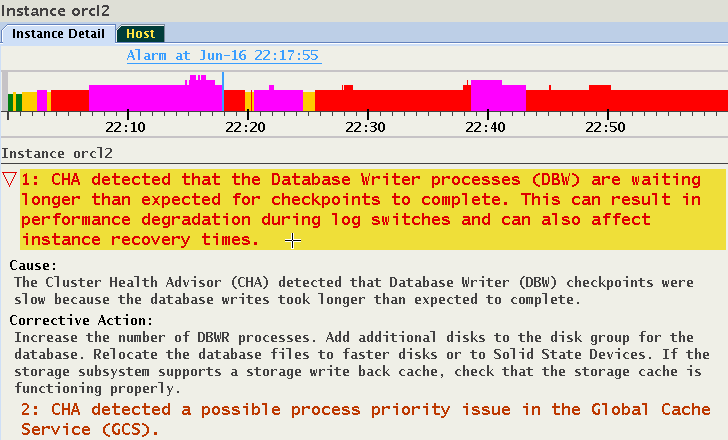
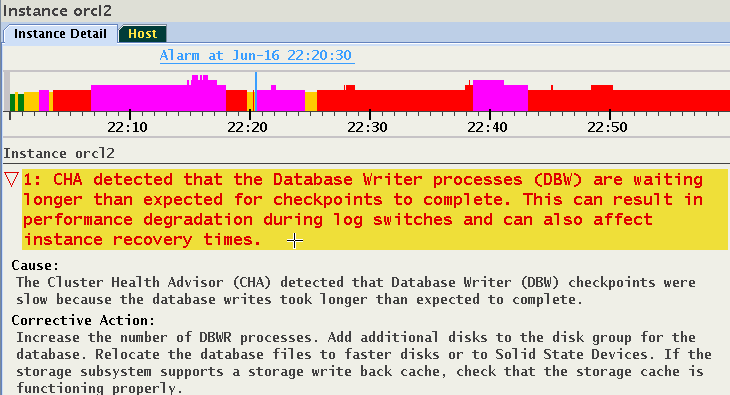
The selected timestamp is at the end of the magenta colored time range. Press Shift+Right Arrow keys and the cursor will move to the next later timestamp in which the same Problem was reported. In this case, it was 22:20:30, approximately two minutes later.
Figure 6-26 Browsing through active time of a Problem
Parent topic: Cluster View: Connecting and Basics of Monitoring