5.3 AHF Insights - Home
Summarizes the System State, System Types, and Time Range the report was generated. As well, it provides a brief overview of the topology of the system and insights into the diagnostics collected by various AHF components.
Click on an item on the Home page to view details. Concurrently, you can open more than one item. A userscore highlights the item in focus. Use the up/down arrow keys on your keyboard to move the page horizontally. To get to the top of the page, click the Scroll to top button. To close an open item, click the X mark.
Click Send Feedback to provide your comments or suggestions about AHF Insights, and then click Submit.
Figure 5-1 Home
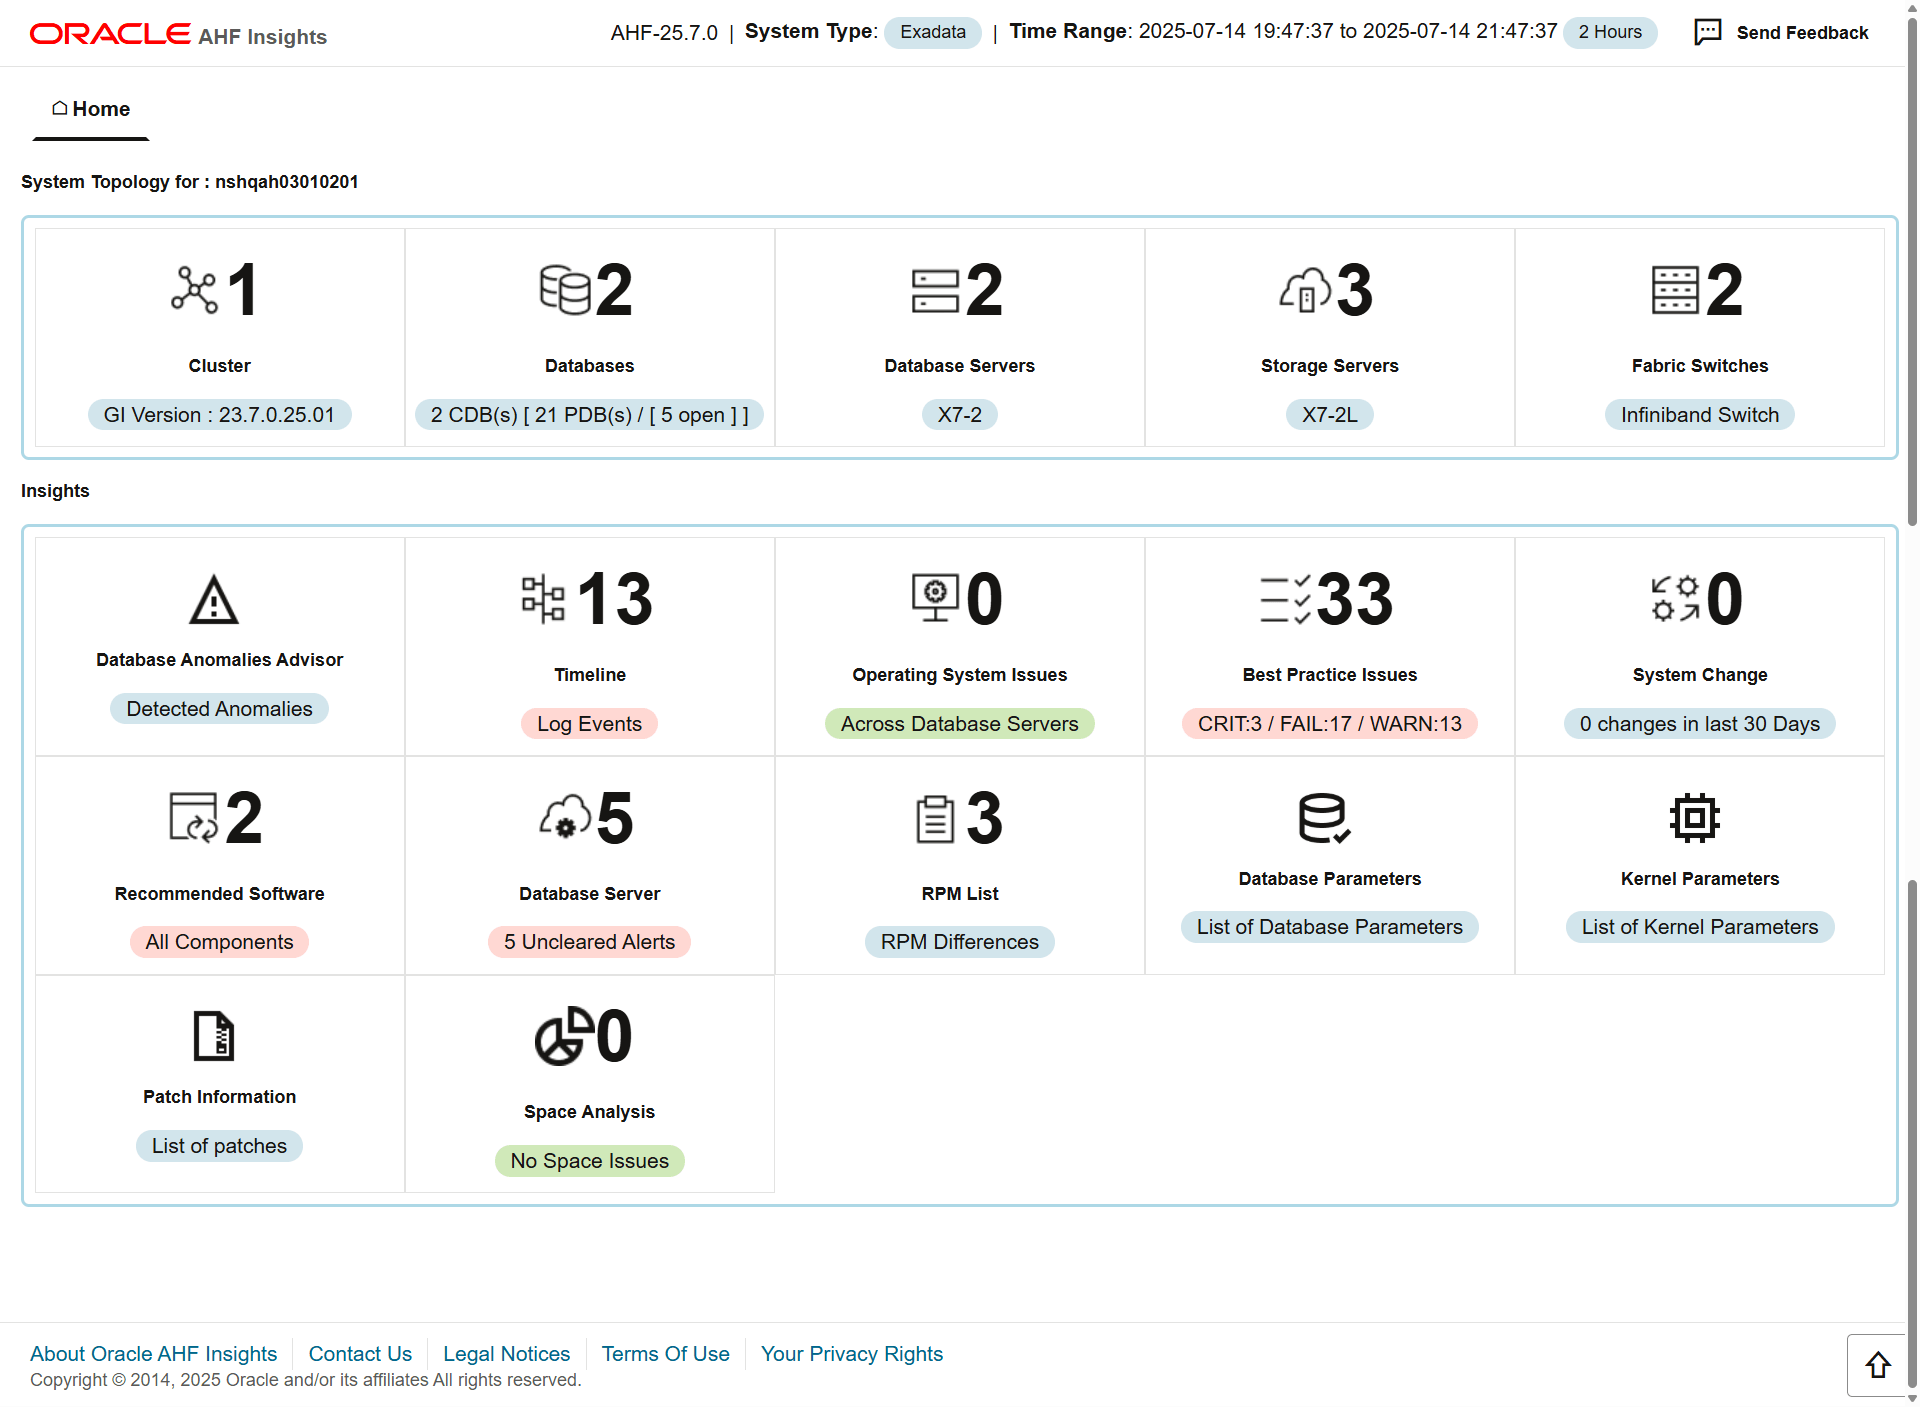
System Topology
- Cluster: Provides a summary of cluster and cluster resources, and ASM details.
- Databases: Provides basic and detailed information about Oracle Databases running on the system.
- Database Servers: Provides basic information about database servers.
- Storage Servers: Provides basic information about storage servers.
- Fabric Switches: Provides basic information about RDMA Network Fabric Switches.
Insights
- Database Anomalies Advisor: Analyzes database anomalies, identifies their root causes, and recommends corrective actions.
- Data Guard: Streamlines Oracle Data Guard readiness by evaluating failover and switchover preparedness, comparing configurations between primary and standby databases, and highlighting critical performance metrics in the Data Guard section.
- Timeline: Provides Timeline visualization in a graph and provides a table with specific information about each timestamp.
- Operating System Issues: Provides details about the metrics collected on the system and a detailed report on operating system anomalies.
- Best Practice Issues: Provides the results of Best Practices Compliance checks run on the system, paginated.
- System Change: Provides details on the changes applied to the system, paginated.
- Recommended Software: Lists recommended software and links to supported versions.
- Database Server: Provides details about the Management Server metrics and the alerts recorded in the Management Server.
- RPM List: Lists RPMs and the differences between them across nodes, paginated.
- Database Parameters: Lists normal and hidden Oracle Database parameters, paginated.
- Kernel Parameters: Lists the kernel parameters, paginated.
- Space Analysis: Renders Disk Utilization and Diagnostics Space Usage data in visual and tabular format.
- Performance Reports: Provides reports to monitor and analyze database performance
Parent topic: Explore Diagnostic Insights
5.3.1 System Topology
Note:
Fabric Switches and Storage Servers sections will not be displayed in a non-Exadata environment.Parent topic: AHF Insights - Home
5.3.1.1 Cluster
AHF 23.8
Starting in AHF 23.8, you will be able copy data in text format into the clipboard to post it into SR body while raising a service request.
How does AHF Insights UI render this information
Provides a summary of cluster and cluster resources, and ASM details.
Cluster Summary
Figure 5-2 Cluster Summary
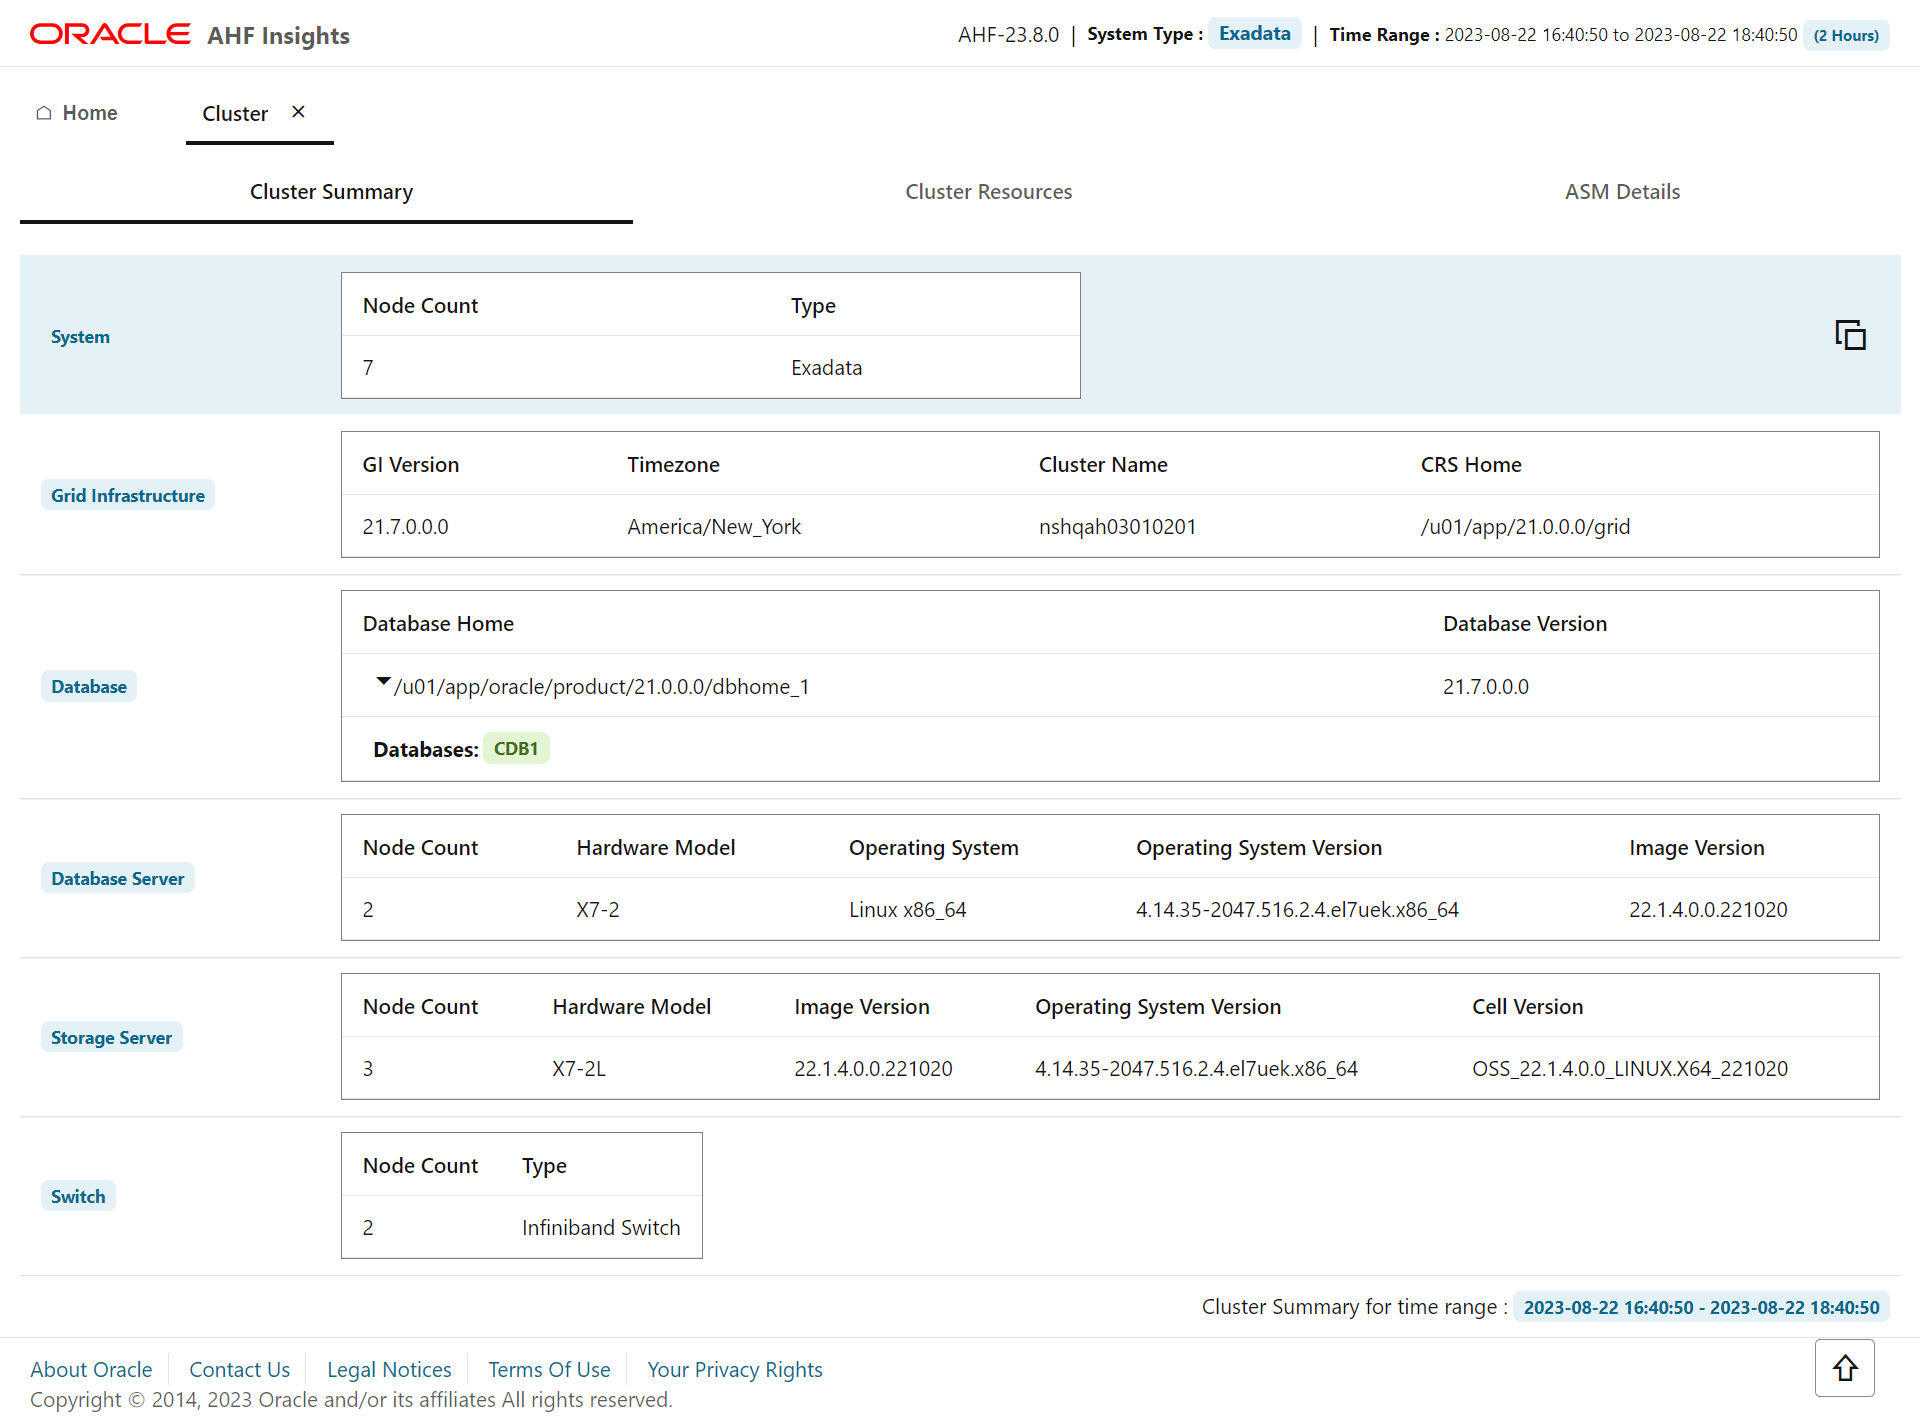
Provides a brief overview on System, Oracle Grid Infrastructure, Incident, Oracle Database, Database Server, Storage Server, and RDMA Network Fabric Switch.
- Click the arrow located inside the Database Home section to get Database Home details.
- Click Copy as text to copy the cluster summary into the clipboard.
Cluster Resources
Figure 5-3 Cluster Resources
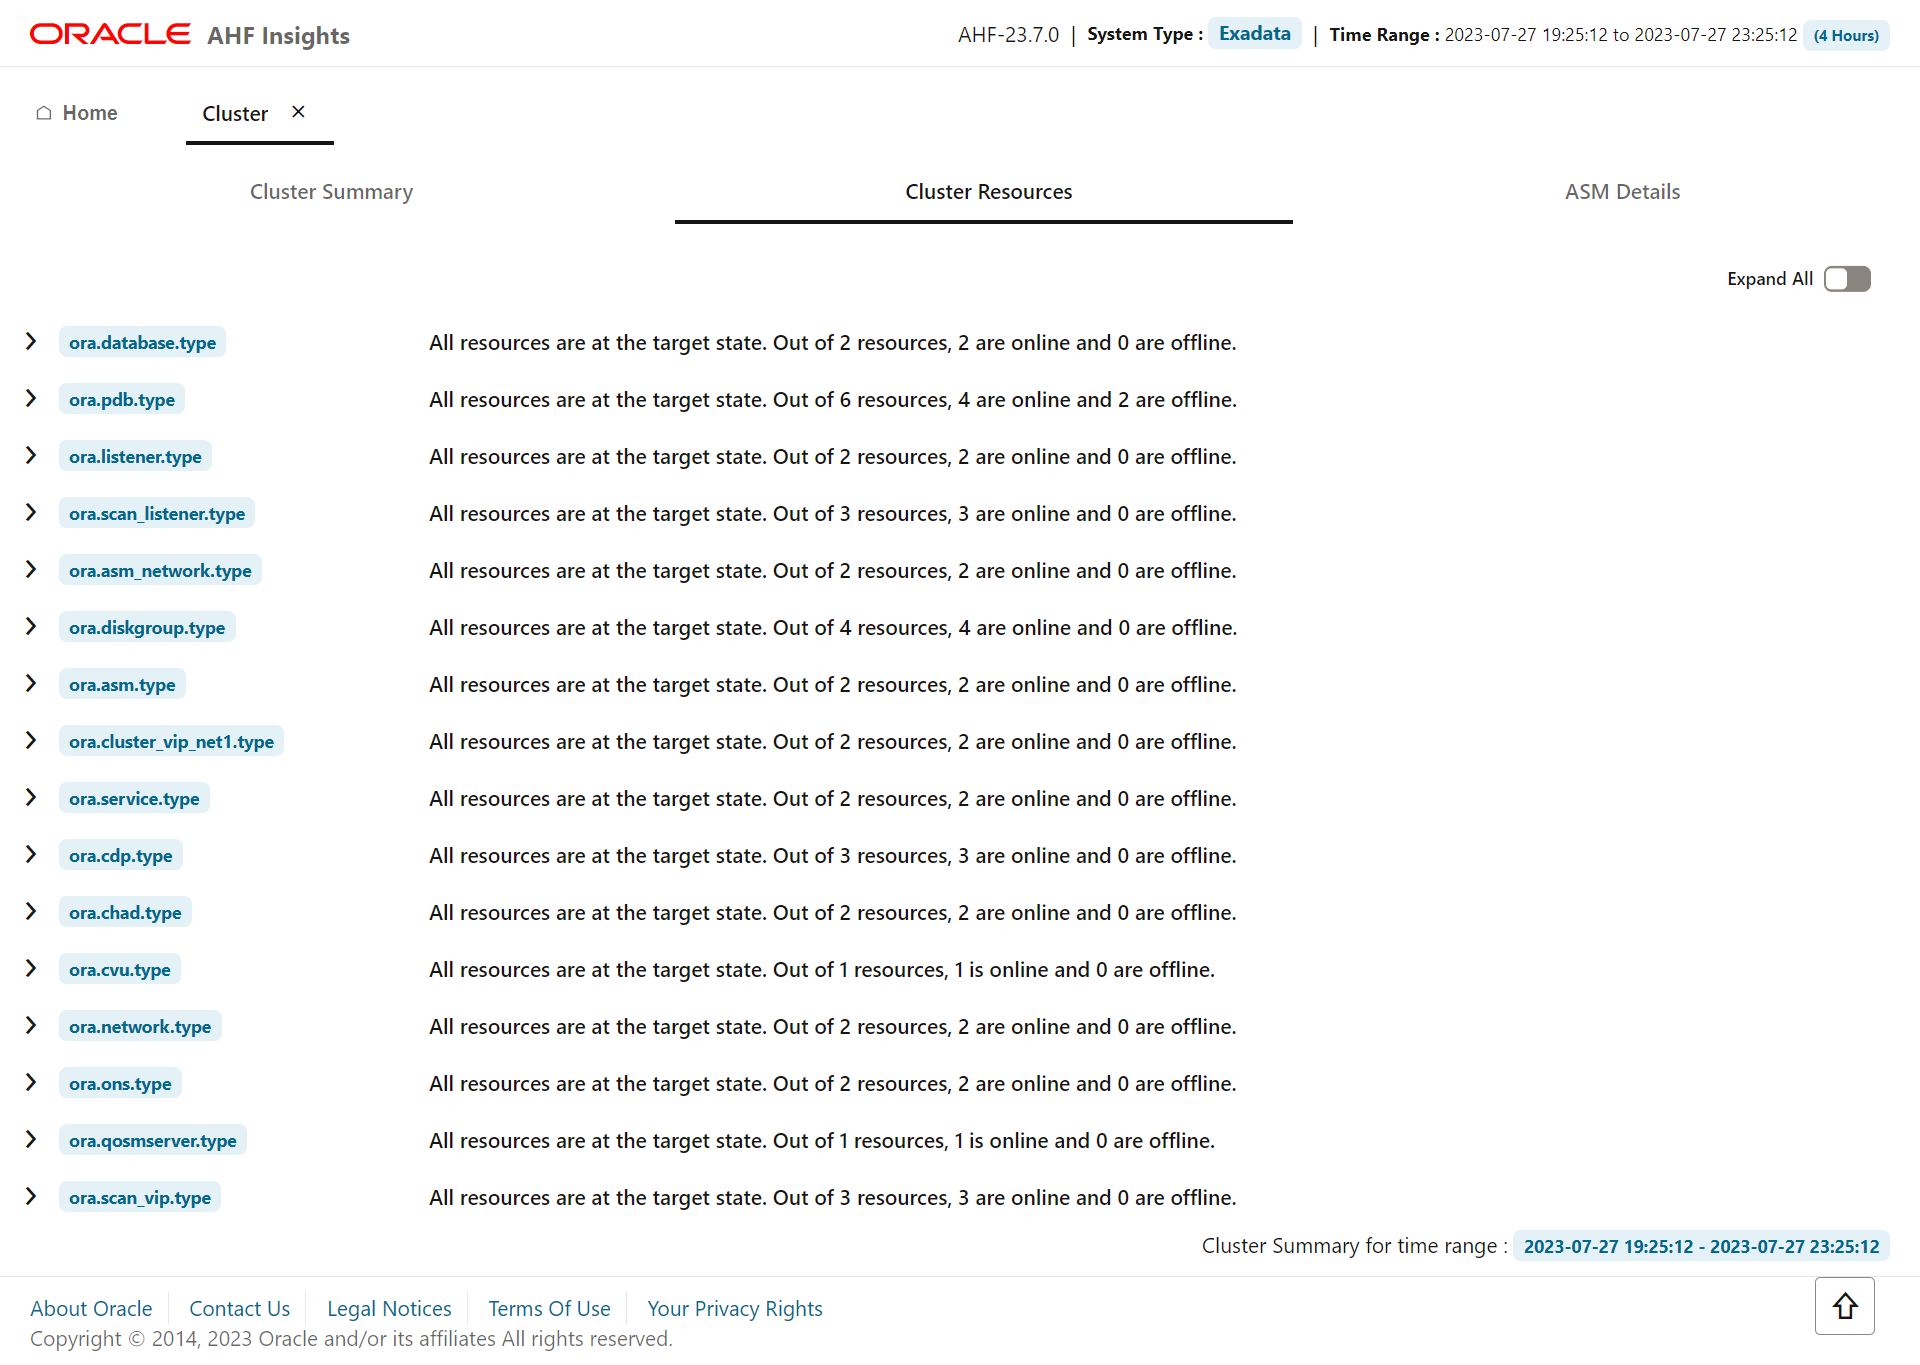
Provides details on the cluster resources, Oracle Database, pluggable database (PDB), and listener, paginated. The details include CRS resource names, online or offline statuses of the targets, state of the resources, and the servers on which the resources are running.
- Click the Expand All toggle button to view details of all cluster resources.
ASM Details
Figure 5-4 ASM Details
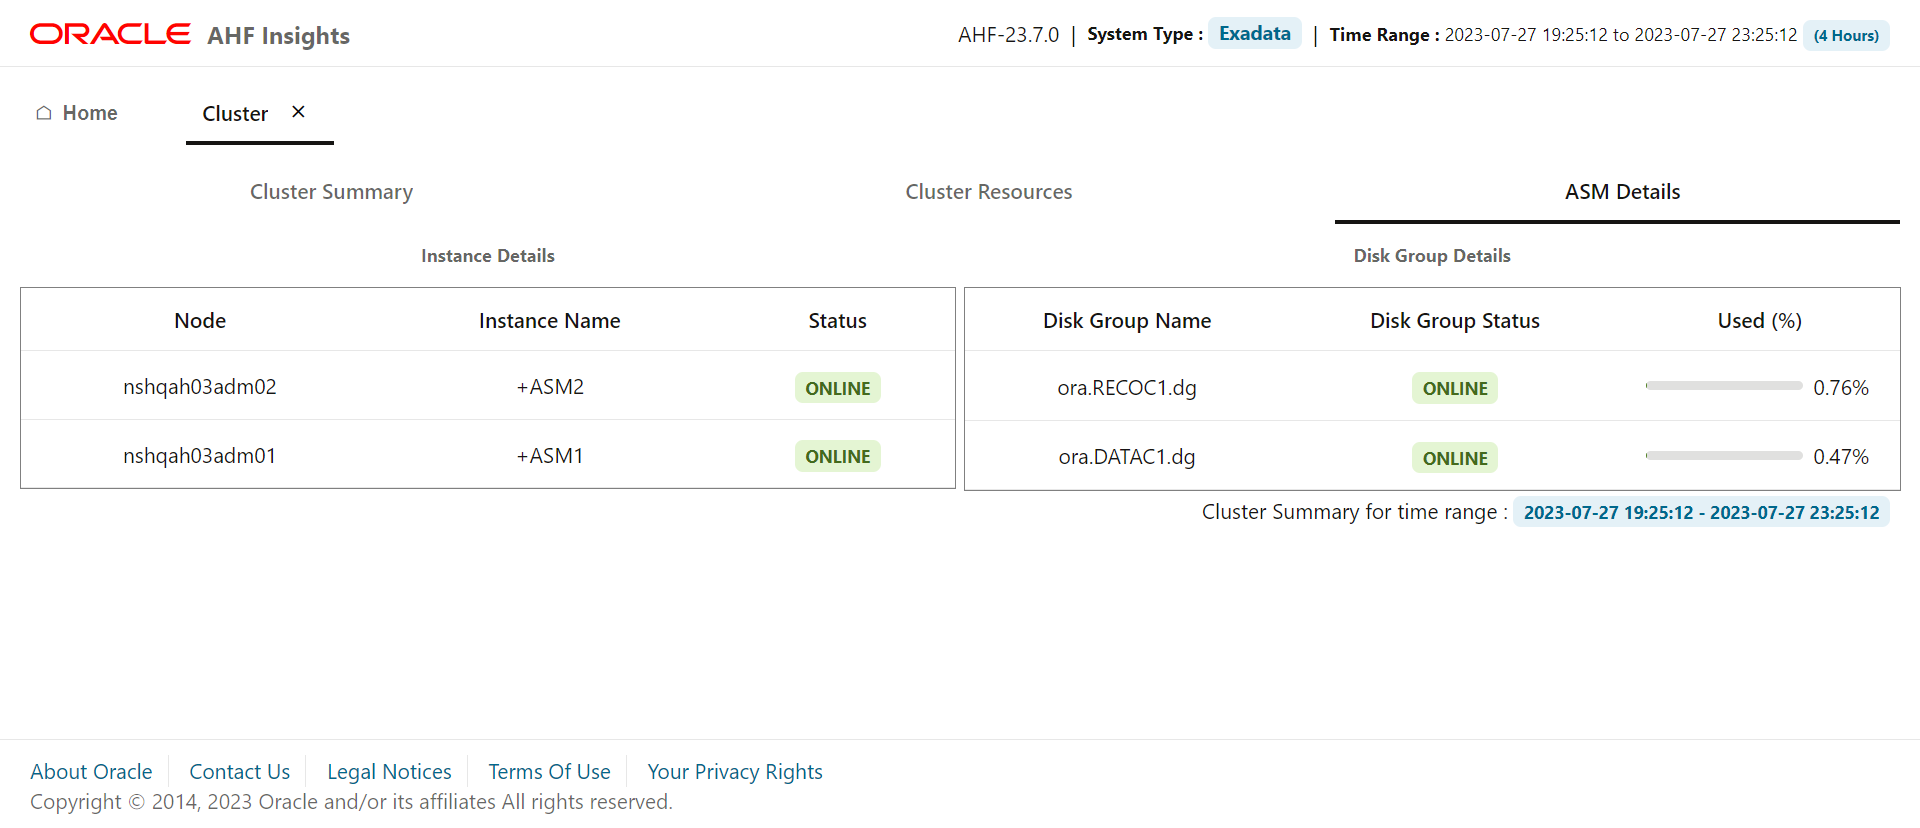
Provides details on the nodes, instance names, online or offline statuses of the nodes, disk group names, online or offline statuses of the disk groups, and percentage of disk usage, paginated.
Click Show in the Disk Group Status column of the Group Details table to view the disk group details for each cluster node in a side panel.
Parent topic: System Topology
5.3.1.2 Databases
AHF 23.8
Starting in AHF 23.8, you will be able copy data in text format into the clipboard to post it into SR body while raising a service request.
How does AHF Insights UI render this information
Figure 5-5 Databases
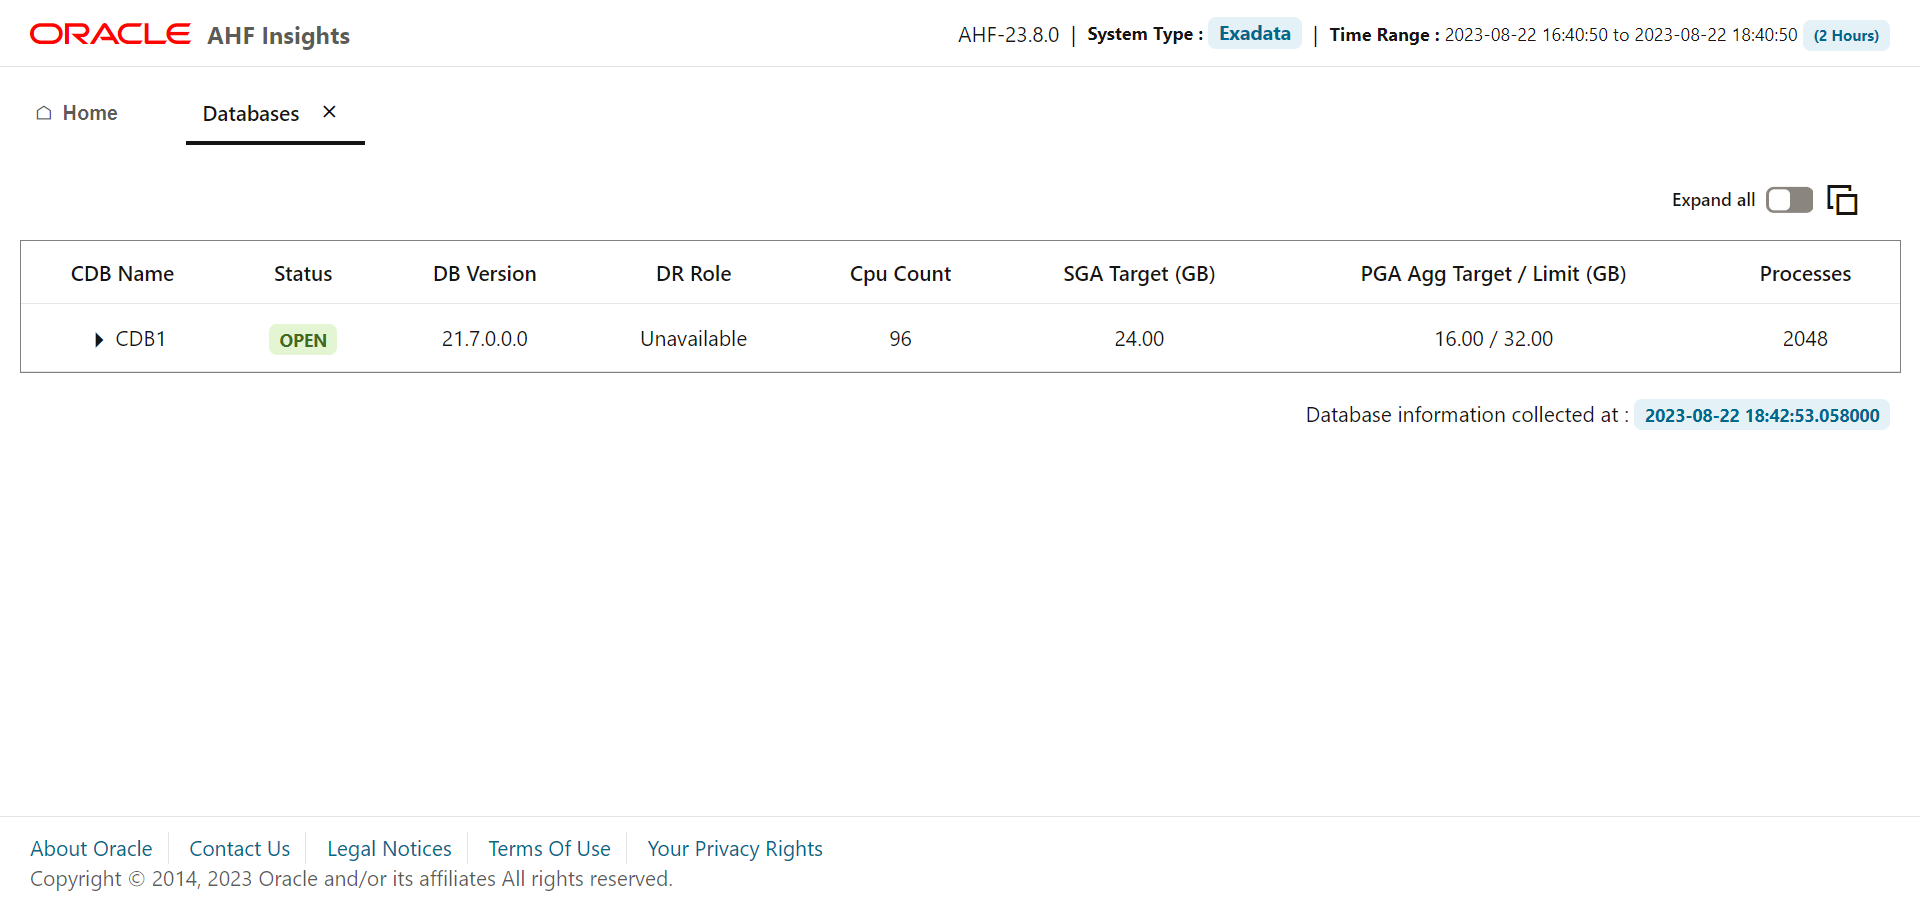
Provides basic and detailed information about Oracle Databases running on the system.
- Click Copy Snippet to copy the database instance details, PDB details, and tablespace details into the clipboard.
- Click Show in the Details column to view the database instance details, PDB details, and tablespace details in a side panel.
Parent topic: System Topology
5.3.1.3 Database Servers
AHF 23.8
Starting in AHF 23.8, you will be able copy data in text format into the clipboard to post it into SR body while raising a service request.
How does AHF Insights UI render this information
Figure 5-6 Database Servers
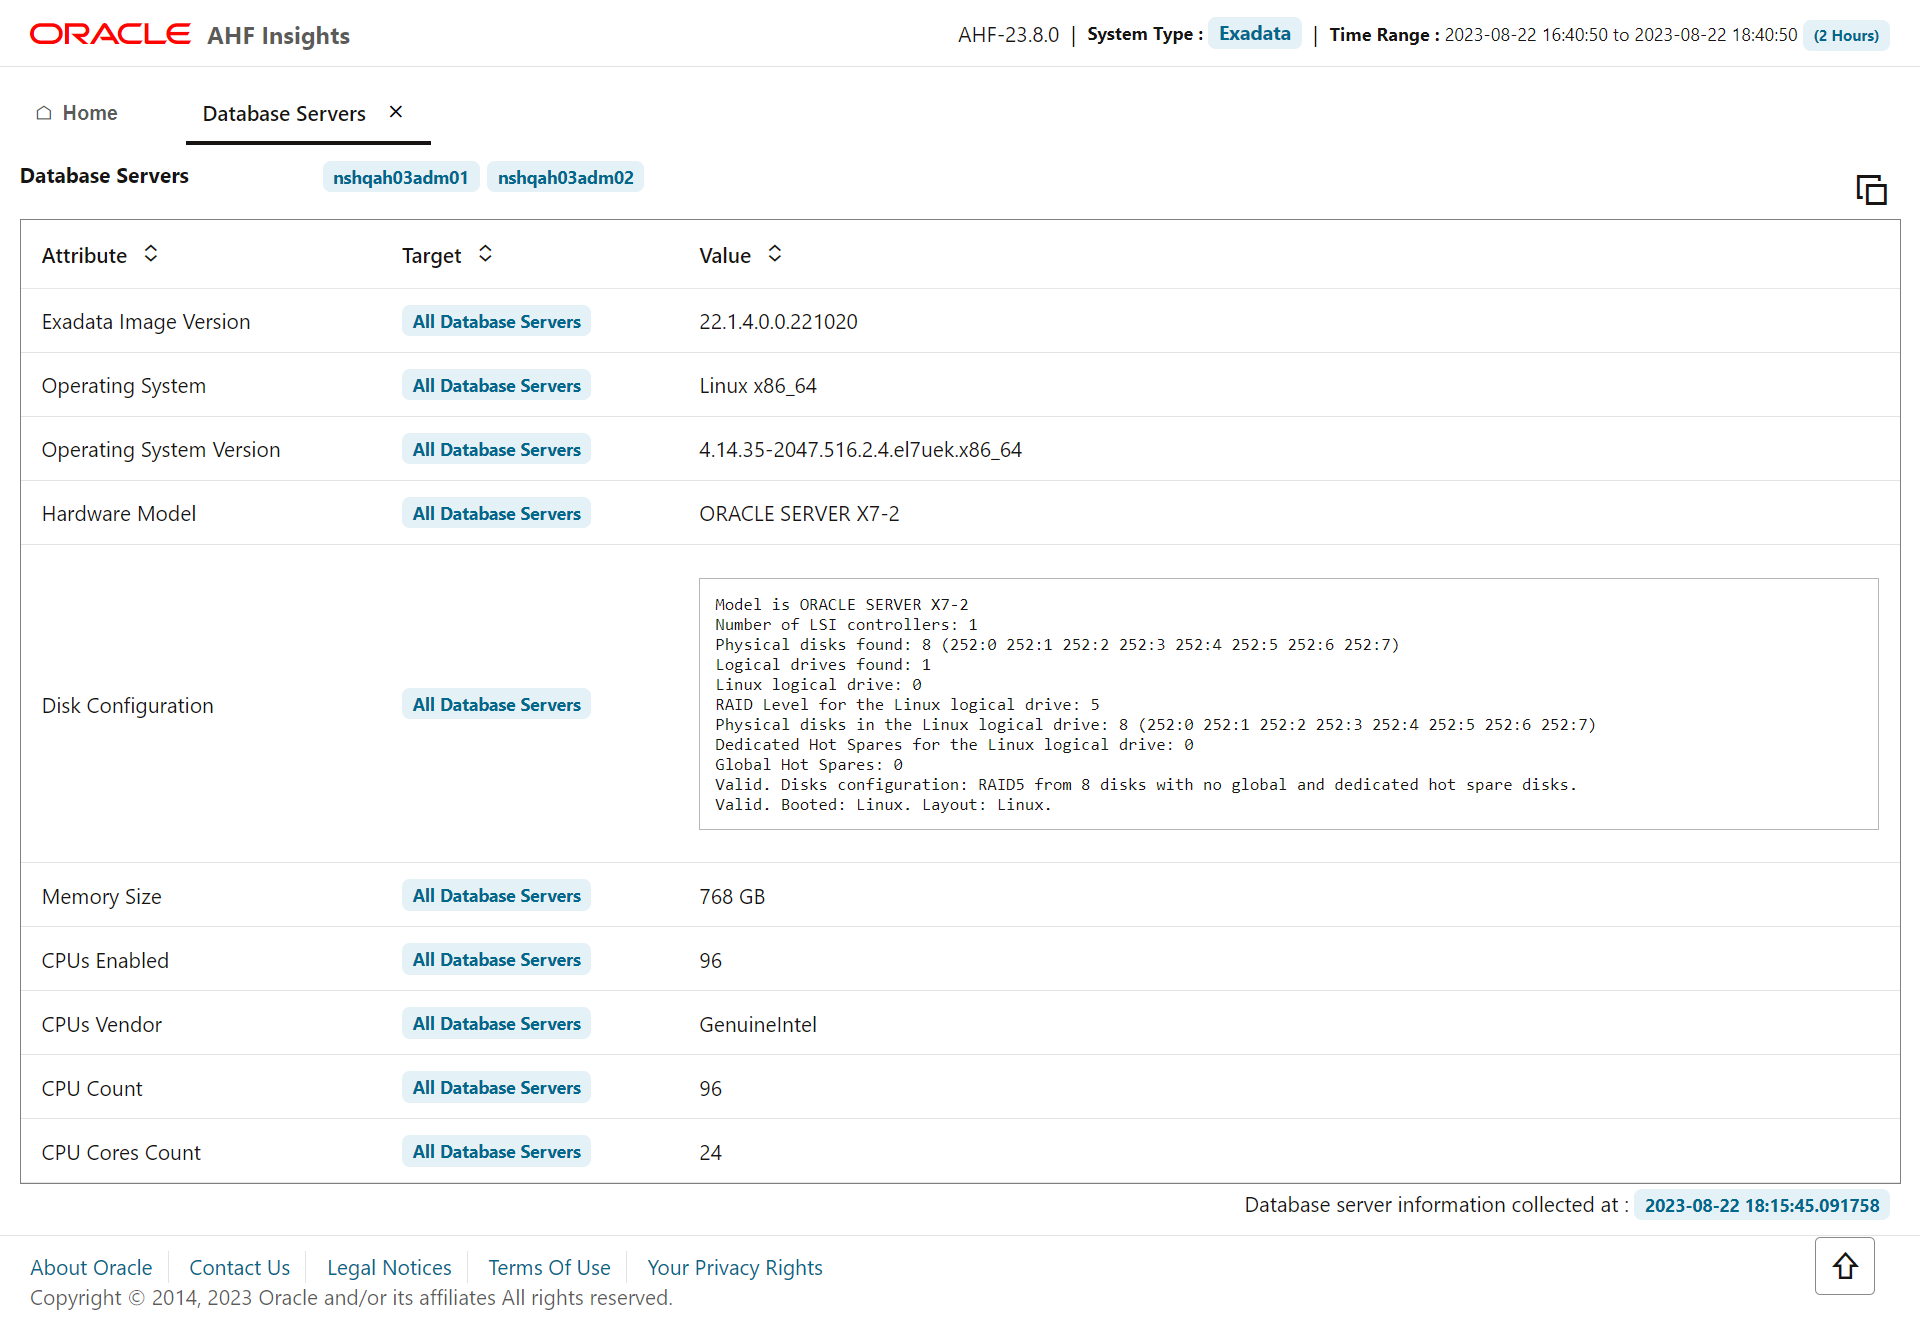
- Sort by Attribute, Target, and Value fields.
- Click Copy Snippet to copy basic database servers info into the clipboard.
Parent topic: System Topology
5.3.1.4 Storage Servers
AHF 23.8
Starting in AHF 23.8, you will be able copy data in text format into the clipboard to post it into SR body while raising a service request.
How does AHF Insights UI render this information
Figure 5-7 Storage Servers
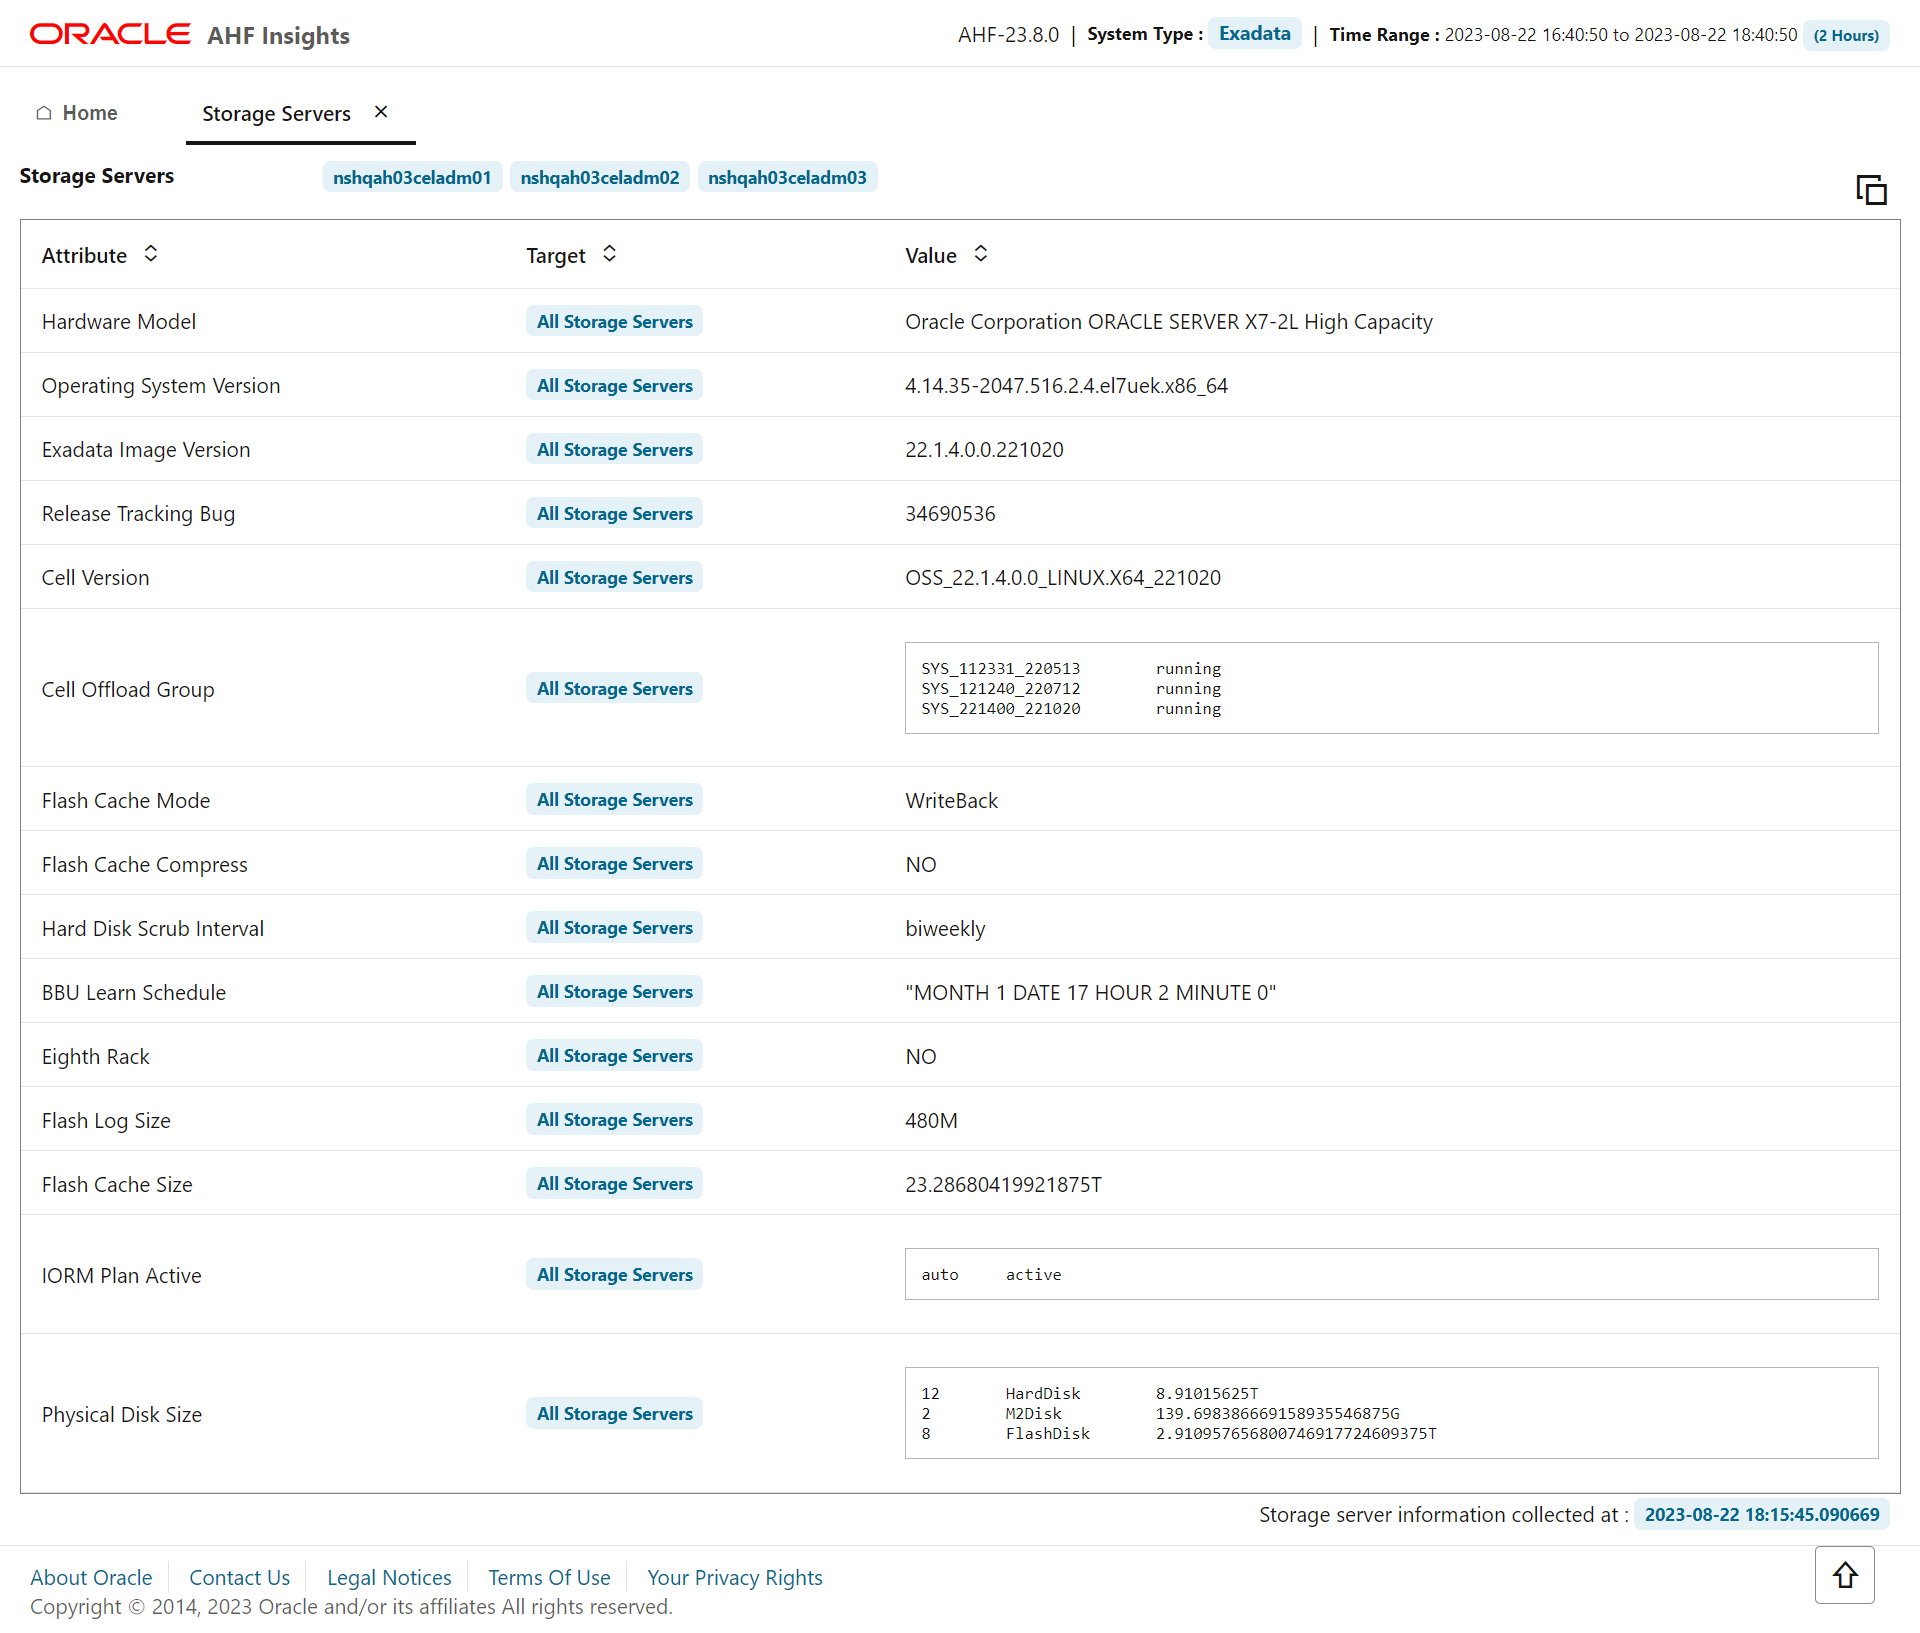
- Sort by Attribute, Target, and Value fields.
- Click Copy Snippet to copy basic storage servers info into the clipboard.
Parent topic: System Topology
5.3.1.5 Fabric Switches
AHF 23.8
Starting in AHF 23.8, you will be able copy data in text format into the clipboard to post it into SR body while raising a service request.
How does AHF Insights UI render this information
Figure 5-8 Fabric Switches
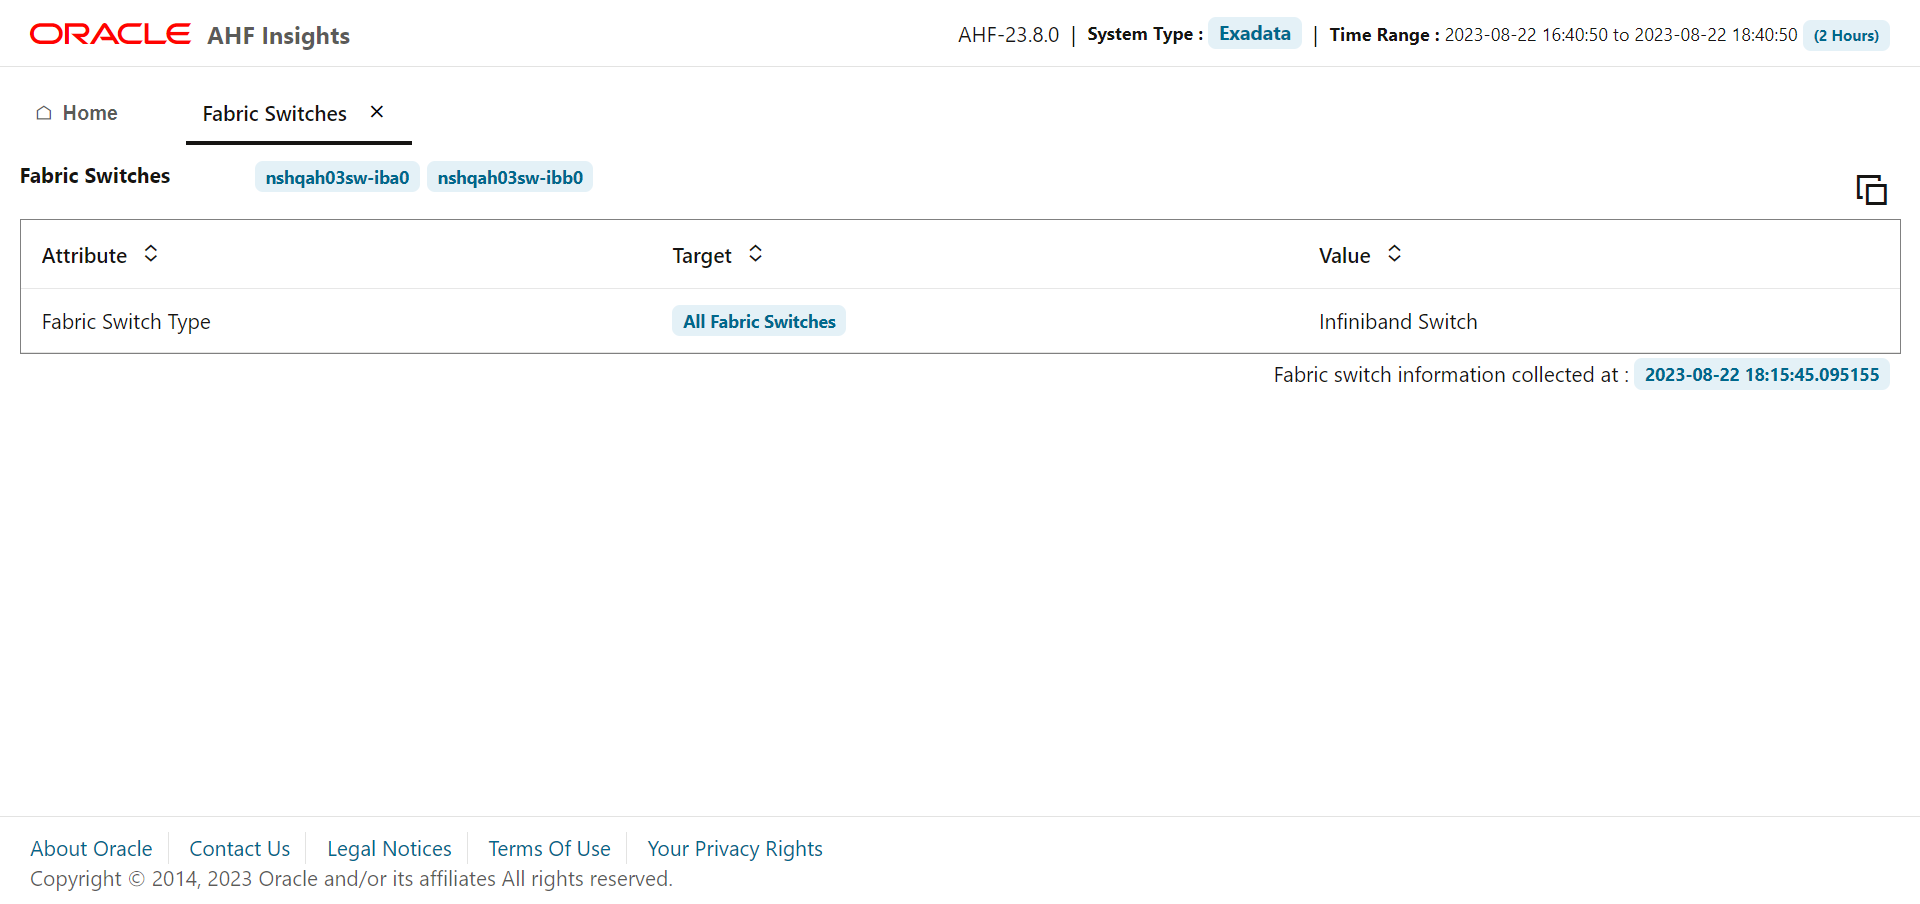
- Sort by Attribute, Target, and Value fields.
- Click Copy Snippet to copy basic fabric switches info into the clipboard.
Parent topic: System Topology
5.3.2 Insights
Note:
Database Server section will not be displayed in a non-Exadata environment.- Timeline
- Operating System Issues
- Best Practice Issues
- System Change
- Recommended Software
- Database Server
- RPM List
- Database Parameters
- Kernel Parameters
- Patch Information
- Space Analysis
- Database Anomalies Advisor
- Performance Reports
Parent topic: AHF Insights - Home
5.3.2.1 Timeline
AHF 24.10
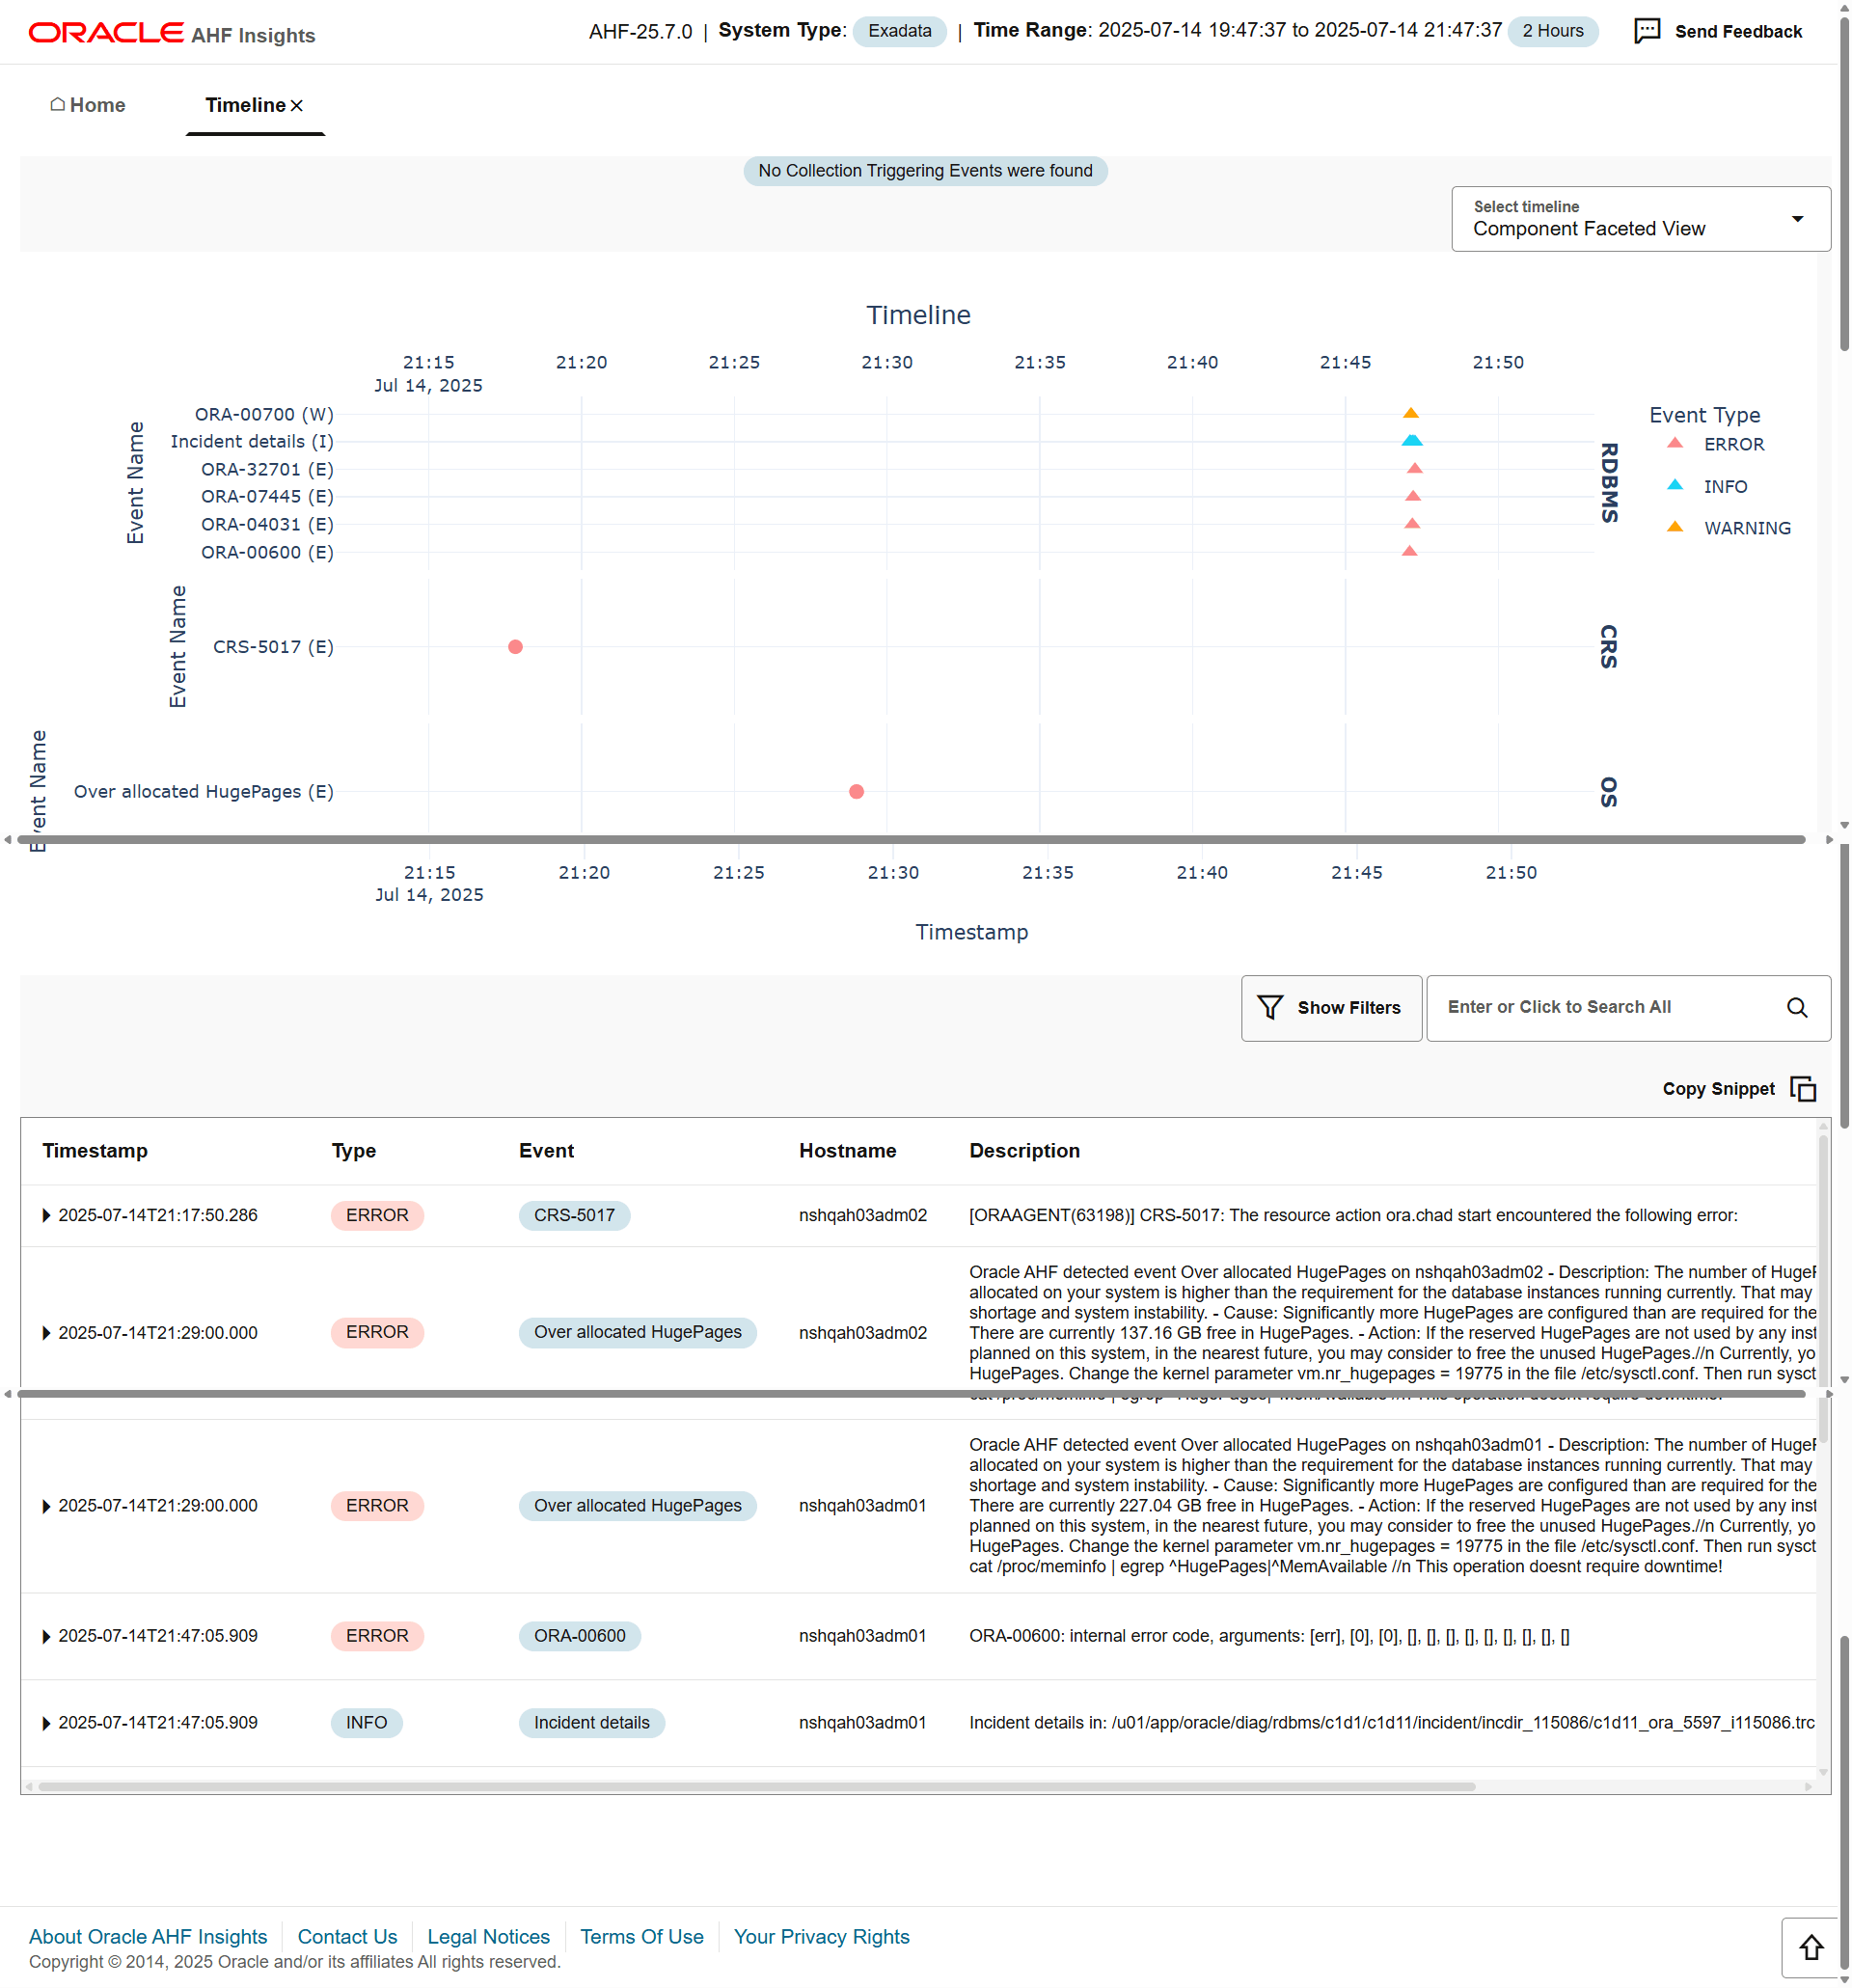
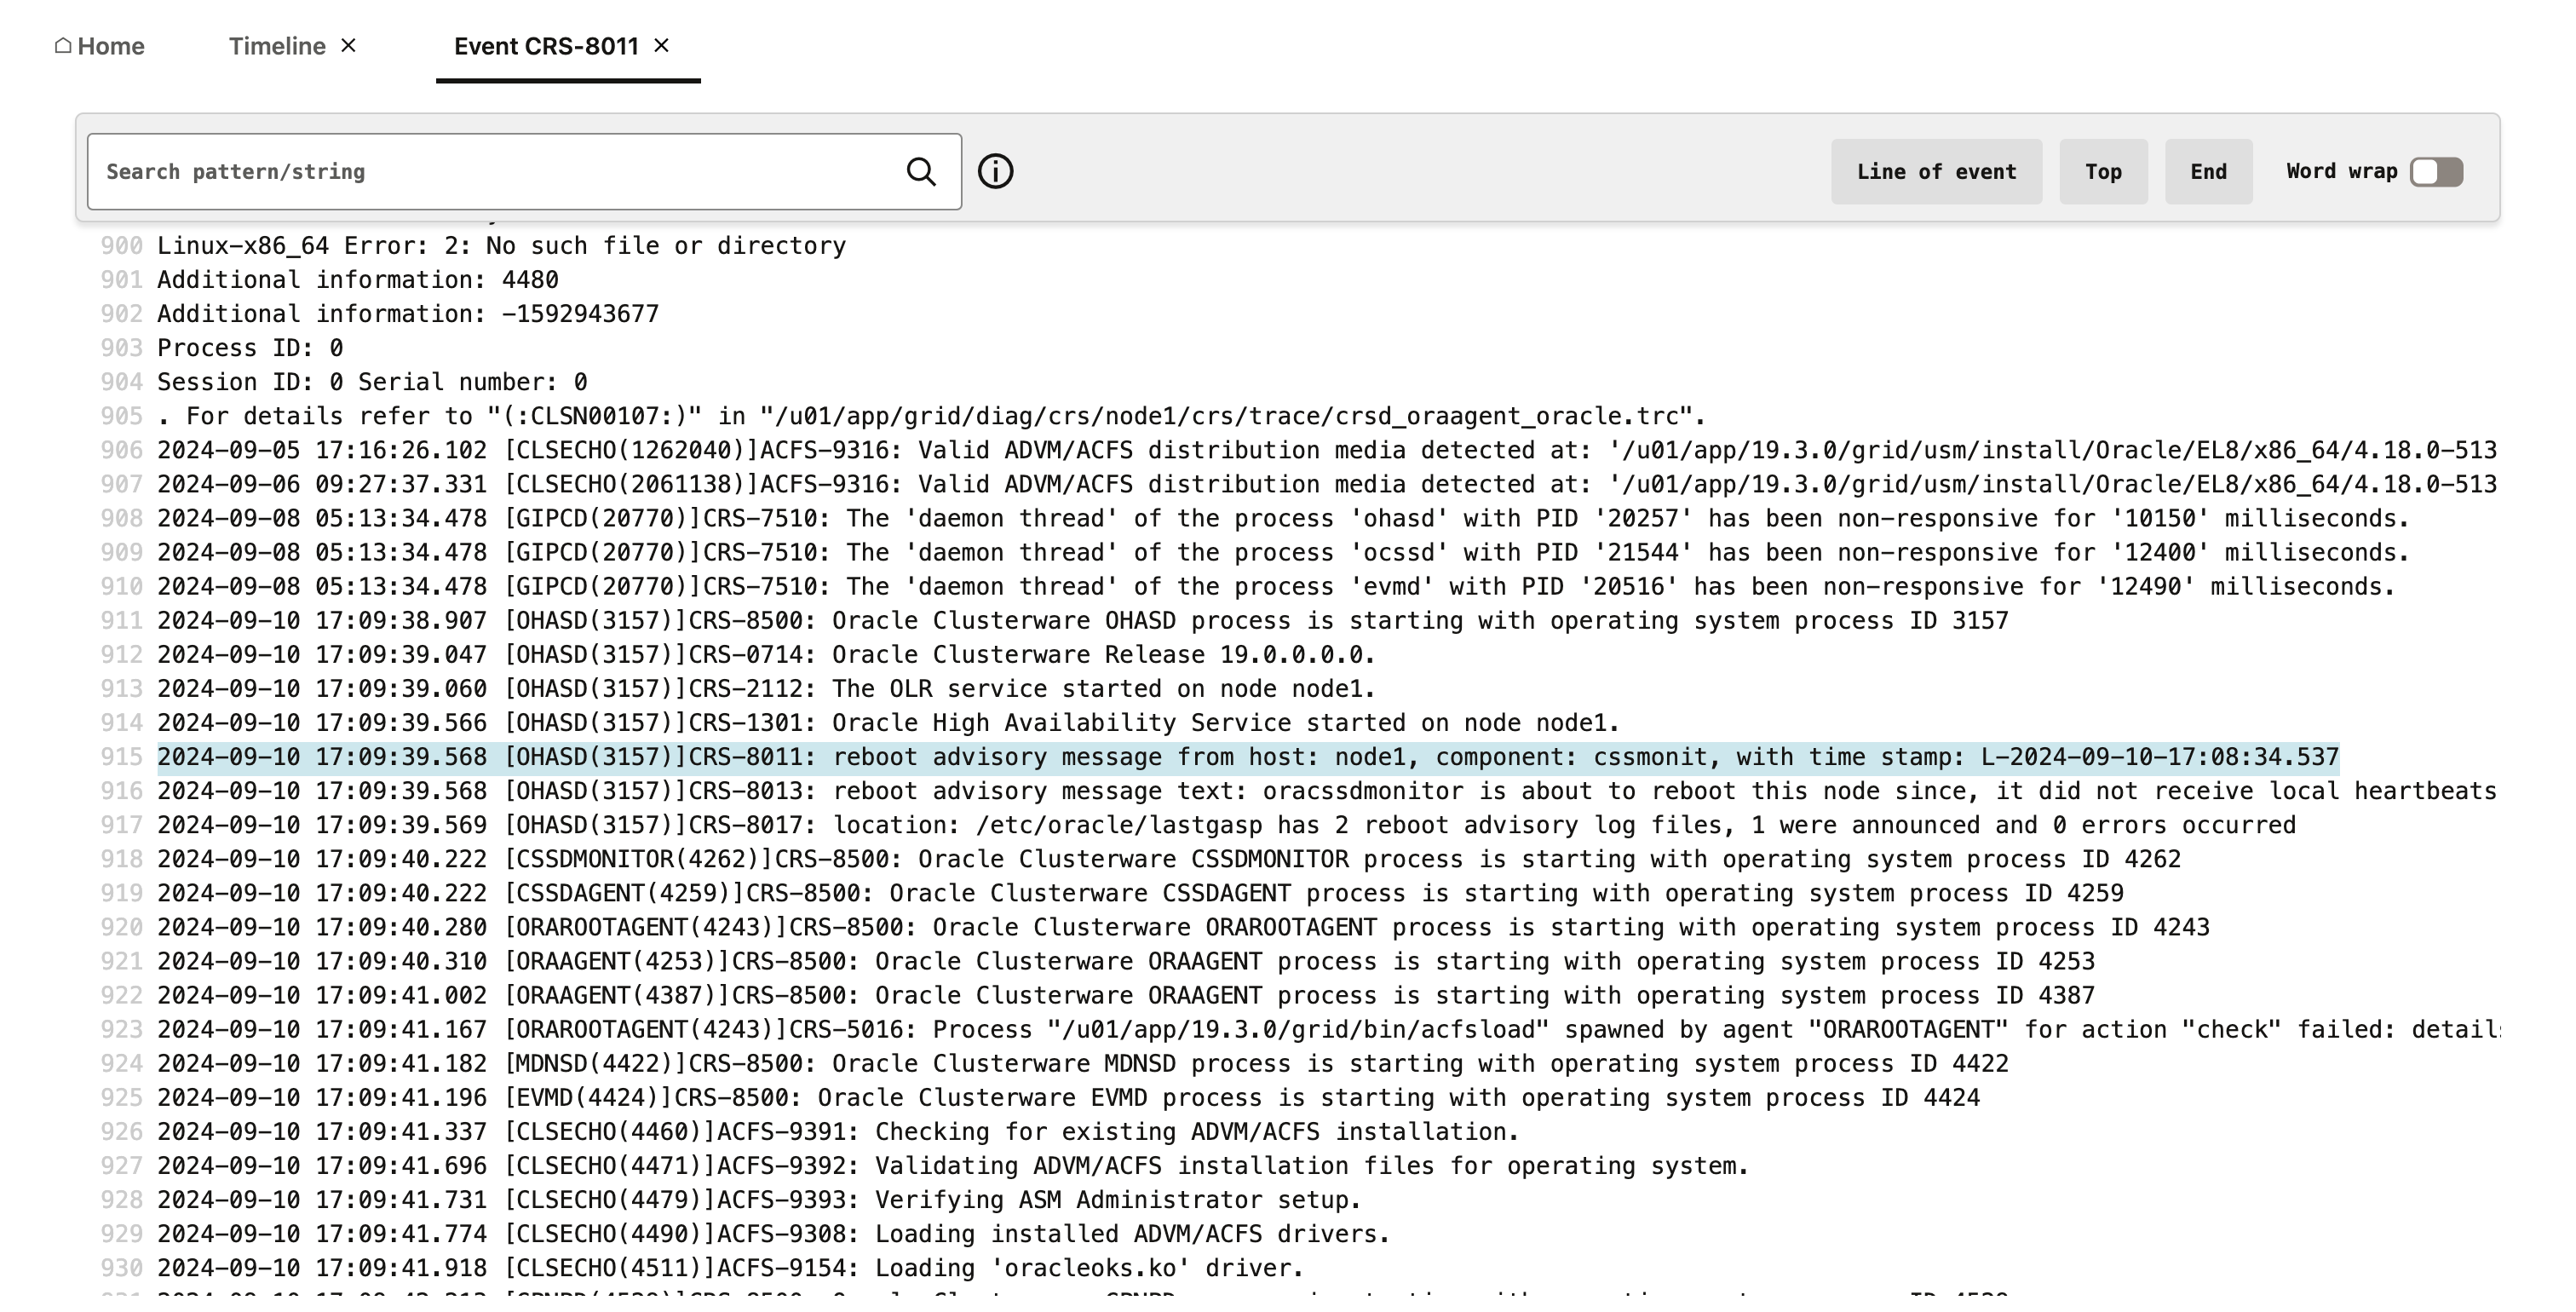
In this release clicking an event on the Insights timeline opens the corresponding log entry within a new file viewer.
The AHF Insights timeline displays all significant database-related events in context. For more detailed analysis, you can now browse the associated log file using the new File Viewer. Clicking any log event in the Timeline opens the corresponding file at the event location.
Figure 5-9 Timeline
Once opened the full contents of the log file can be browsed and easily searched.
Figure 5-10 Insights File Viewer
To use the Insights Timeline, open any AHF diagnostic collection, extract the Insights report, and select the Timeline section from the home screen.
How does AHF Insights UI render this information
Figure 5-11 Timeline - Host Faceted View
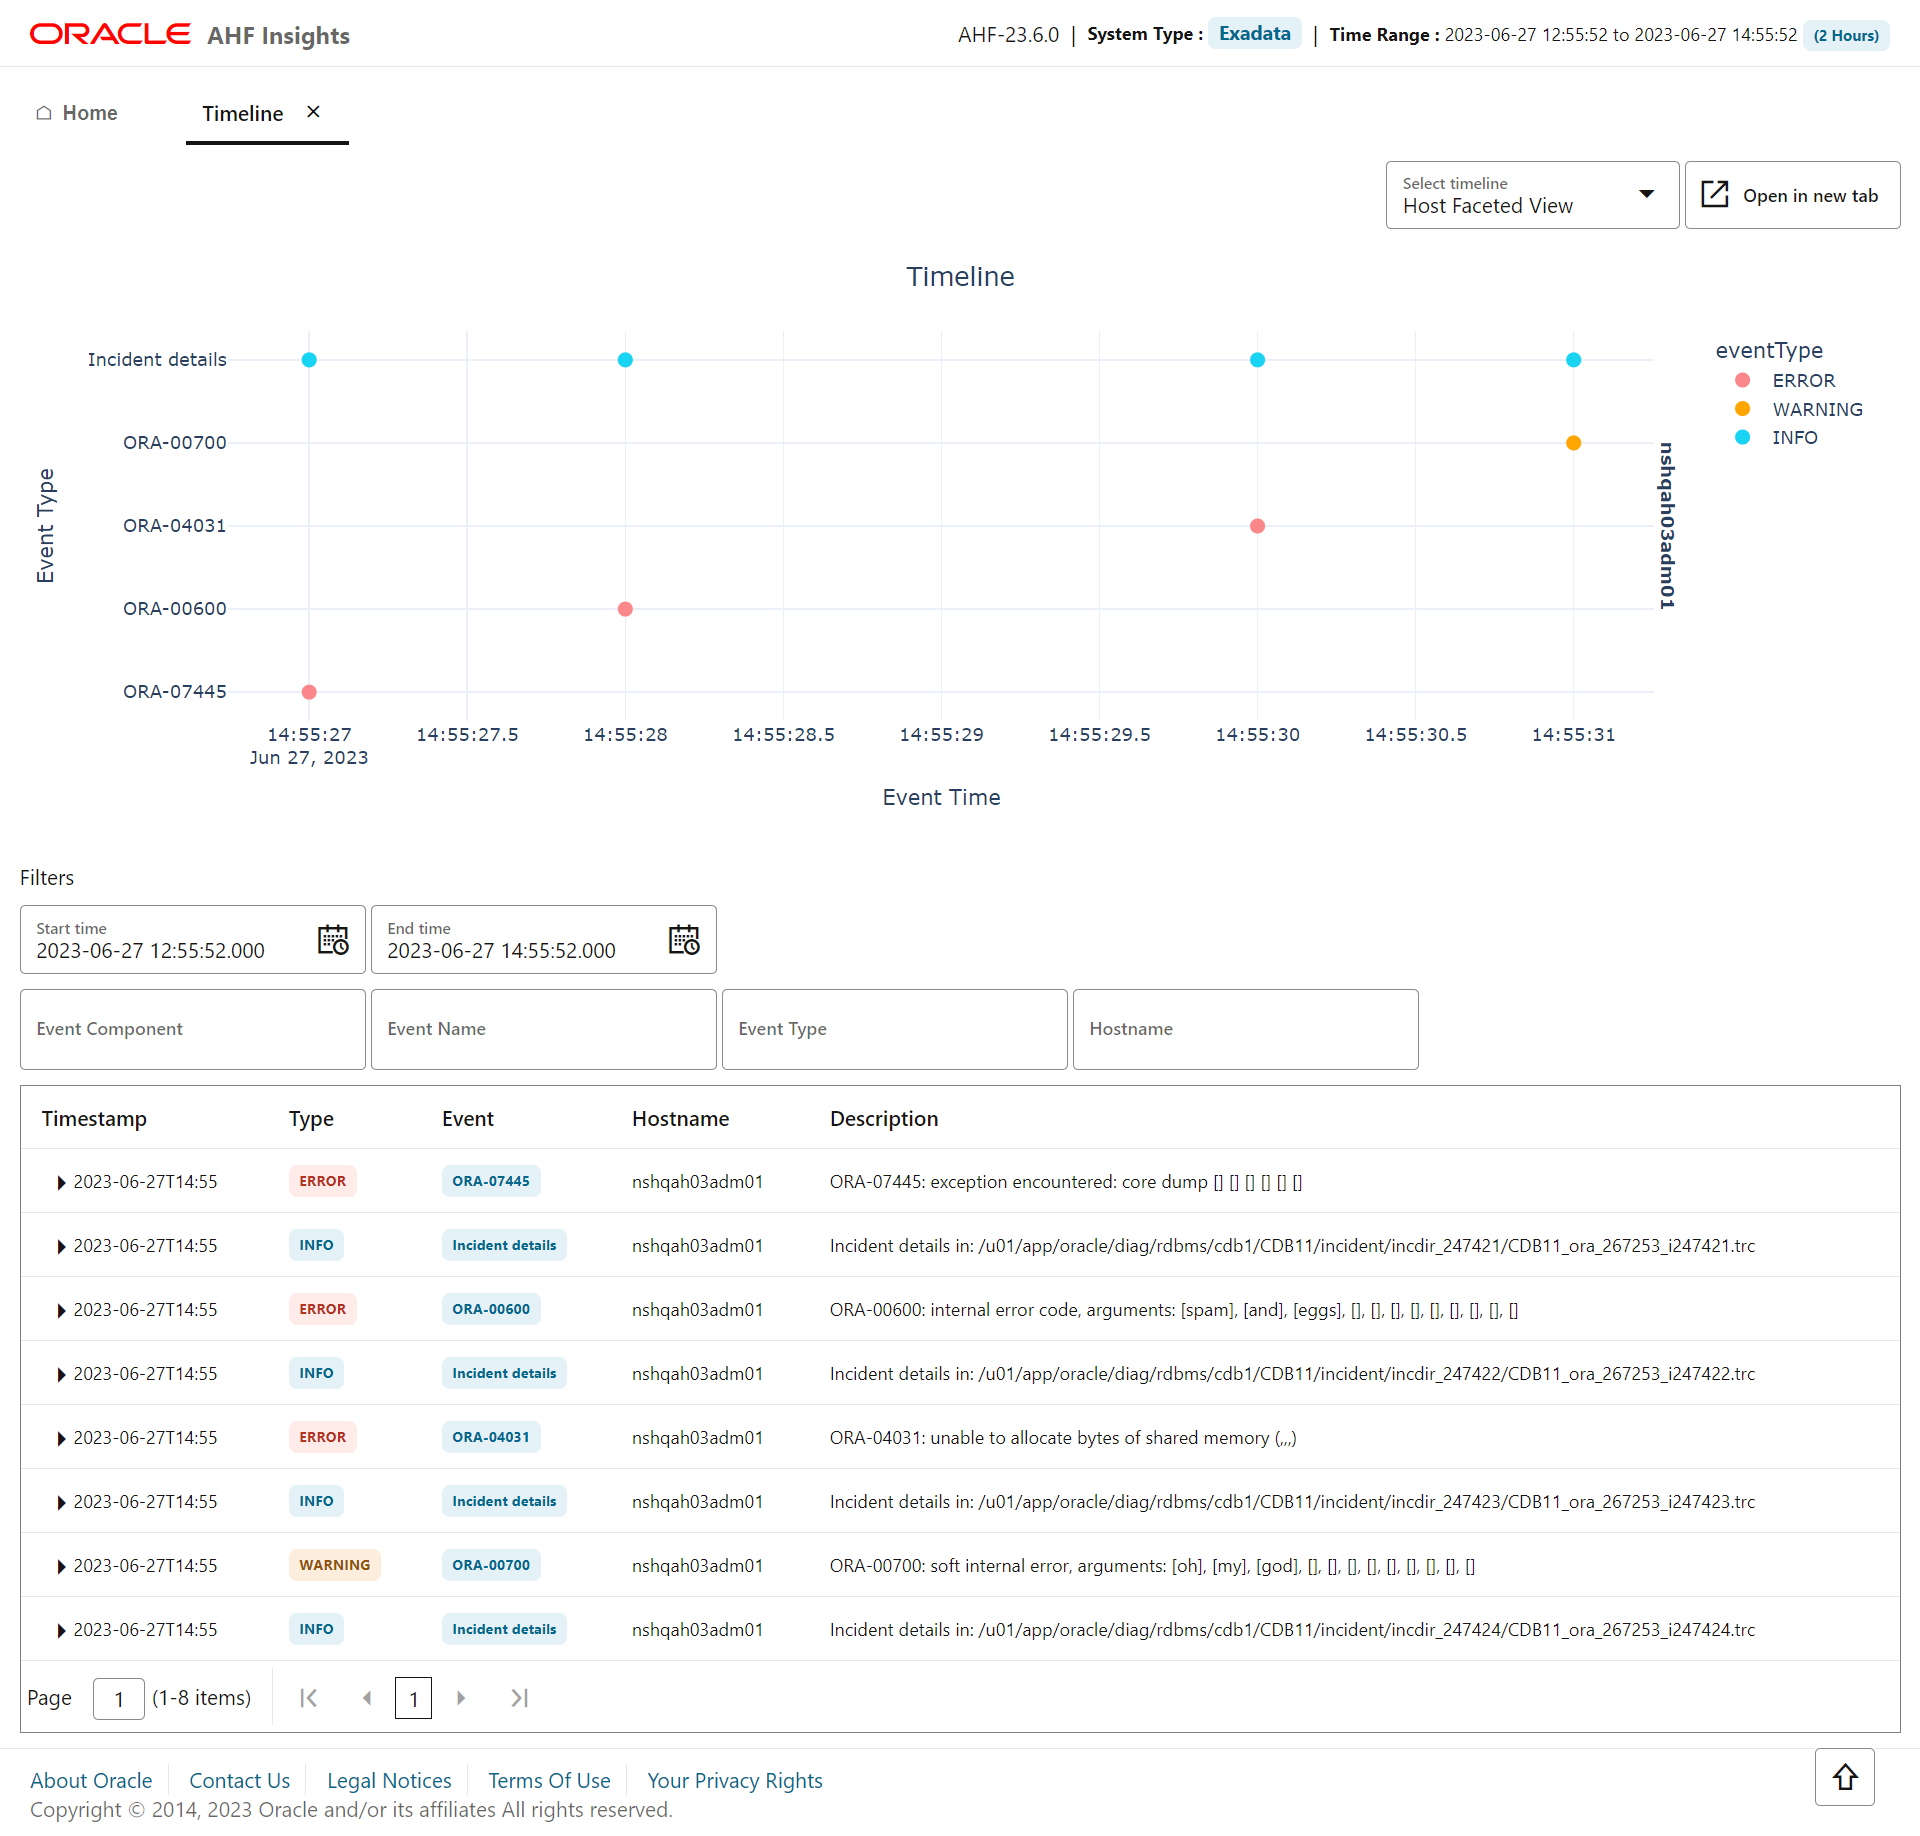
Figure 5-12 Timeline - Event Faceted View
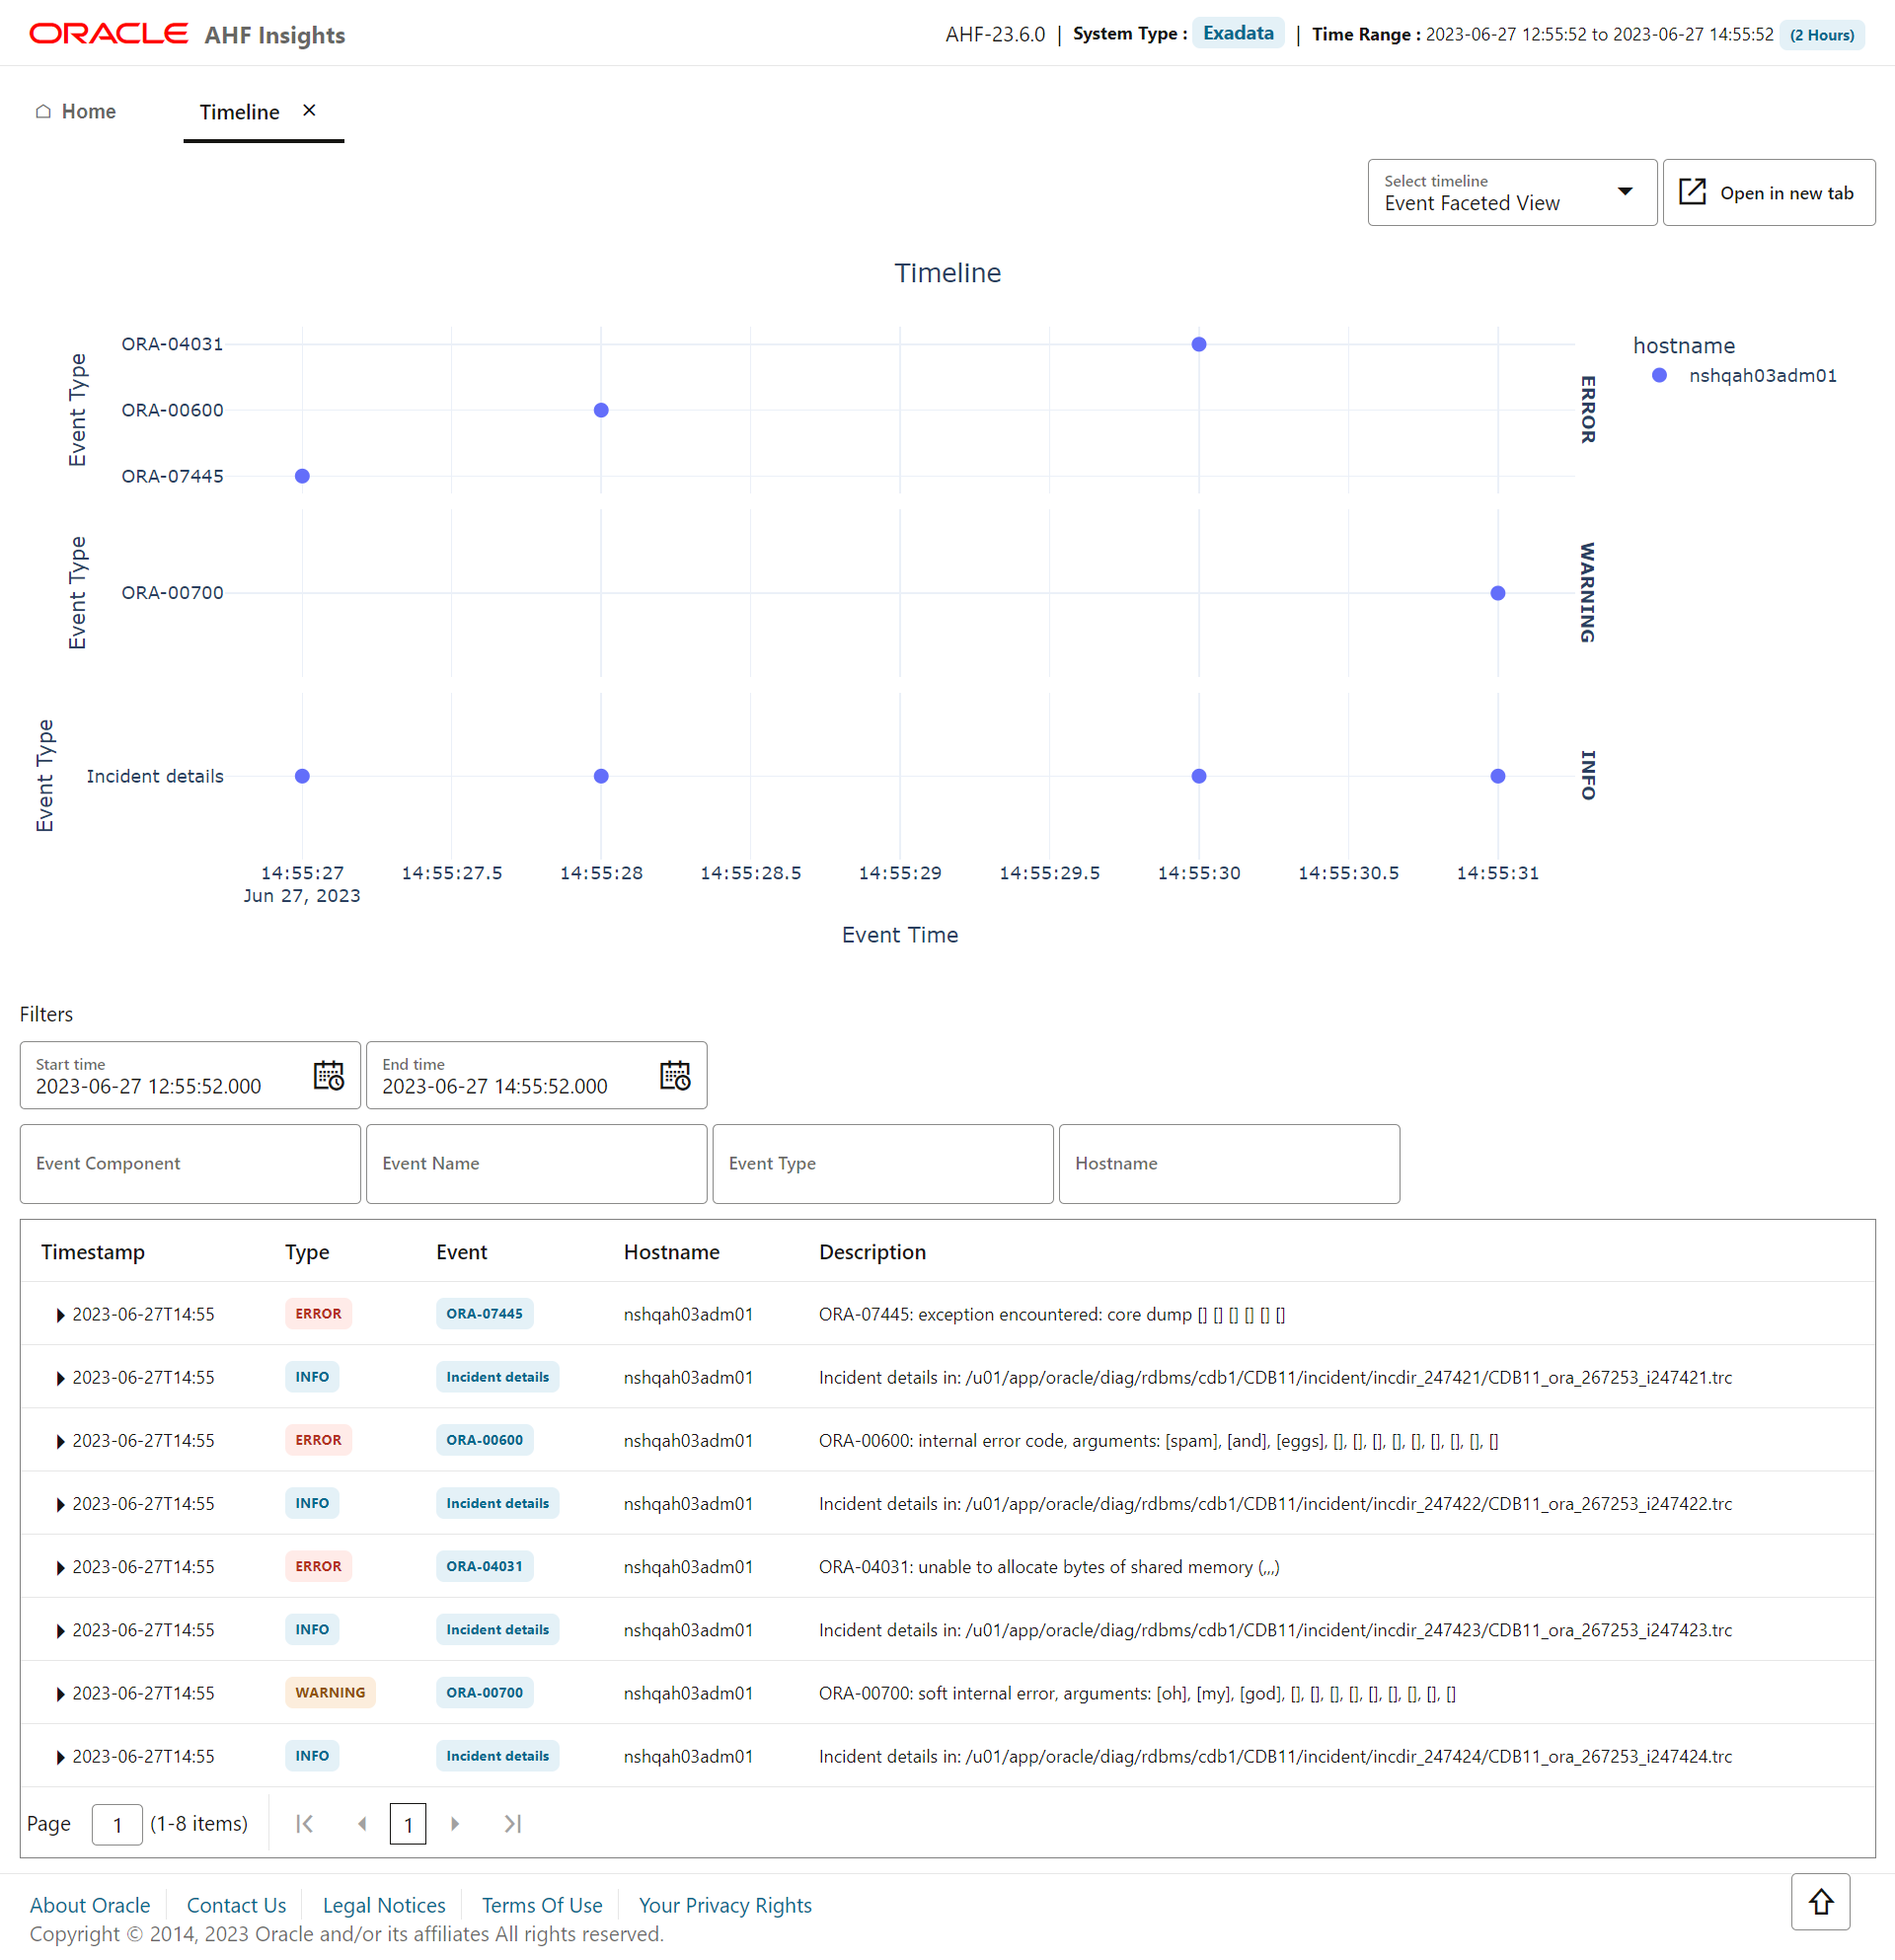
Figure 5-13 Timeline - Database Faceted View
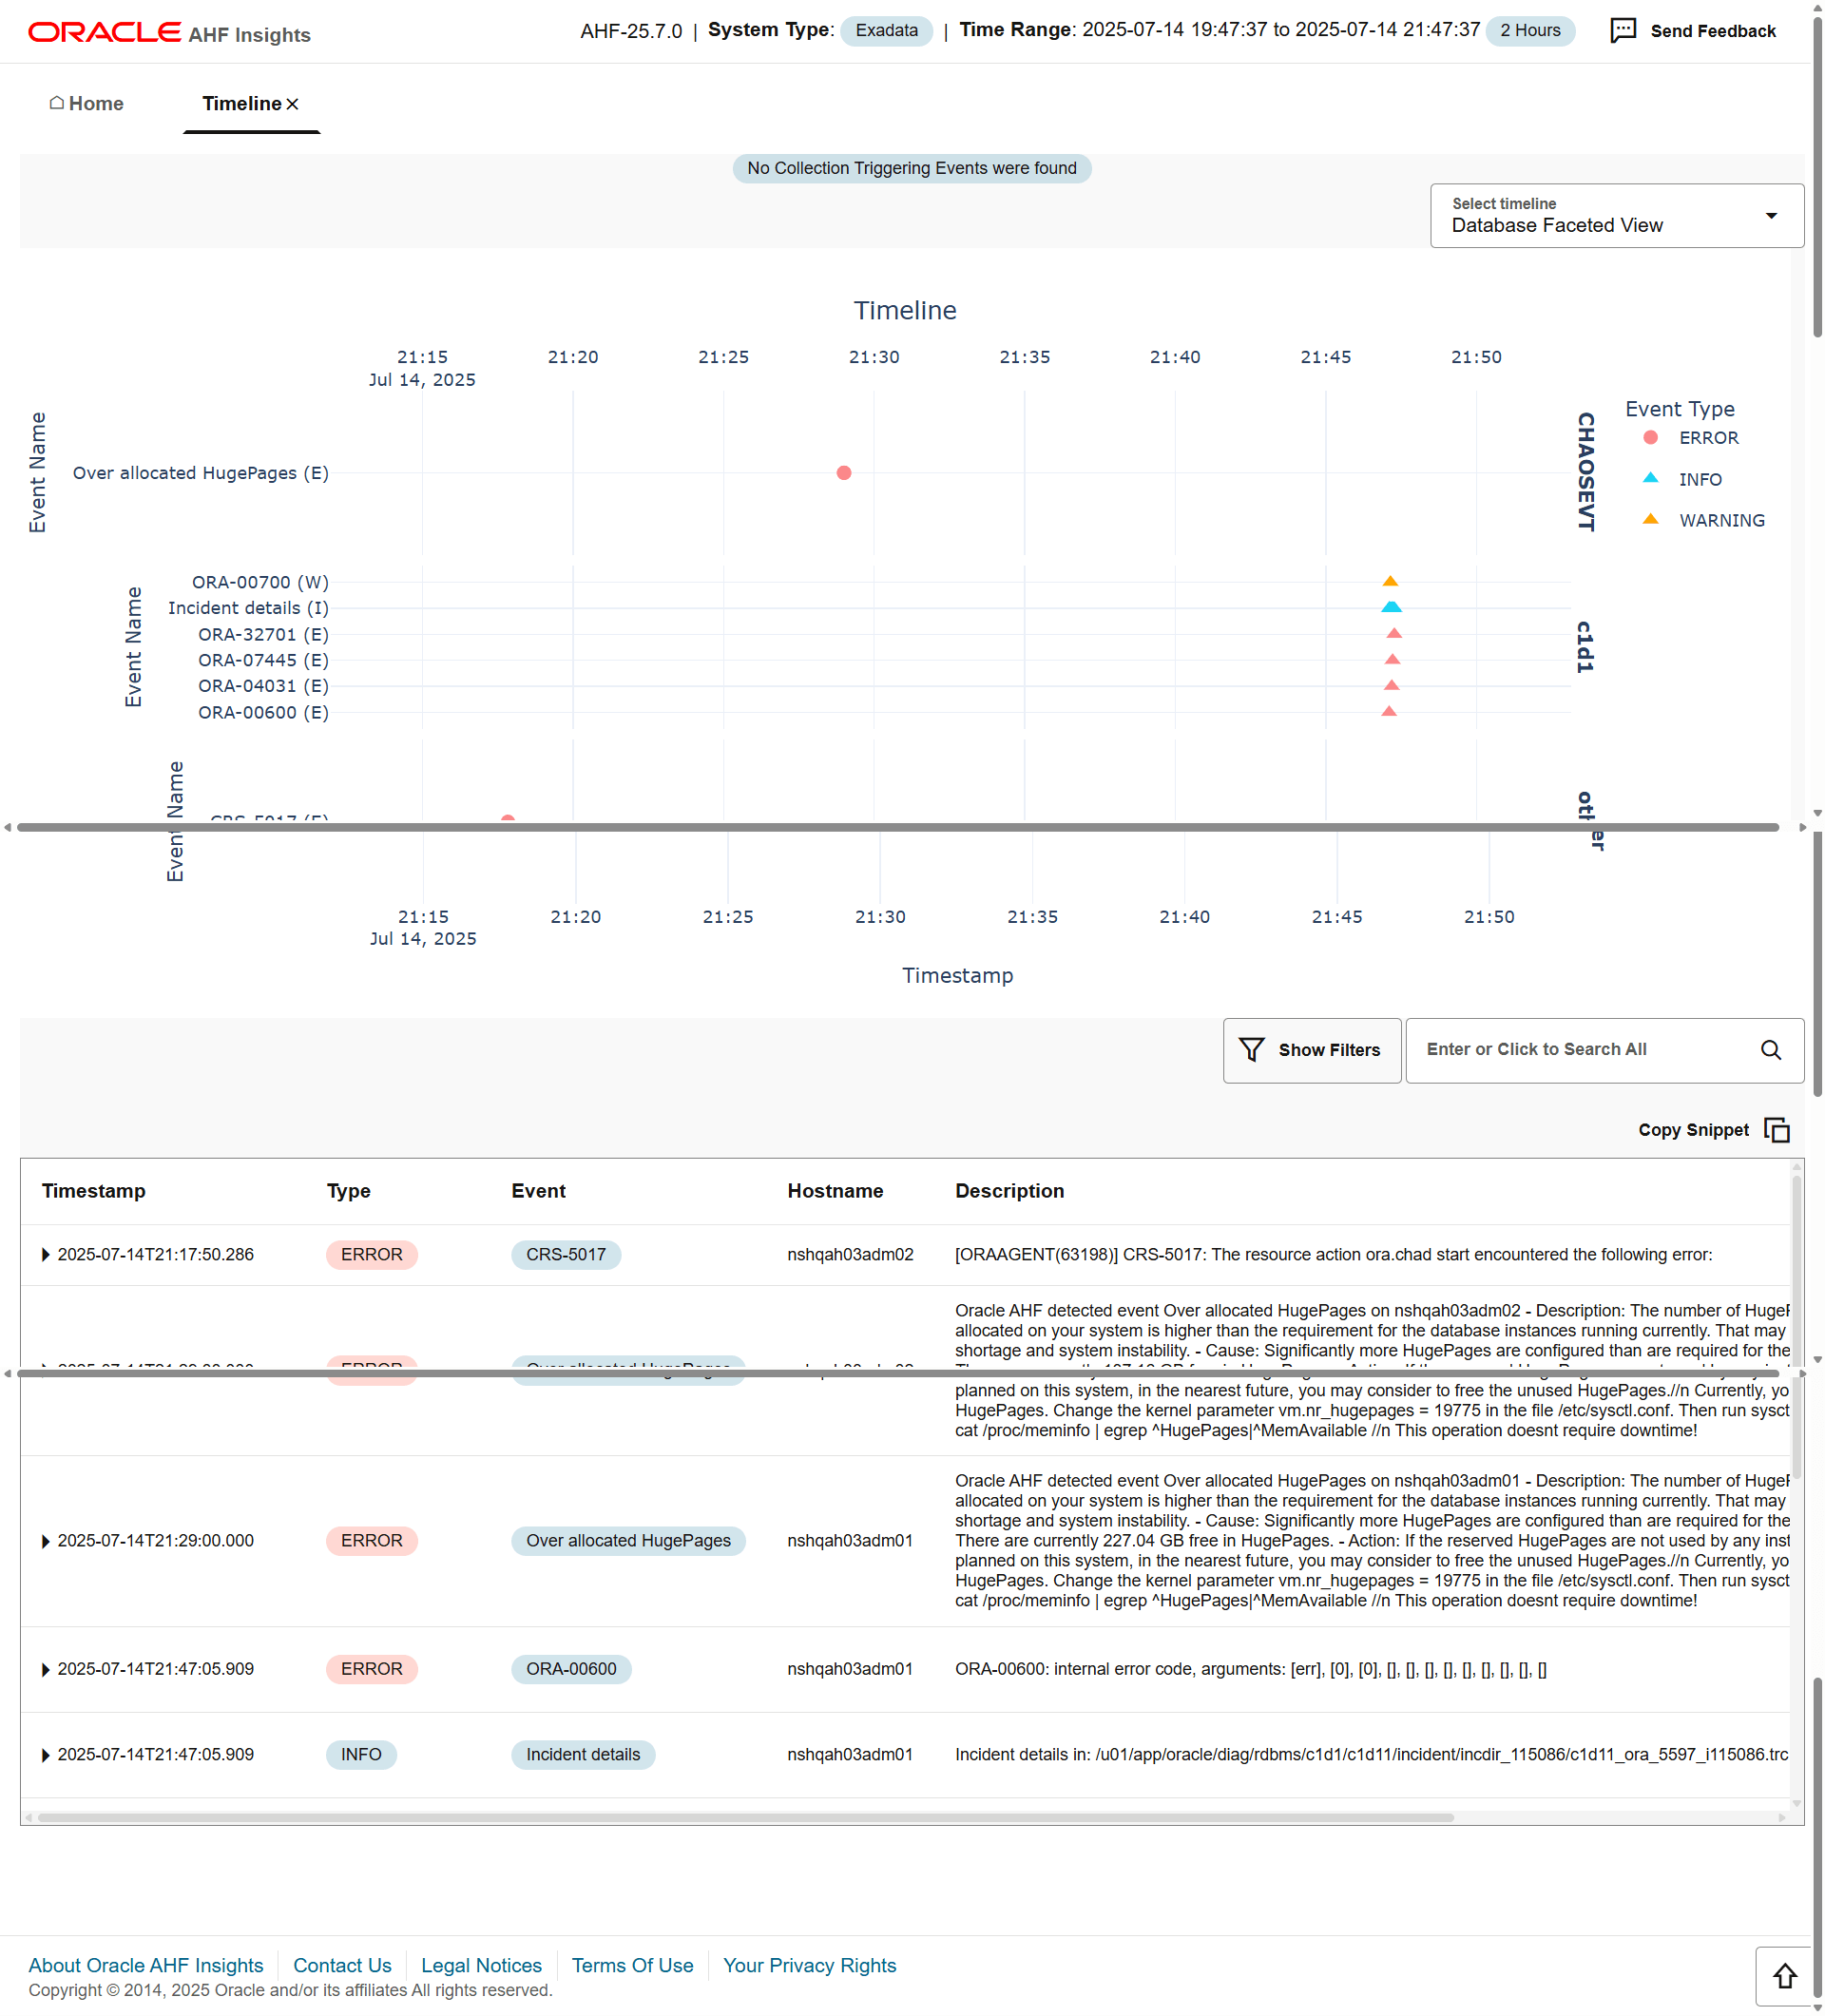
Provides Timeline visualization in a graph and provides a table with specific information about each timestamp.
- The Component Faceted View in the Select timeline filter of the main plot groups events by Oracle components, such as
RDBMS,CRS, andOS. - The Database Faceted View in the Select timeline filter of the main plot groups events by database.
- Click Copy Snippet to copy the event details to the clipboard.
- Click View in the Open in File Viewer column to open the associated log or trace file. The View button is enabled only when an event is linked to a log or trace file containing event details. The file viewer will open directly at the line where the event is recorded.
- The Triggering Events section is always displayed at the top. If the Insights report was generated by an automated collection (for example, SRDC), this section displays the event that triggered the creation of the Insights report.
- Search values using the filter section.
- Filter by a specific time range.
- Click the arrow located at the left side of a specific date to view detailed information regarding a specific timestamp.
- Hover over a specific data point in the graph to get detailed information about that specific point in time.
- Zoom into the timeline.
Parent topic: Insights
5.3.2.2 Operating System Issues
AHF 23.8
AHF 23.8 includes the following enhancements to the user interface to make it more intuitive and easier to use.
You can:
- Spot the disks that have anomalies. In the Operating System Issues tab, under Local IO, click Disk to view Disk Metrics. Disks that have anomalies are marked with an X mark.
- Explore process aggregate from operating system
details in a more intuitive way.
- Demarcated process aggregates per the instance group like Databases, ASM, APX (Apex), IOS, Clusterware, and so on.
- Legends specific to individual category rather than single legend for all categories.
AHF 23.10
AHF 23.10 includes the following enhancements to the user interface to make it more intuitive.
You will now be able to view the data in problematic time ranges in plots with more data points.
- 5 seconds for ranges less than 1 minute
- 30 seconds for ranges more than 1 minute
The number of data points for plots under Operating System Issues section are dynamic for optimal time taken to generate report.
- 1 minute for intervals up to 4 hours
- 3 minutes for intervals greater than 4 hours and less than 12 hours
- 5 minutes for intervals greater than 12 hours.
AHF 23.11
Starting in AHF 23.11, you will be able to view data coming from Exawatcher.
You can explore data coming from cell nodes in a visual format. You can switch between cell nodes, tagged as (S), and compute nodes, tagged as (D) from a dropdown. You will be able to examine Flash Disks, Flash Disk Aggregates, and Hard Disk Aggregates metrics.
How does AHF Insights UI render this information
Figure 5-14 Operating System Issues - Configuration
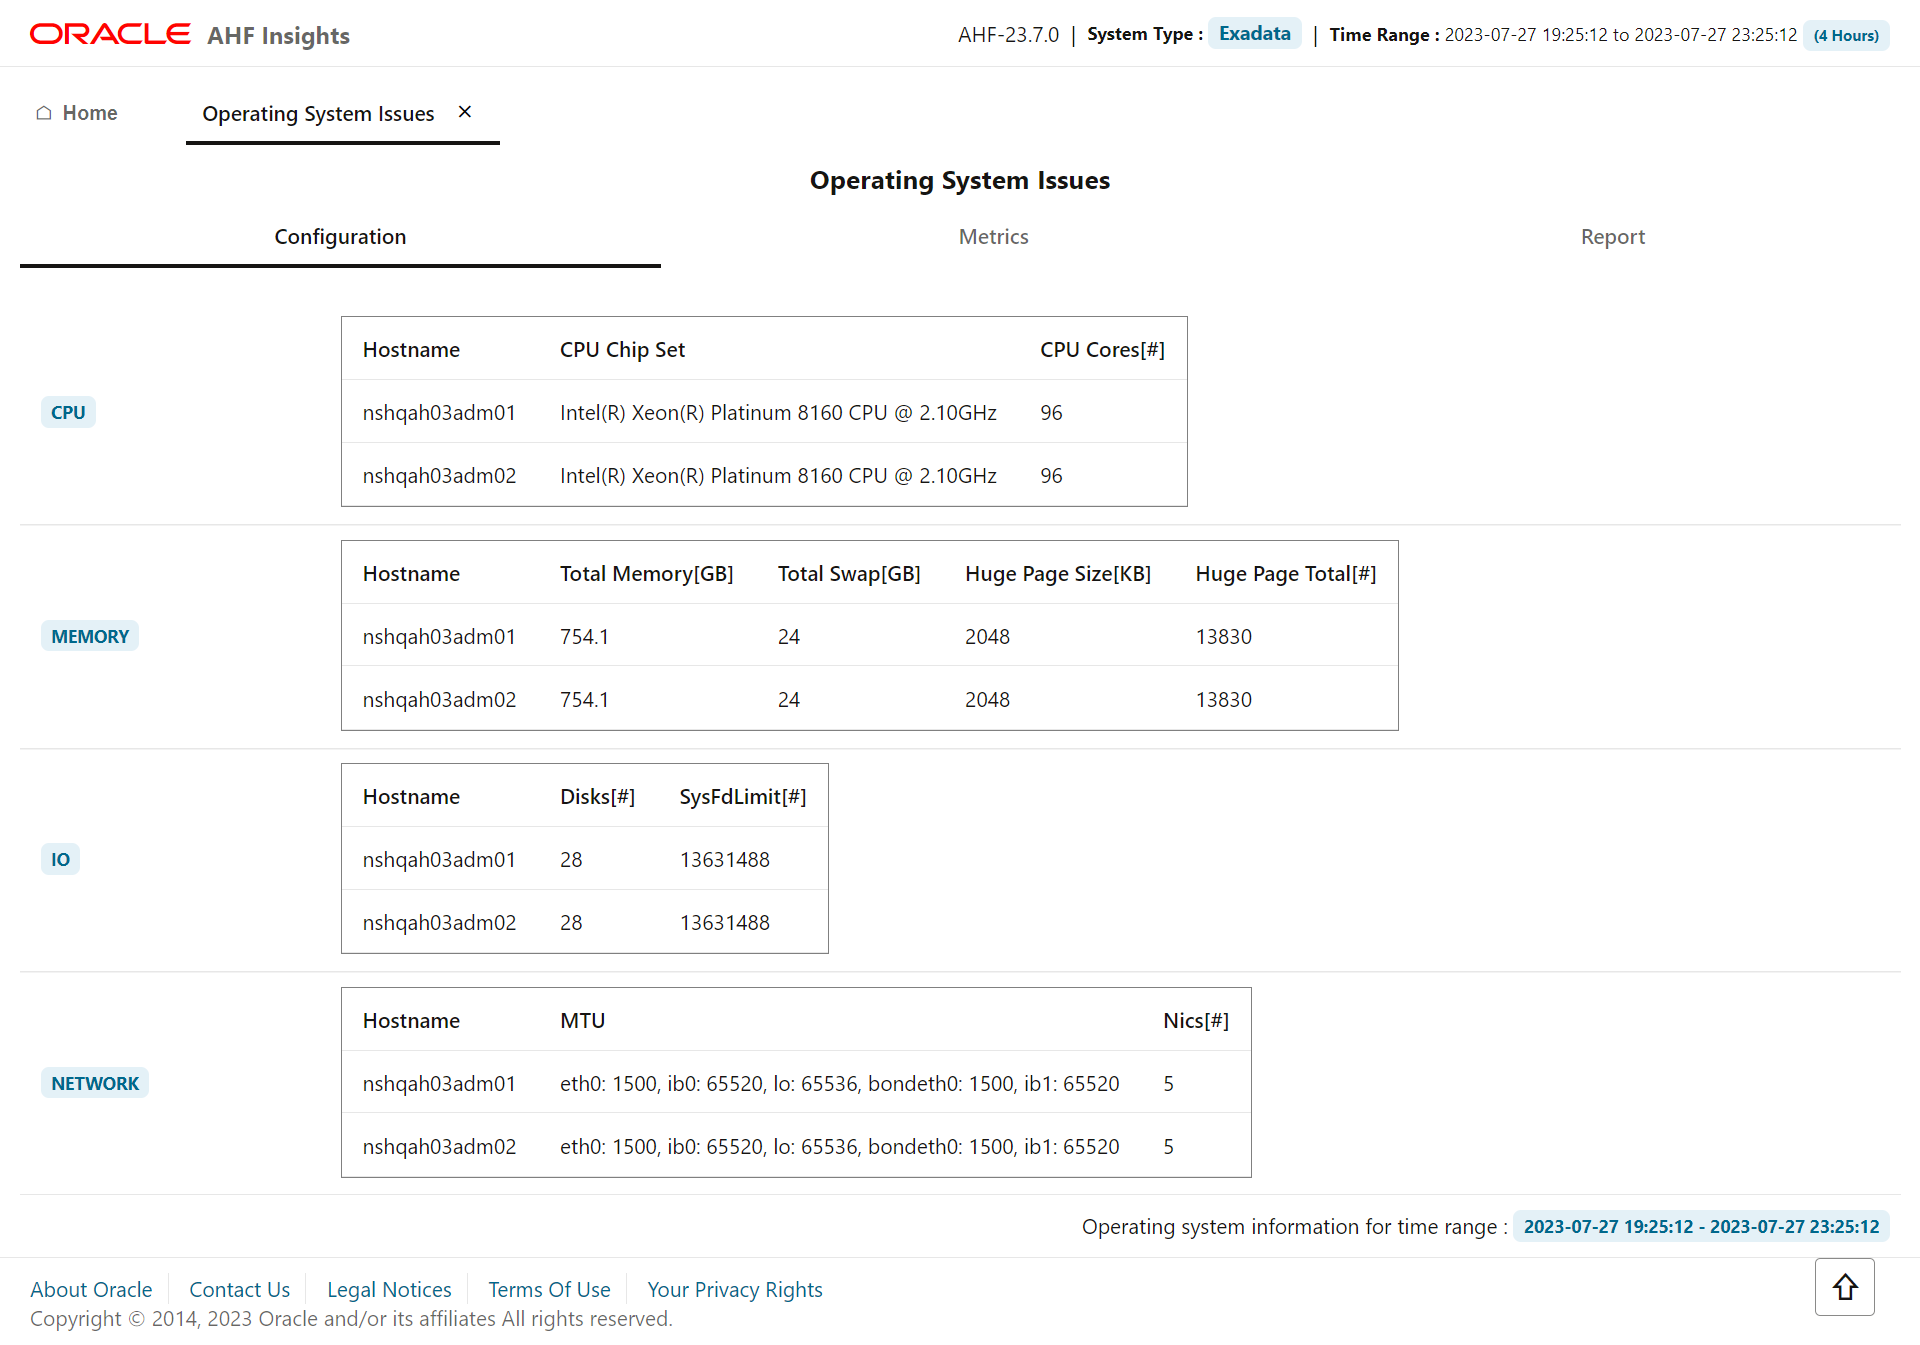
Figure 5-15 Operating System Issues - Metrics
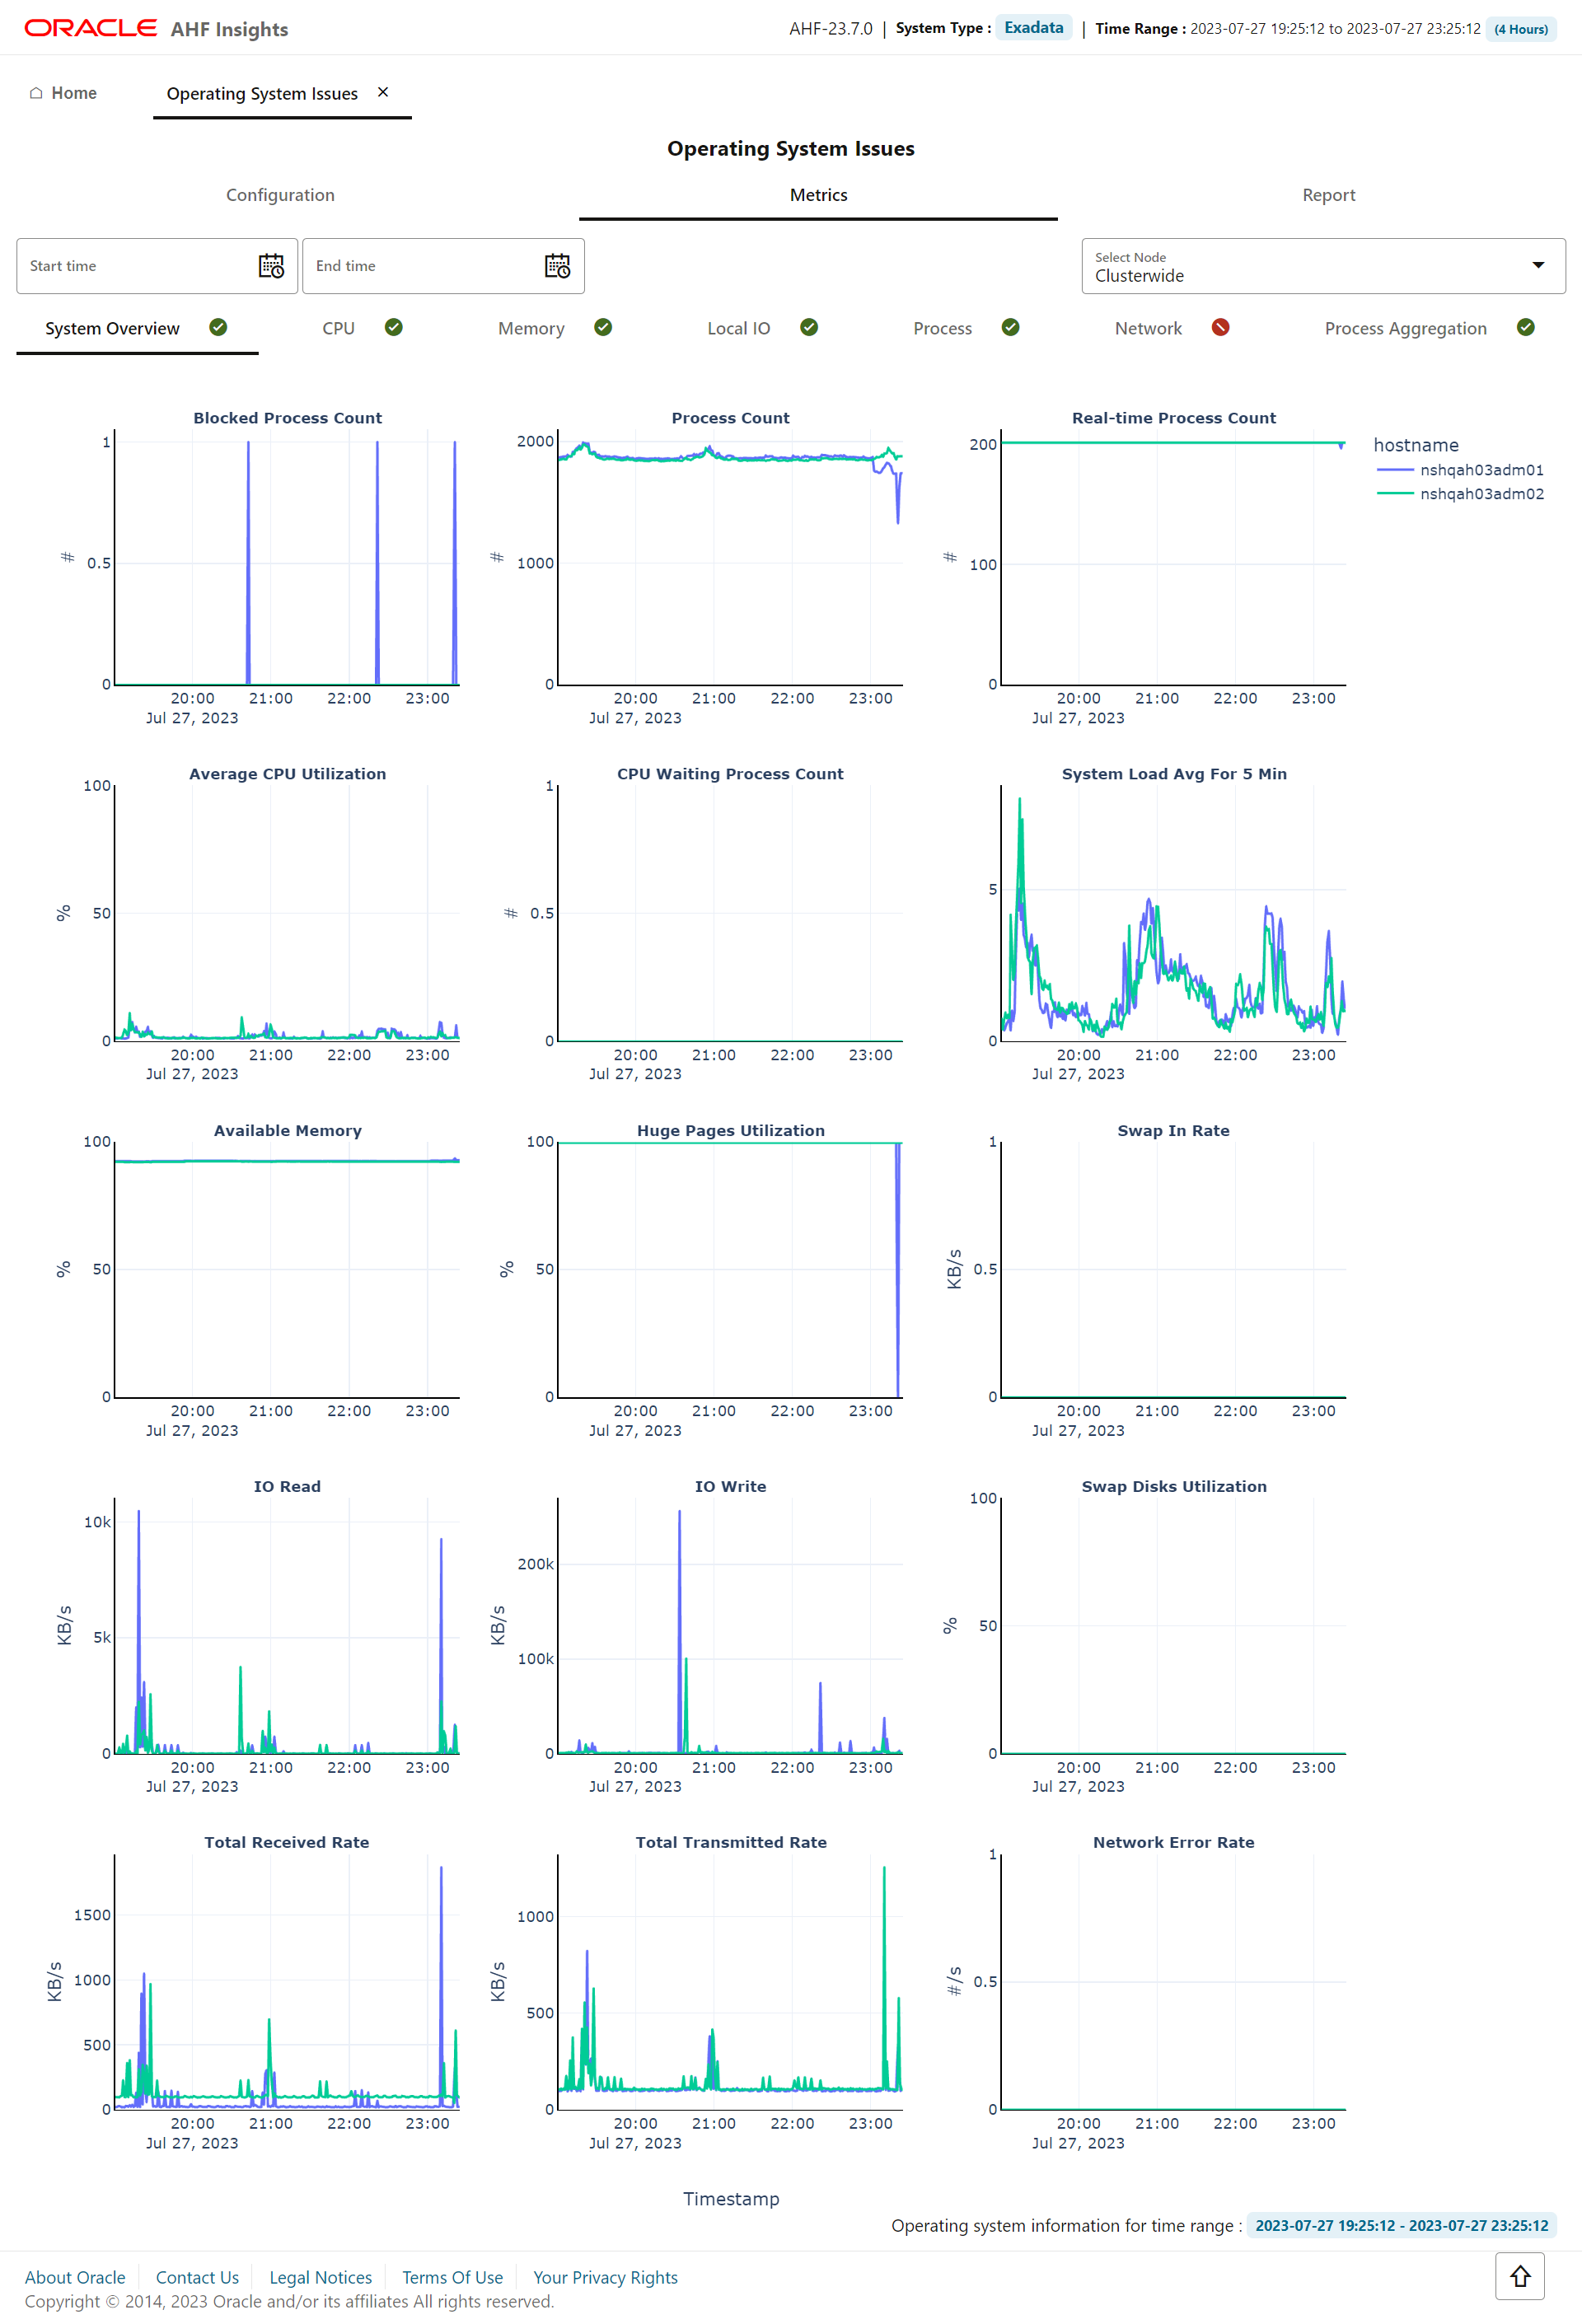
Figure 5-16 Operating System Issues - Report
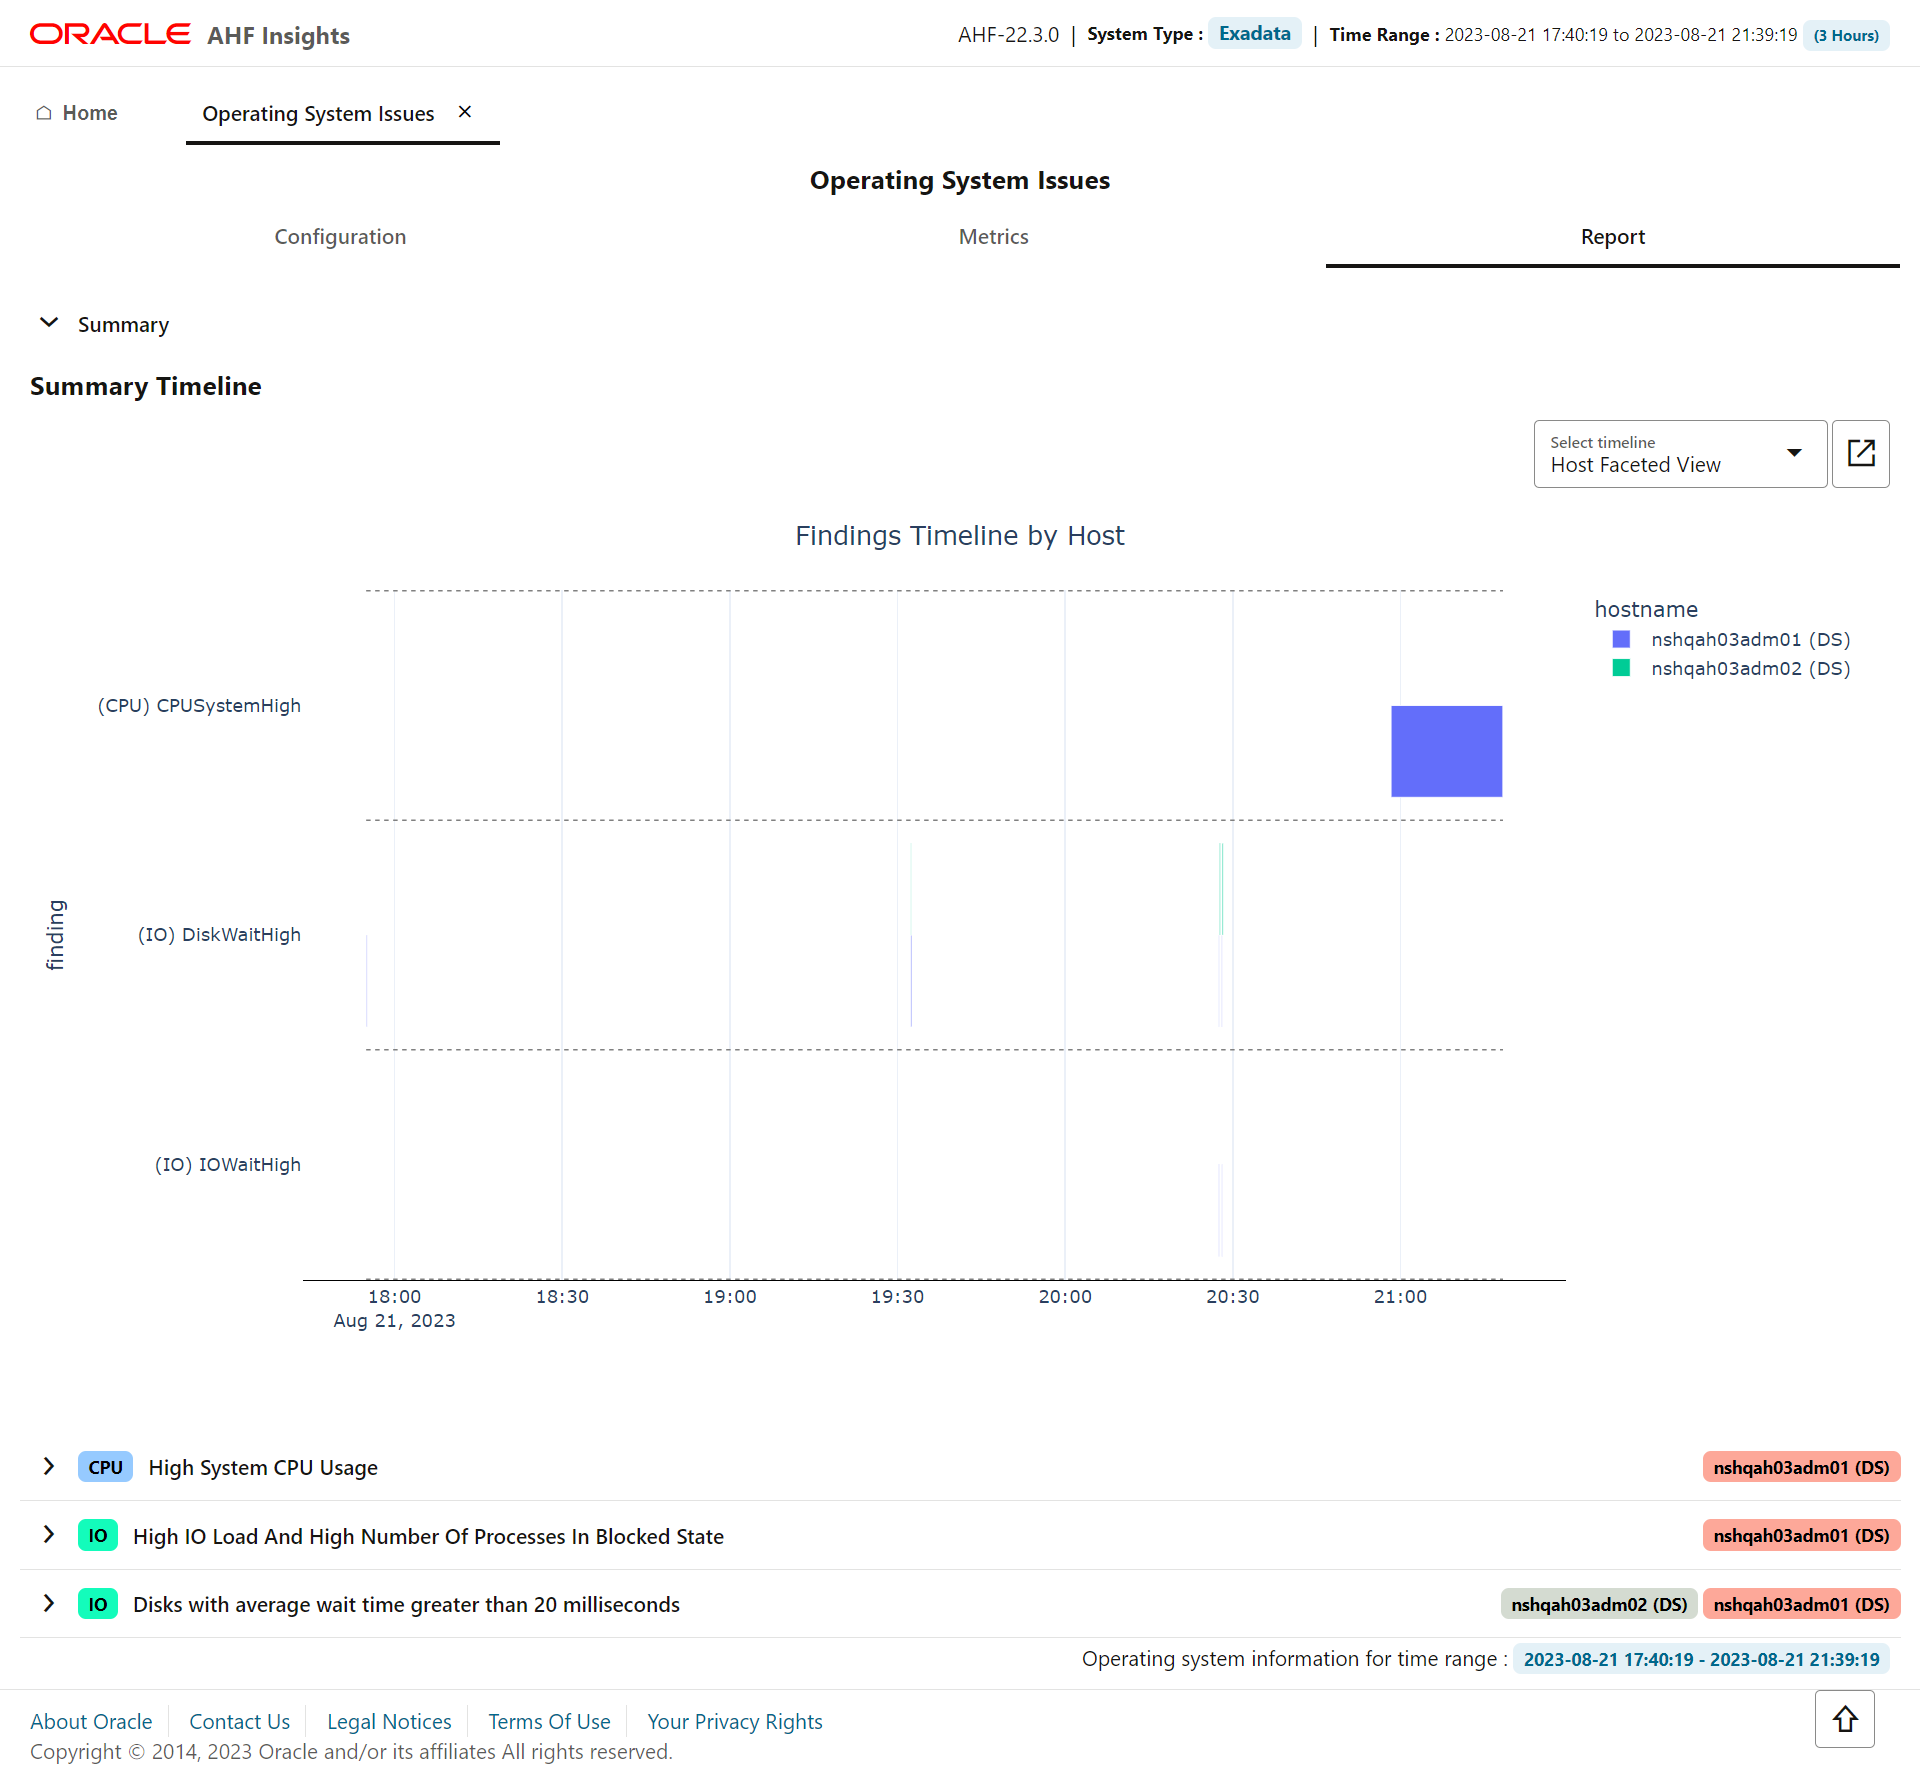
Provides details about the metrics collected on the system and a detailed report on operating system anomalies. This page presents three views, Configuration, Metrics, and Report.
Metrics view has tabs displaying CPU, Memory, System I/O, Process, Network interface, Process aggregation metrics, and green and red icons indicating the statuses. From the drop-down list at the upper-right corner, select a node for which you want to view the metrics. Select a time range from the calendar widget to view metrics for that period.
Report view includes Summary Timeline and Observed Findings.
Configuration
This tab showcases CPU, Memory, IO, and Network configuration details of the systems from where operating system metrics were collected.
Metrics
System Overview
This tab showcases overview of resources such as CPU, memory, processes, and I/O operation.
- Hover over a specific point in time of the graph to get detailed information.
- Zoom into the timeline.
CPU Metrics
This tab showcases CPU metrics.
- Hover over a specific point in time of the graph to get detailed information.
- Zoom into the timeline.
Memory Metrics
This tab showcases memory metrics.
- Hover over a specific point in time of the graph to get detailed information.
- Zoom into the timeline.
Local I/O Metrics
This tab show case System IO metrics.
- Hover over a specific point in time of the graph to get detailed information.
- Zoom into the timeline.
Process Metrics
This tab showcases process metrics.
- Hover over a specific point in time of the graph to get detailed information.
- Zoom into the timeline.
Network Metrics
This tab showcases network interface metrics.
- Select different metrics related to network like interface, IP, UDP, and TCP.
- Hover over a specific point in time of the graph to get detailed information.
- Zoom into the timeline.
Process Aggregation Metrics
This tab showcases aggregation of process metrics.
- Select a node from the Select Node drop-down list to view node-specific process aggregation metrics.
- Hover over a specific point in time of the graph to get detailed information.
- Zoom into the timeline.
Report
With Report view, explore the findings in a drop-down fashion with a full widescreen view.
- view the Event information in a subplot within the Summary Timeline Gantt Chart
- explore the top ranked metrics in tables under a problem finding in a visual format
- view the metrics associated with the problem finding in a visual format
- drill down into the detailed state of the system at a specific problematic point in time under 'Problematic Snapshots' section. Problem specific system snapshots are organized into drop-downs ordered by problem timestamp
Parent topic: Insights
5.3.2.3 Best Practice Issues
AHF 23.8
Starting in AHF 23.8, AHF compliance checks from Oracle Orachk and Oracle Exachk are integrated into AHF Insights Best Practice Issues section.
AHF has thousands of Best Practice Compliance Checks, which are run automatically by AHF Oracle Orachk and Oracle Exachk. The results of these checks are viewable in HTML reports and output in JSON and XML for consumption into other tools. In addition, all Best Practice Compliance Checks are fully integrated into AHF Insights for running on-demand.
AHF Insights makes it easy to quickly see the Health Score, understand where systems are out of compliance and then take the necessary corrective action.
- Explore the best practice data in a visual format.
- Filter best practices across different status through visualization and Status status drop-down.
- Search checks from all sections of best practice report.
- View the best practice report in a vertical fashion.
- See the health score with a visual distribution of checks that have failed.
ahf analysis create --type insightsHow does AHF Insights UI render this information
Figure 5-17 Best Practice Issues
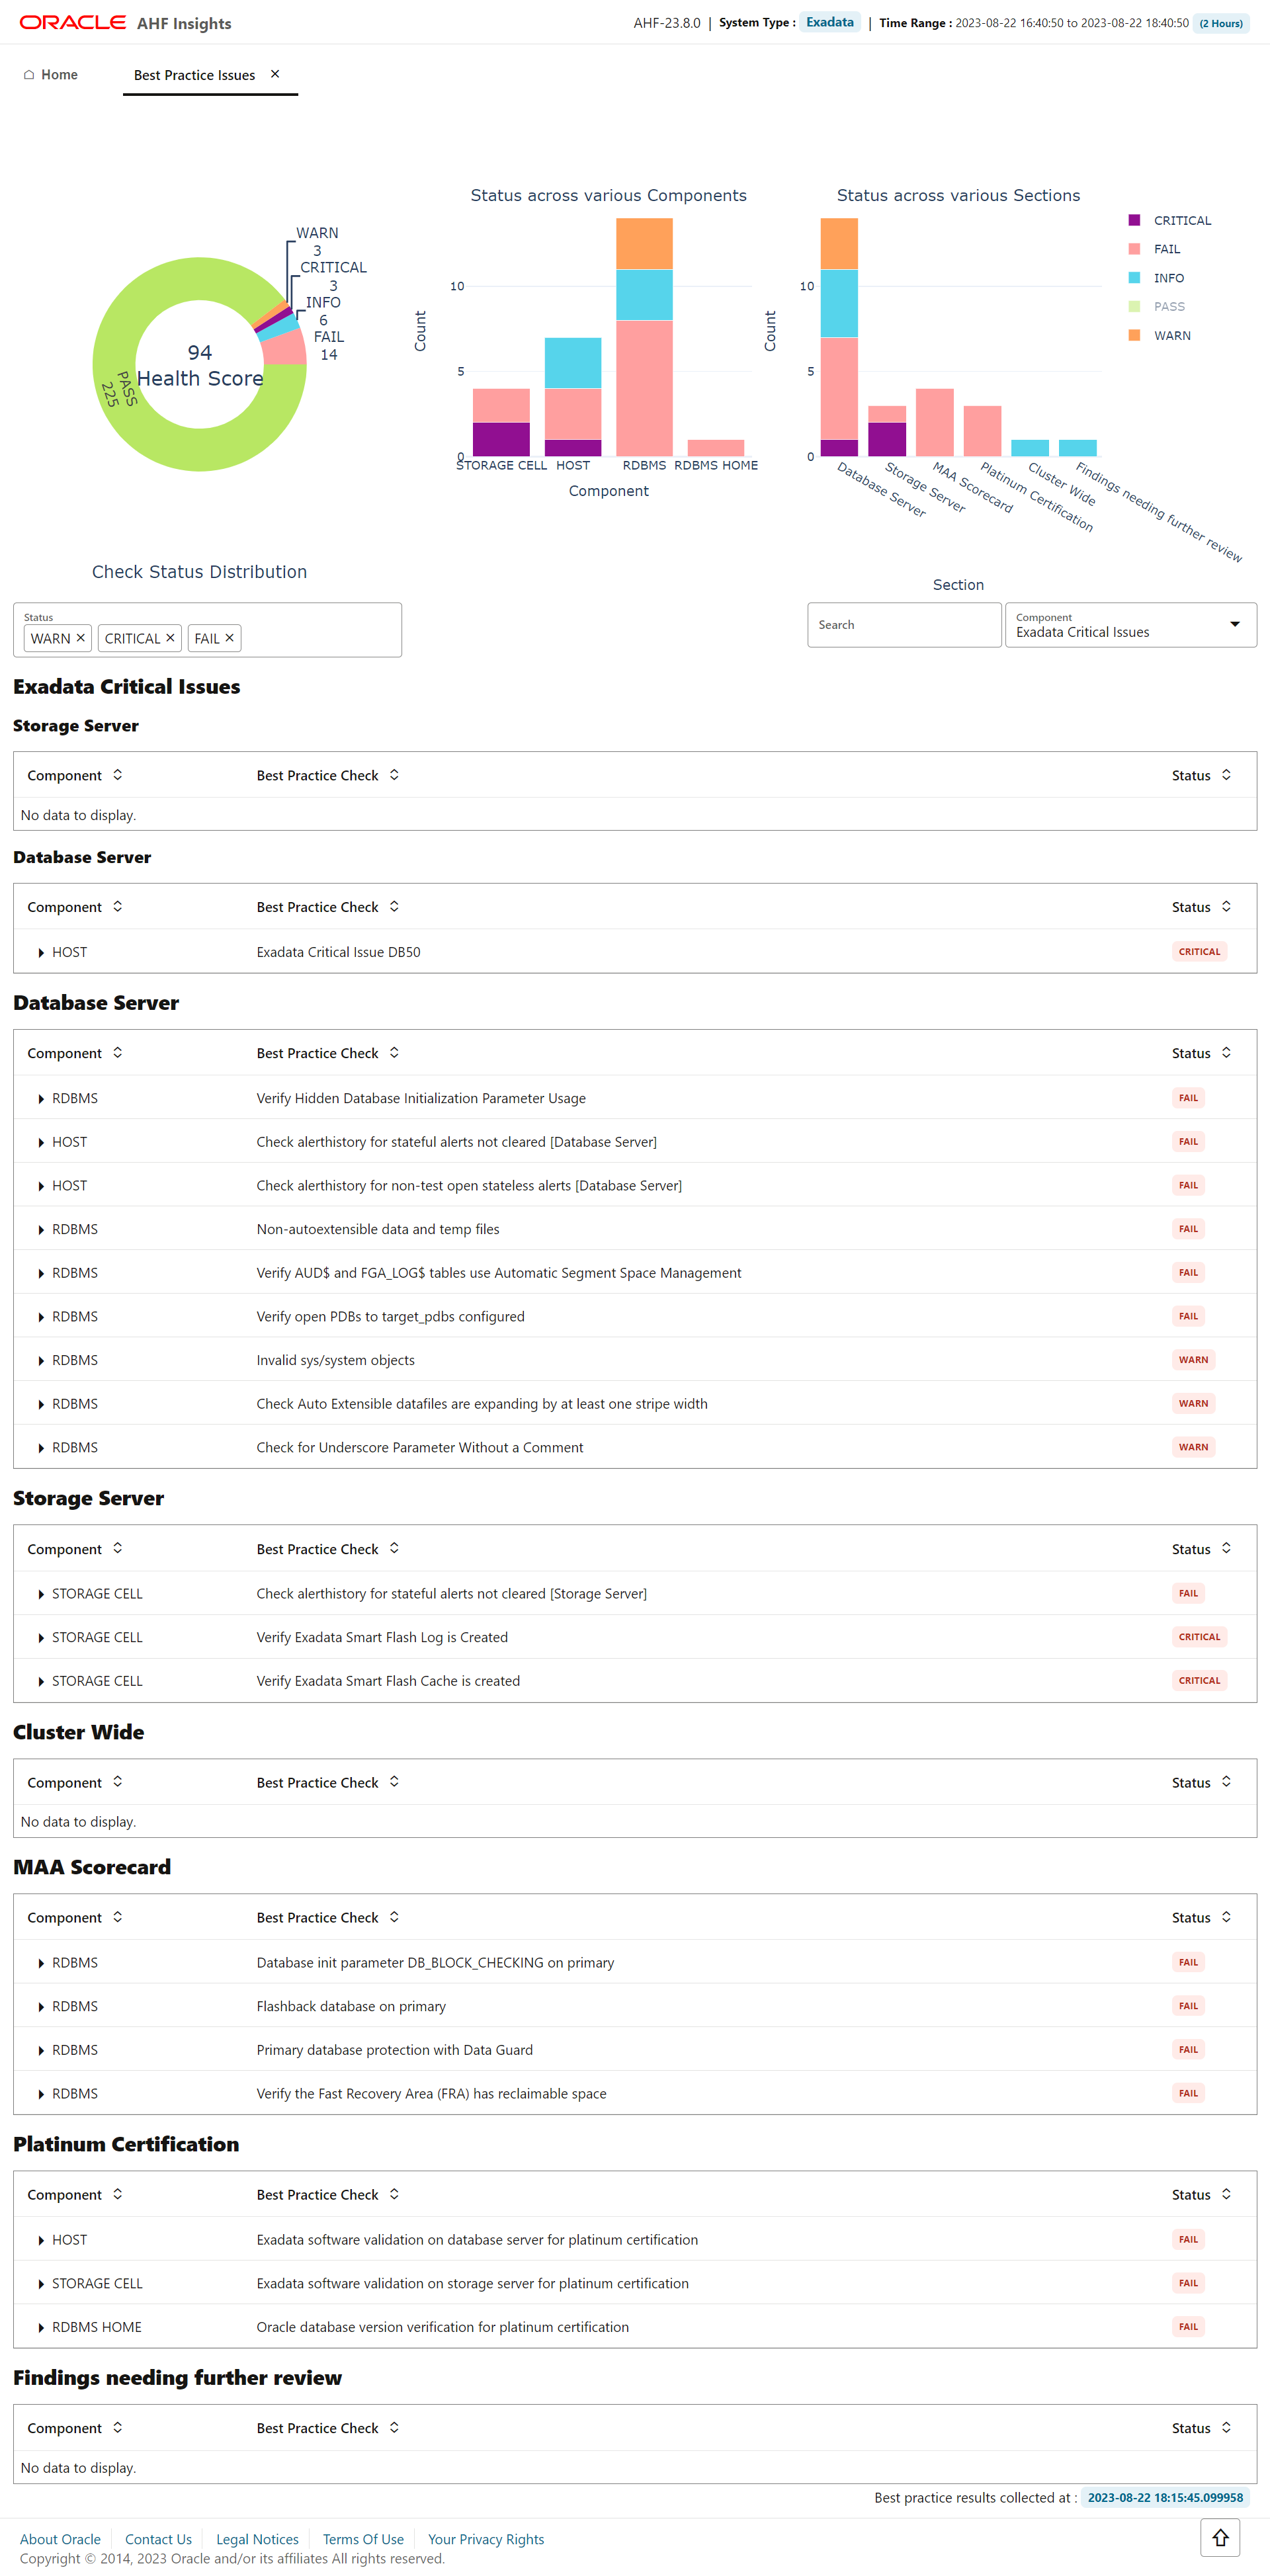
Provides the results of Best Practices Compliance checks run on the system, paginated. The details include the list of Components on which the checks were run, the Best Practice Checks that were run on the components, and Statuses of those checks.
- Click Settings to configure which information is displayed in the report. A modal dialog appears with various buttons and toggle options.
- Click Show Details to open a side panel that displays the formula used to calculate the Health Score.
- In the System Summary table, click the arrow buttons in the Database Servers, Storage Servers, and RDMA Switches rows to view more details.
- In the DB Homes row of the System Summary table, click the arrow button to open a side panel showing the DB Homes list of the system.
- Use the Jump to section drop-down list to navigate directly to a specific section in the report.
Parent topic: Insights
5.3.2.4 System Change
How does AHF Insights UI render this information
Figure 5-18 System Change
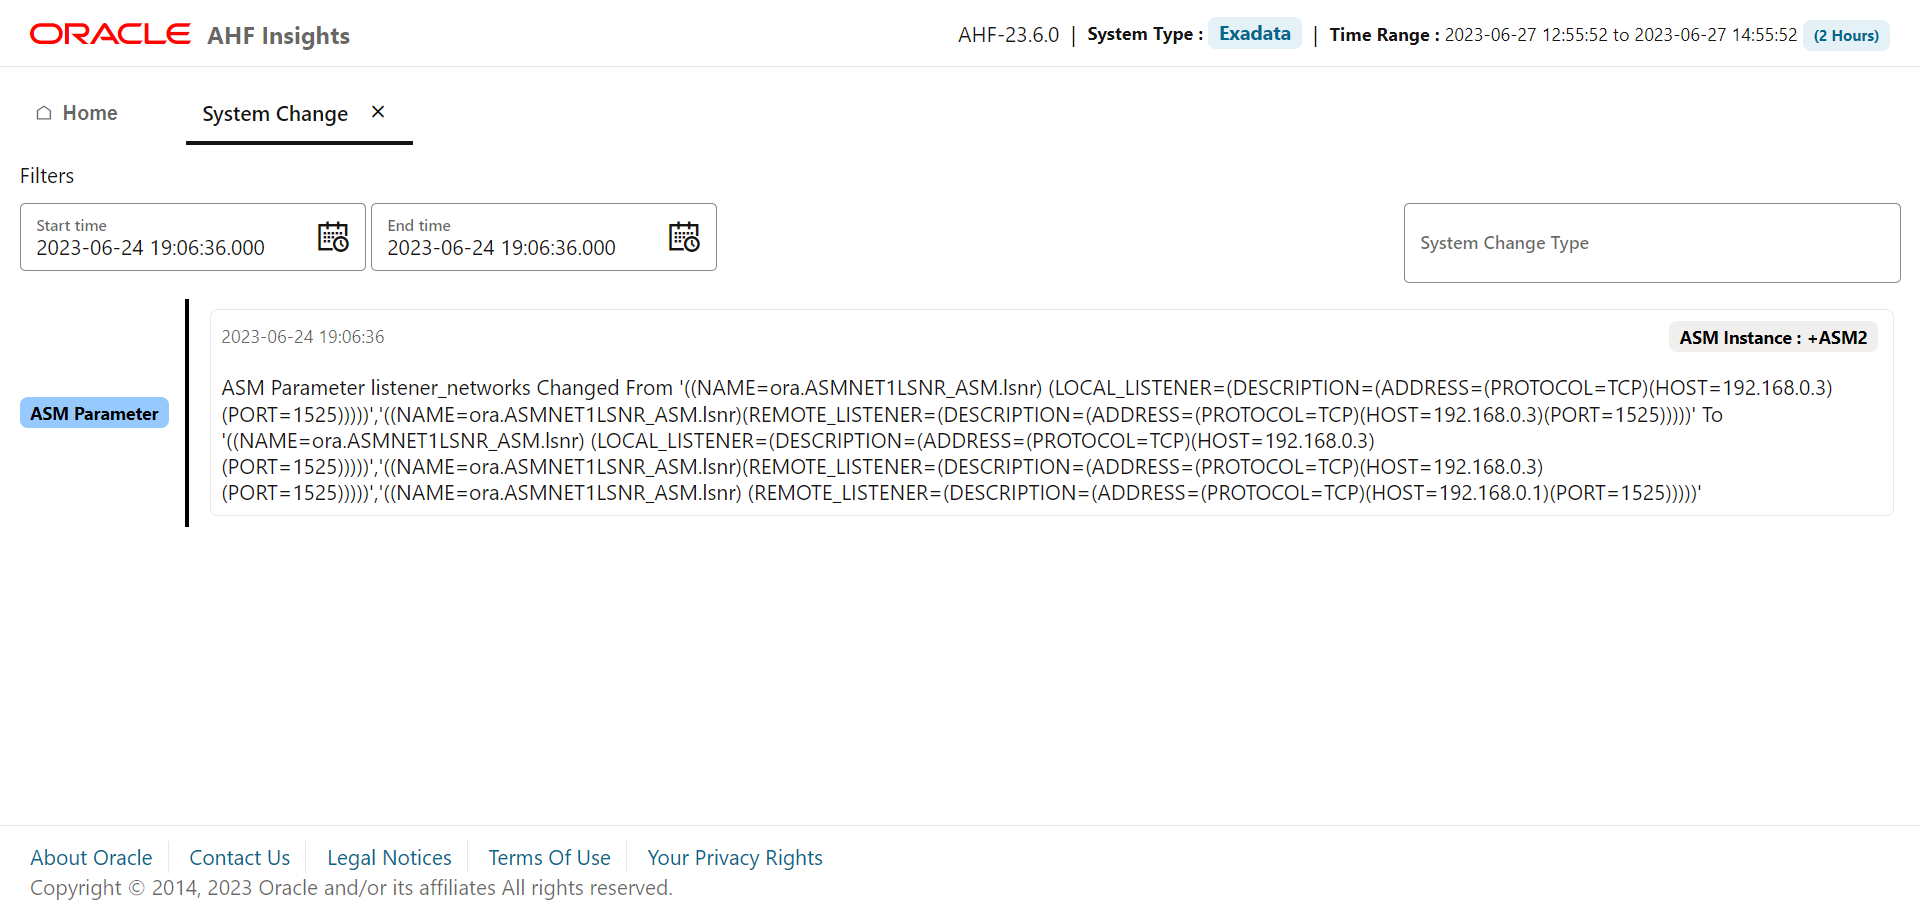
Provides details on the changes applied to the system, paginated.
- Search values using the filter section.
- Filter by a specific time range.
Parent topic: Insights
5.3.2.5 Recommended Software
AHF 23.8
Starting in AHF 23.8, you will be able copy data in text format into the clipboard to post it into SR body while raising a service request.
How does AHF Insights UI render this information
Figure 5-19 Recommended Software
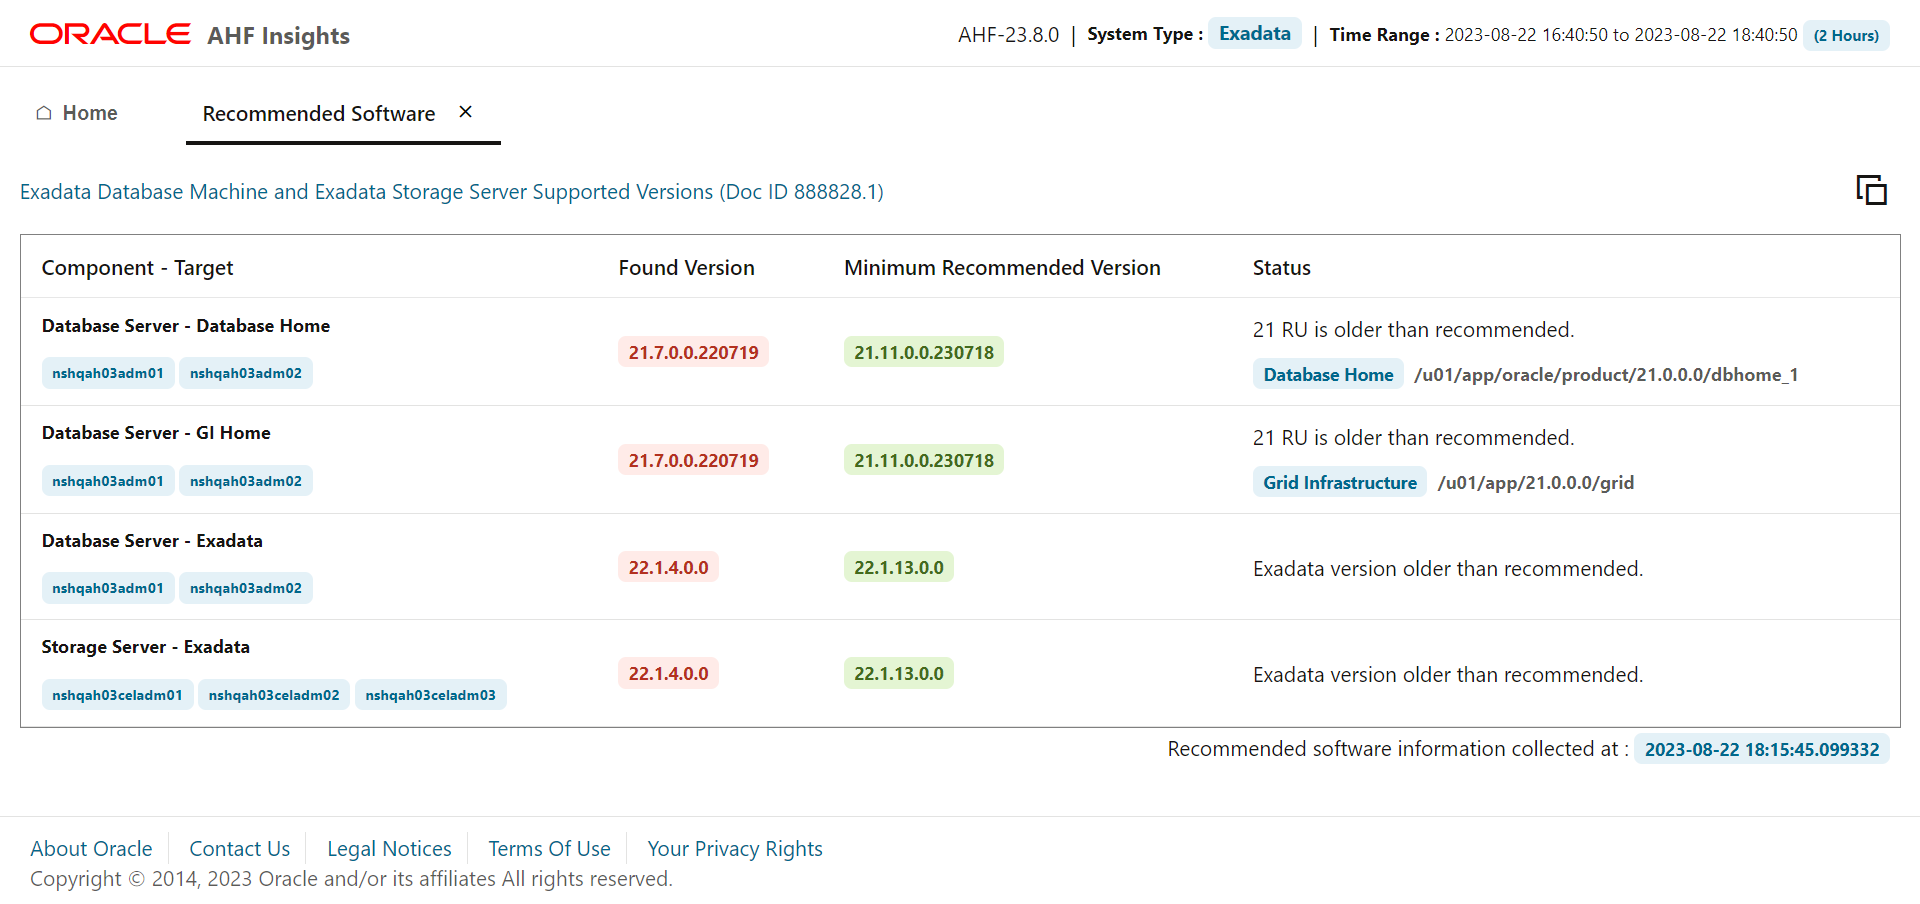
Lists recommended software and links to supported versions. Click Copy Snippet to copy the recommended version information to the clipboard.
Parent topic: Insights
5.3.2.6 Database Server
How does AHF Insights UI render this information
Database Server includes two sections, Management Server Metrics and Alerts recorded in Management Server across Hardware , Software, and ADR.
Metrics
Figure 5-20 Database Server Metrics
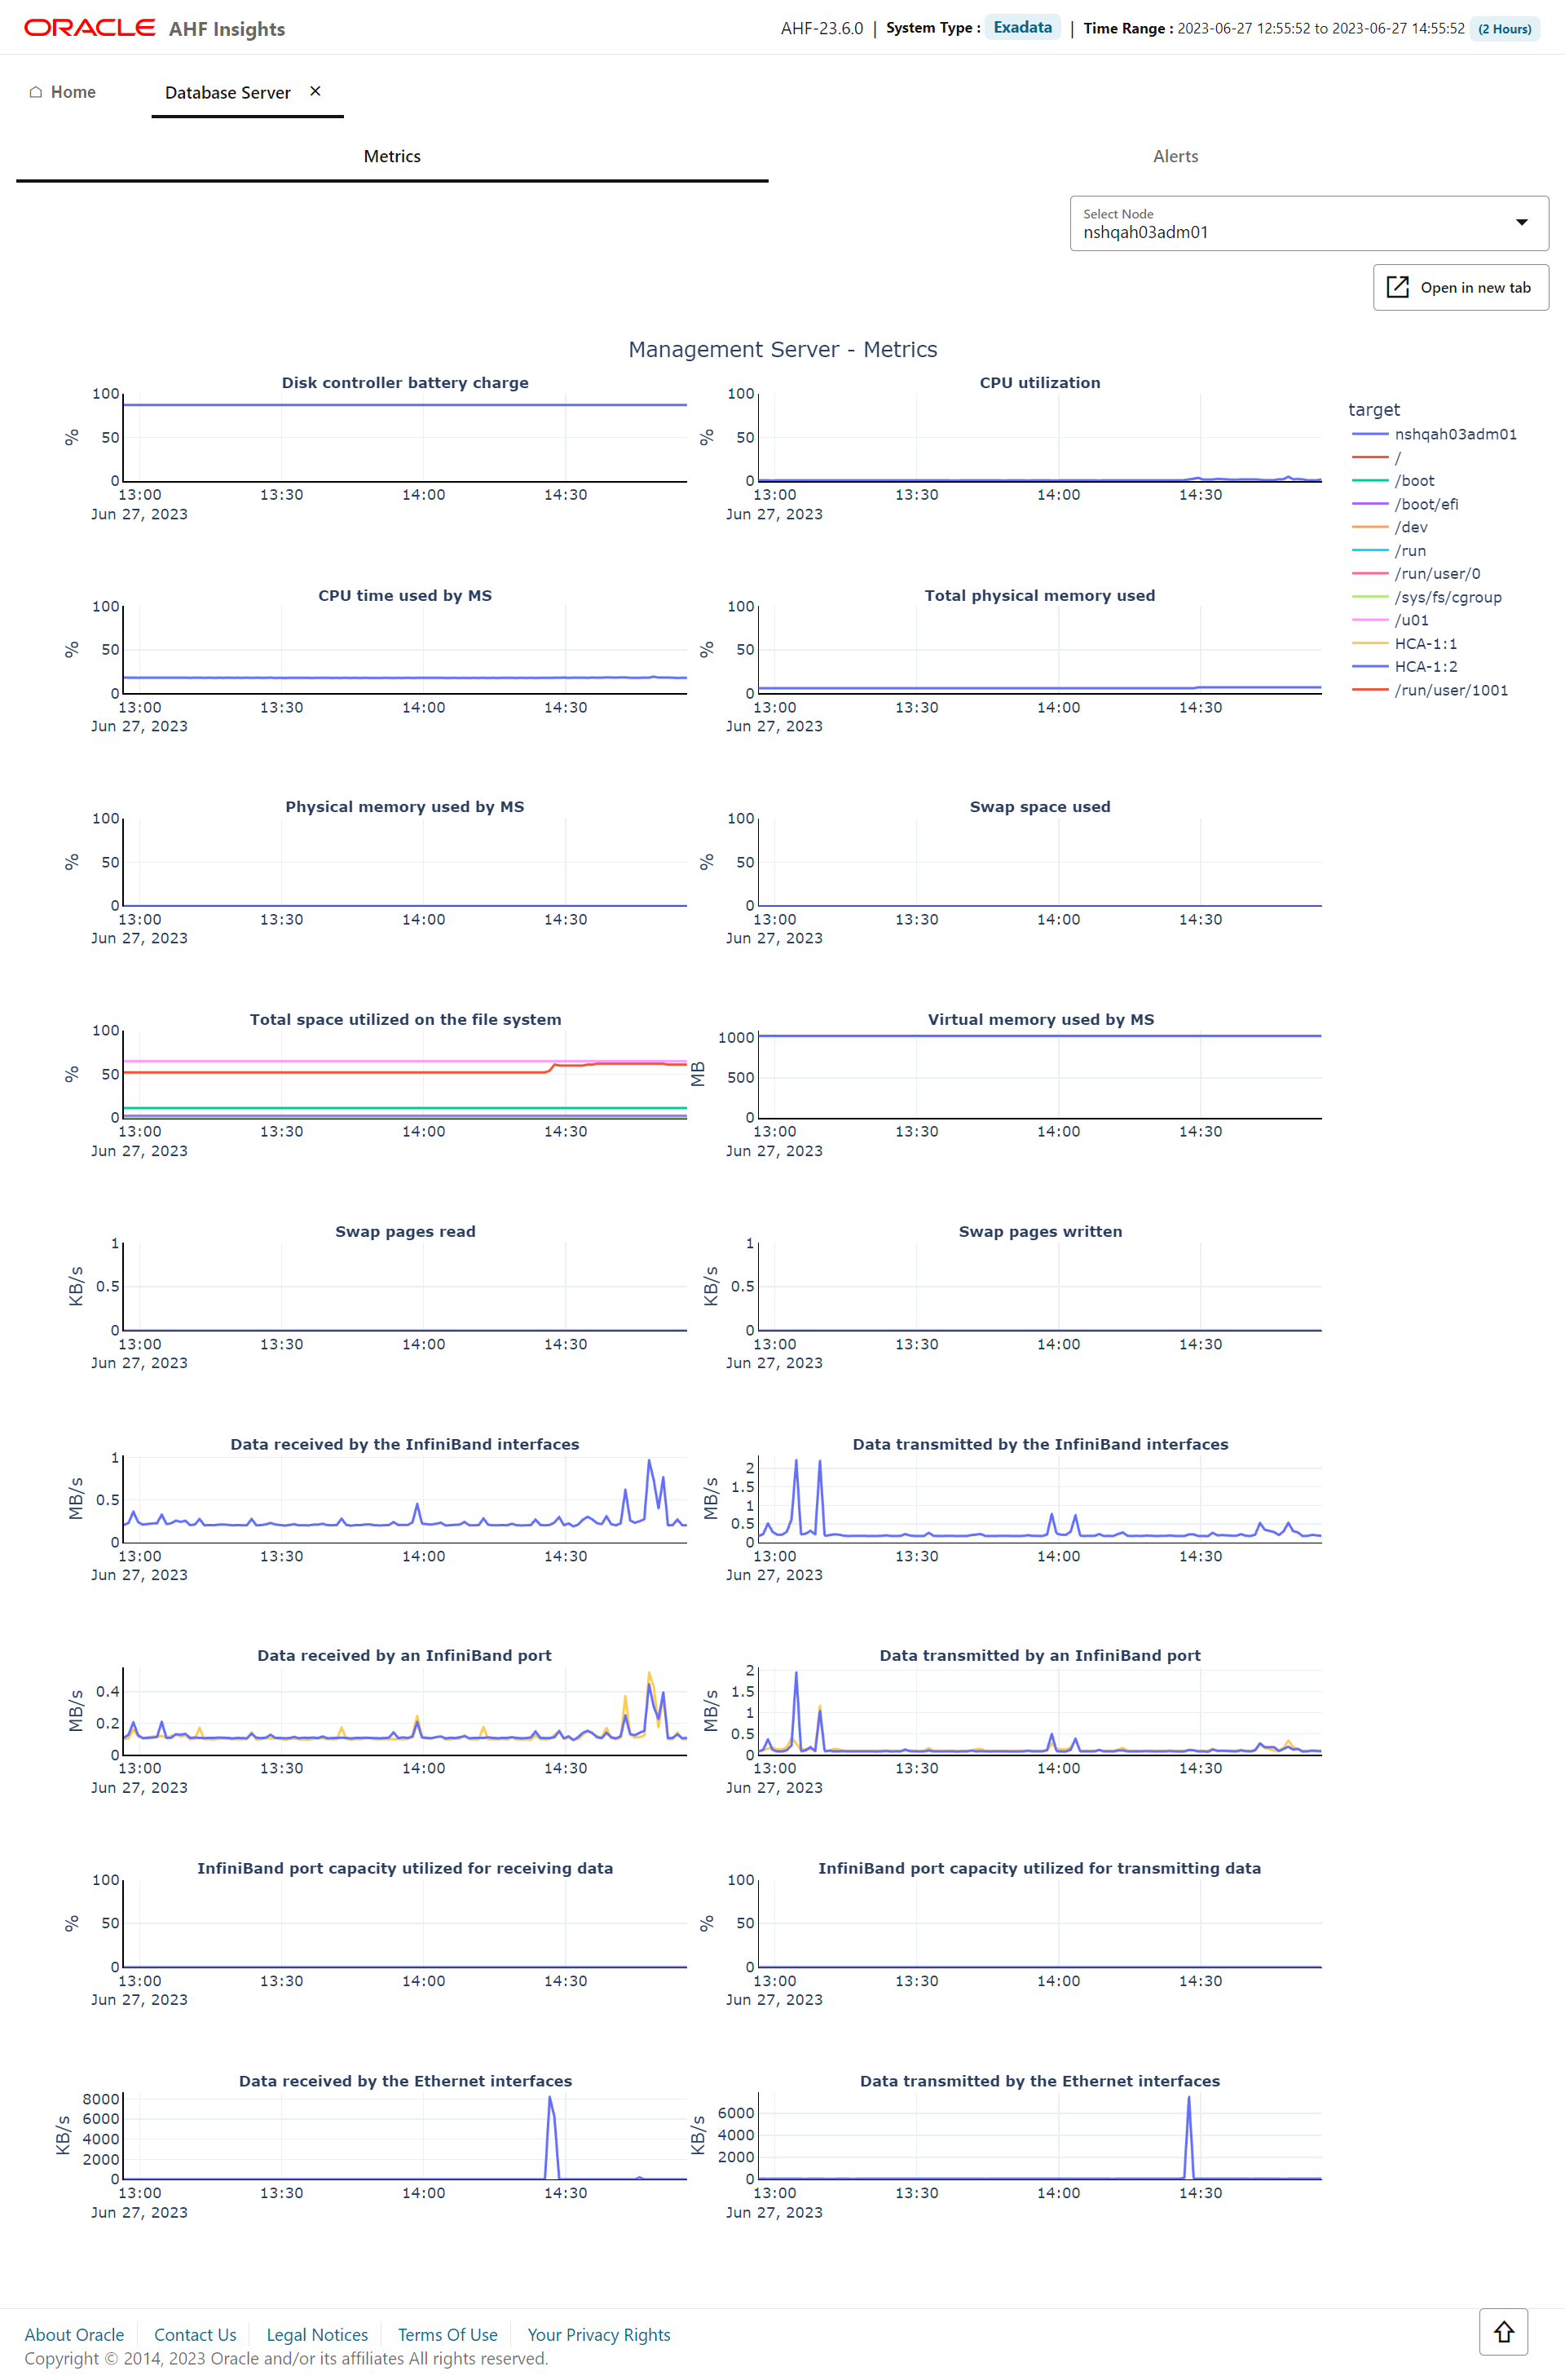
Metrics section provides details about the Management Server metrics such as Disk controller battery charge, CPU utilization, CPU time used by the Management Server, Total space utilized on the file system, and so on.
- From the drop-down list, select a host for which you want to view the metrics.
Alerts
Figure 5-21 Database Server Alerts
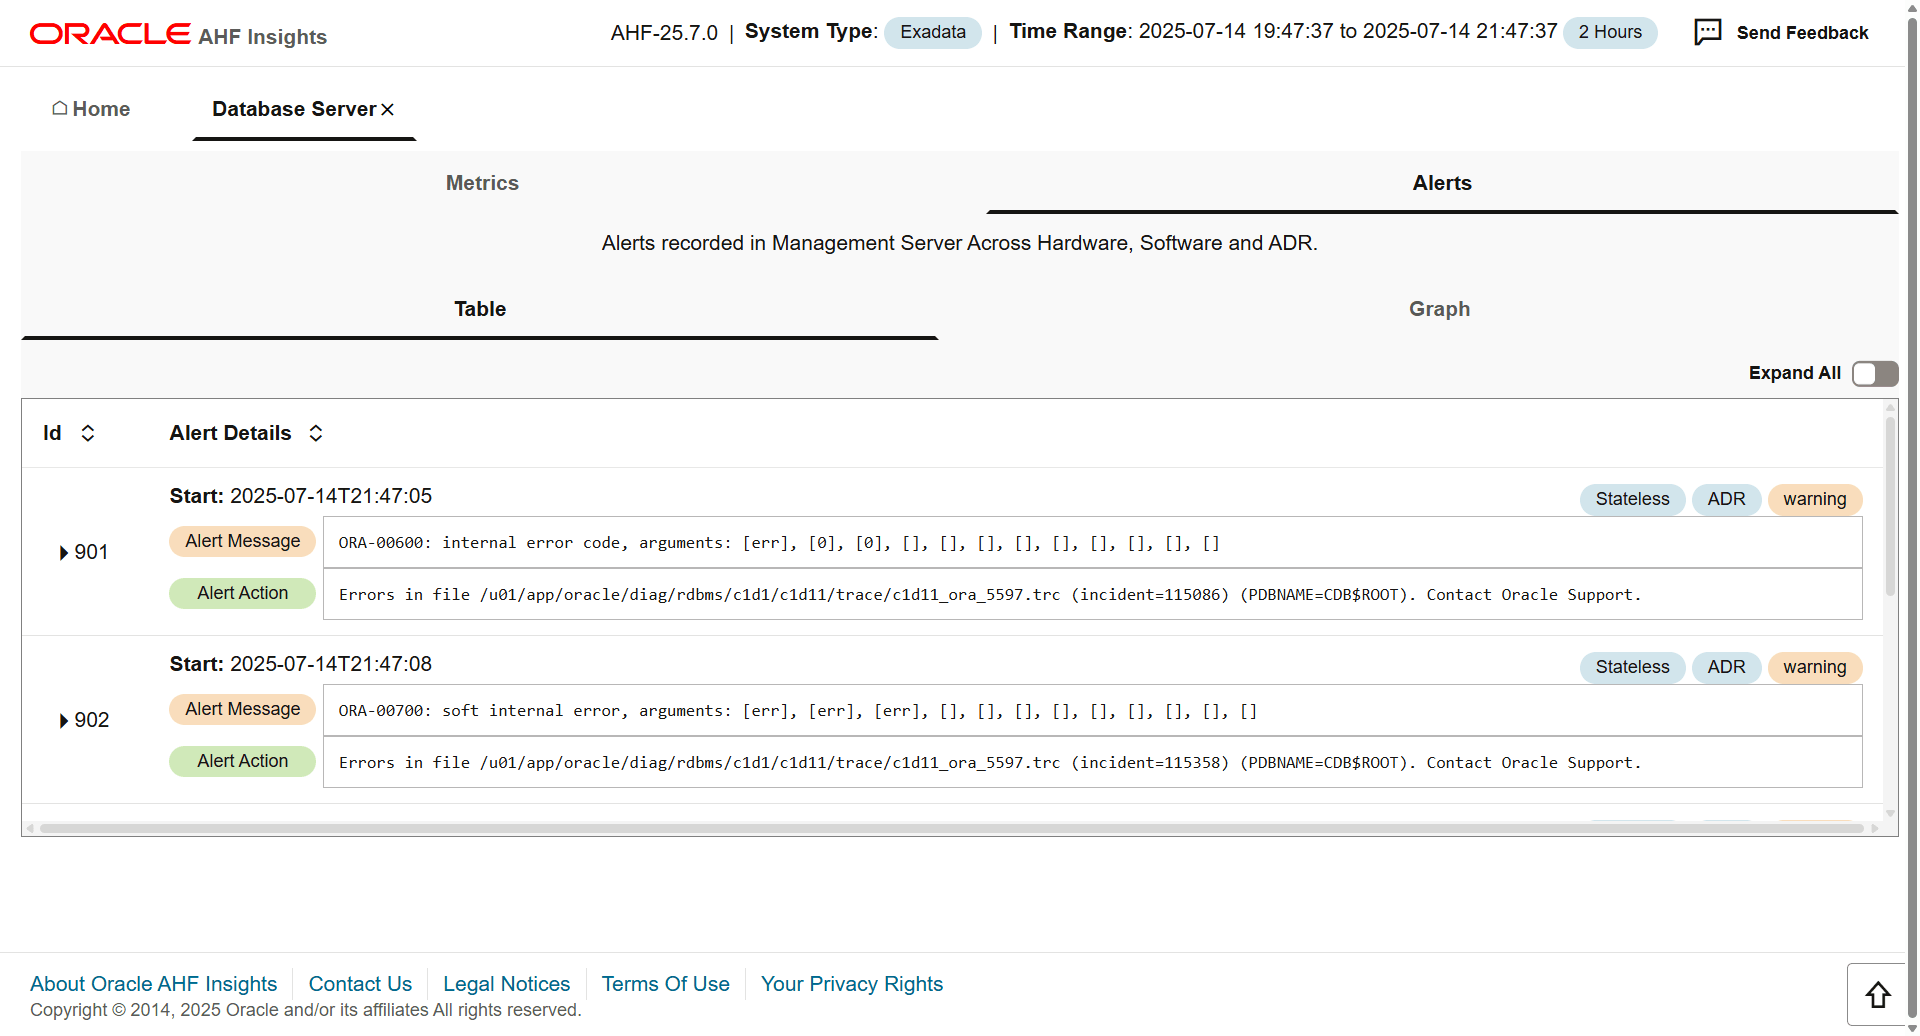
Alerts section provides details about the Alerts recorded in the Management Server across hardware, software, and ADR. Alert section has two views, Table and Graph.
Table view provides Alert Details such as description of the alert and the remedial action you can take, in tabular format.
- Click the Expand All toggle button to view details of all alerts.
- Click the arrow to view detailed information about an alert.
Graph view categorises the alerts by severity such as Critical and Warning, and type such as Stateful and Stateless.
- Click the Show open alerts toggle button to view the list of open alerts. The button is turned on by default.
Related Topics
Parent topic: Insights
5.3.2.7 RPM List
How does AHF Insights UI render this information
Figure 5-22 List of RPMs
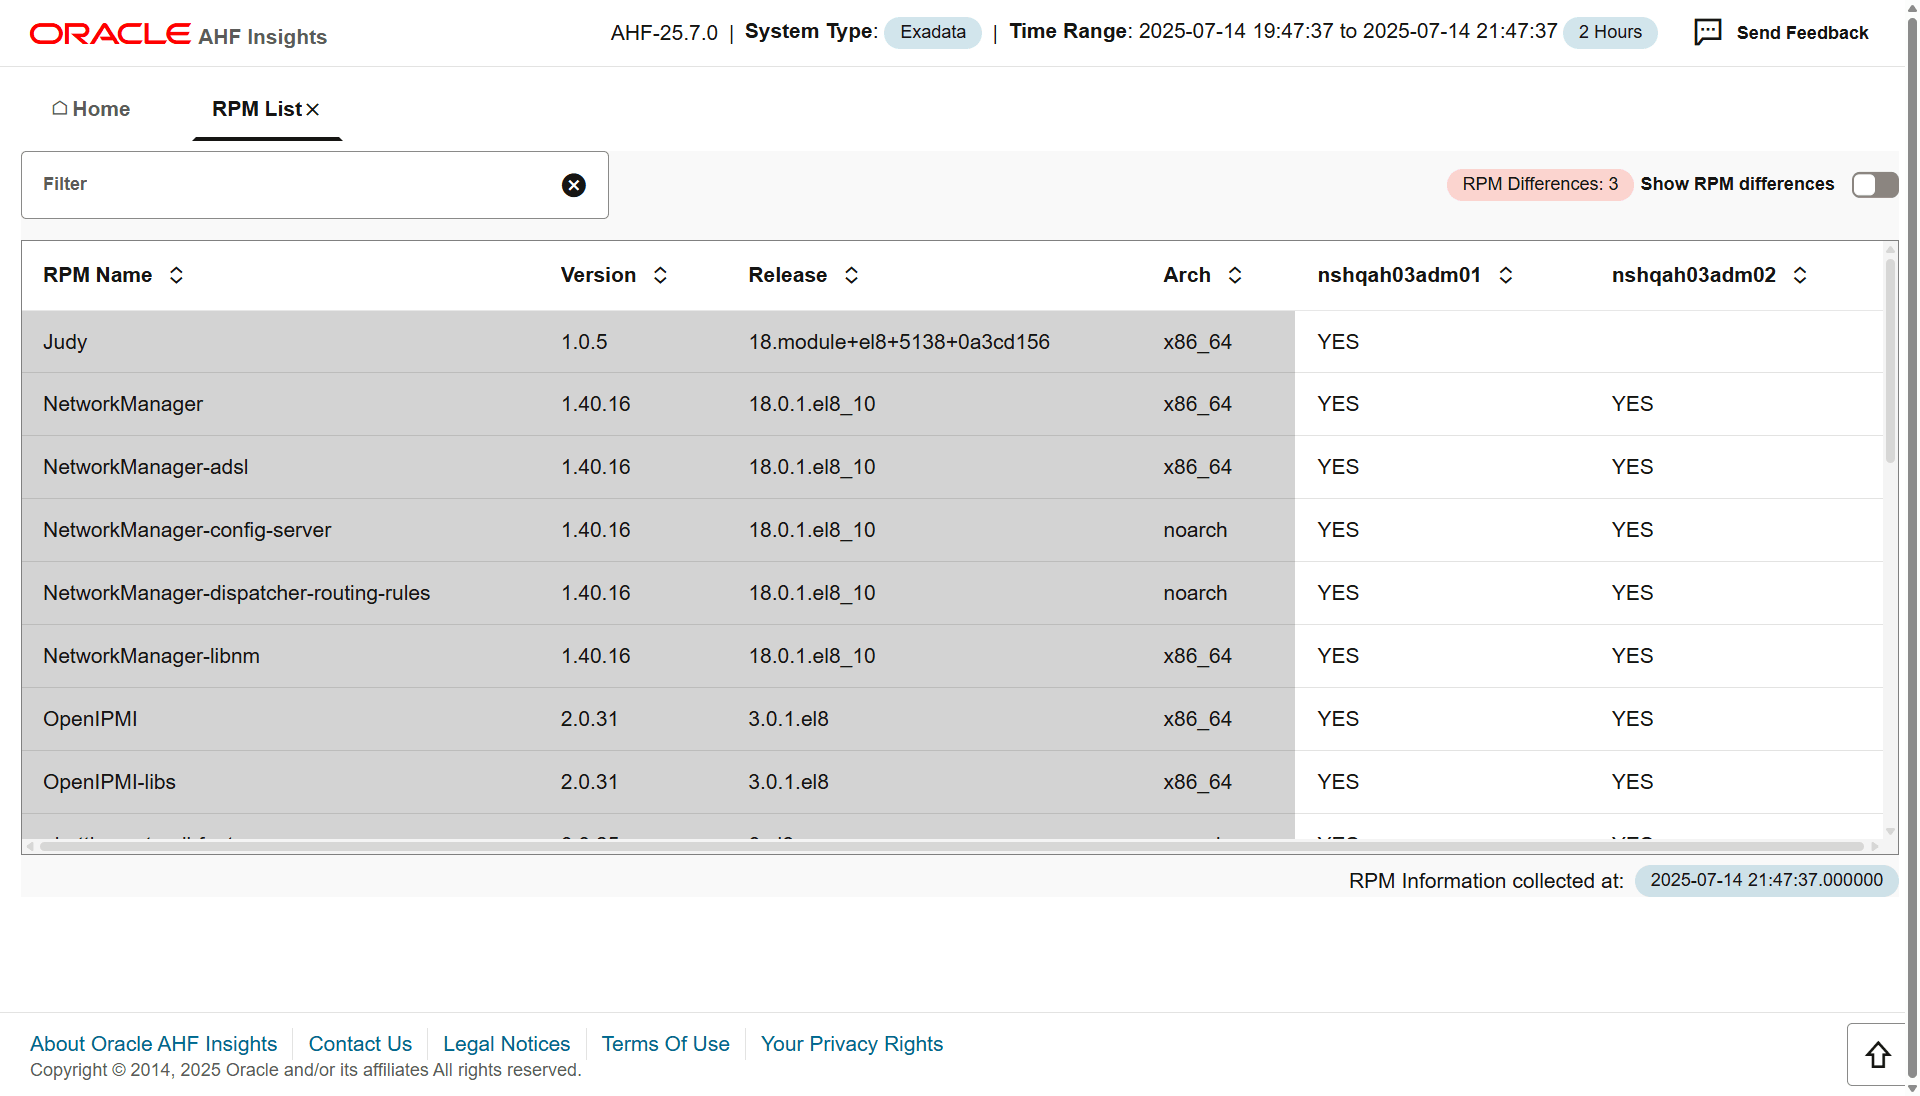
Lists RPMs and the differences between them across nodes.
- Enter the name of the parameter in the filter field to filter the RPMs.
- The RPM Name, Version, Release, and Arch columns remains fixed.
- Toggle the Show RPM Differences button to view the differences between the RPMs across nodes.
Parent topic: Insights
5.3.2.8 Database Parameters
How does AHF Insights UI render this information
Figure 5-23 Oracle Database Parameters - Normal
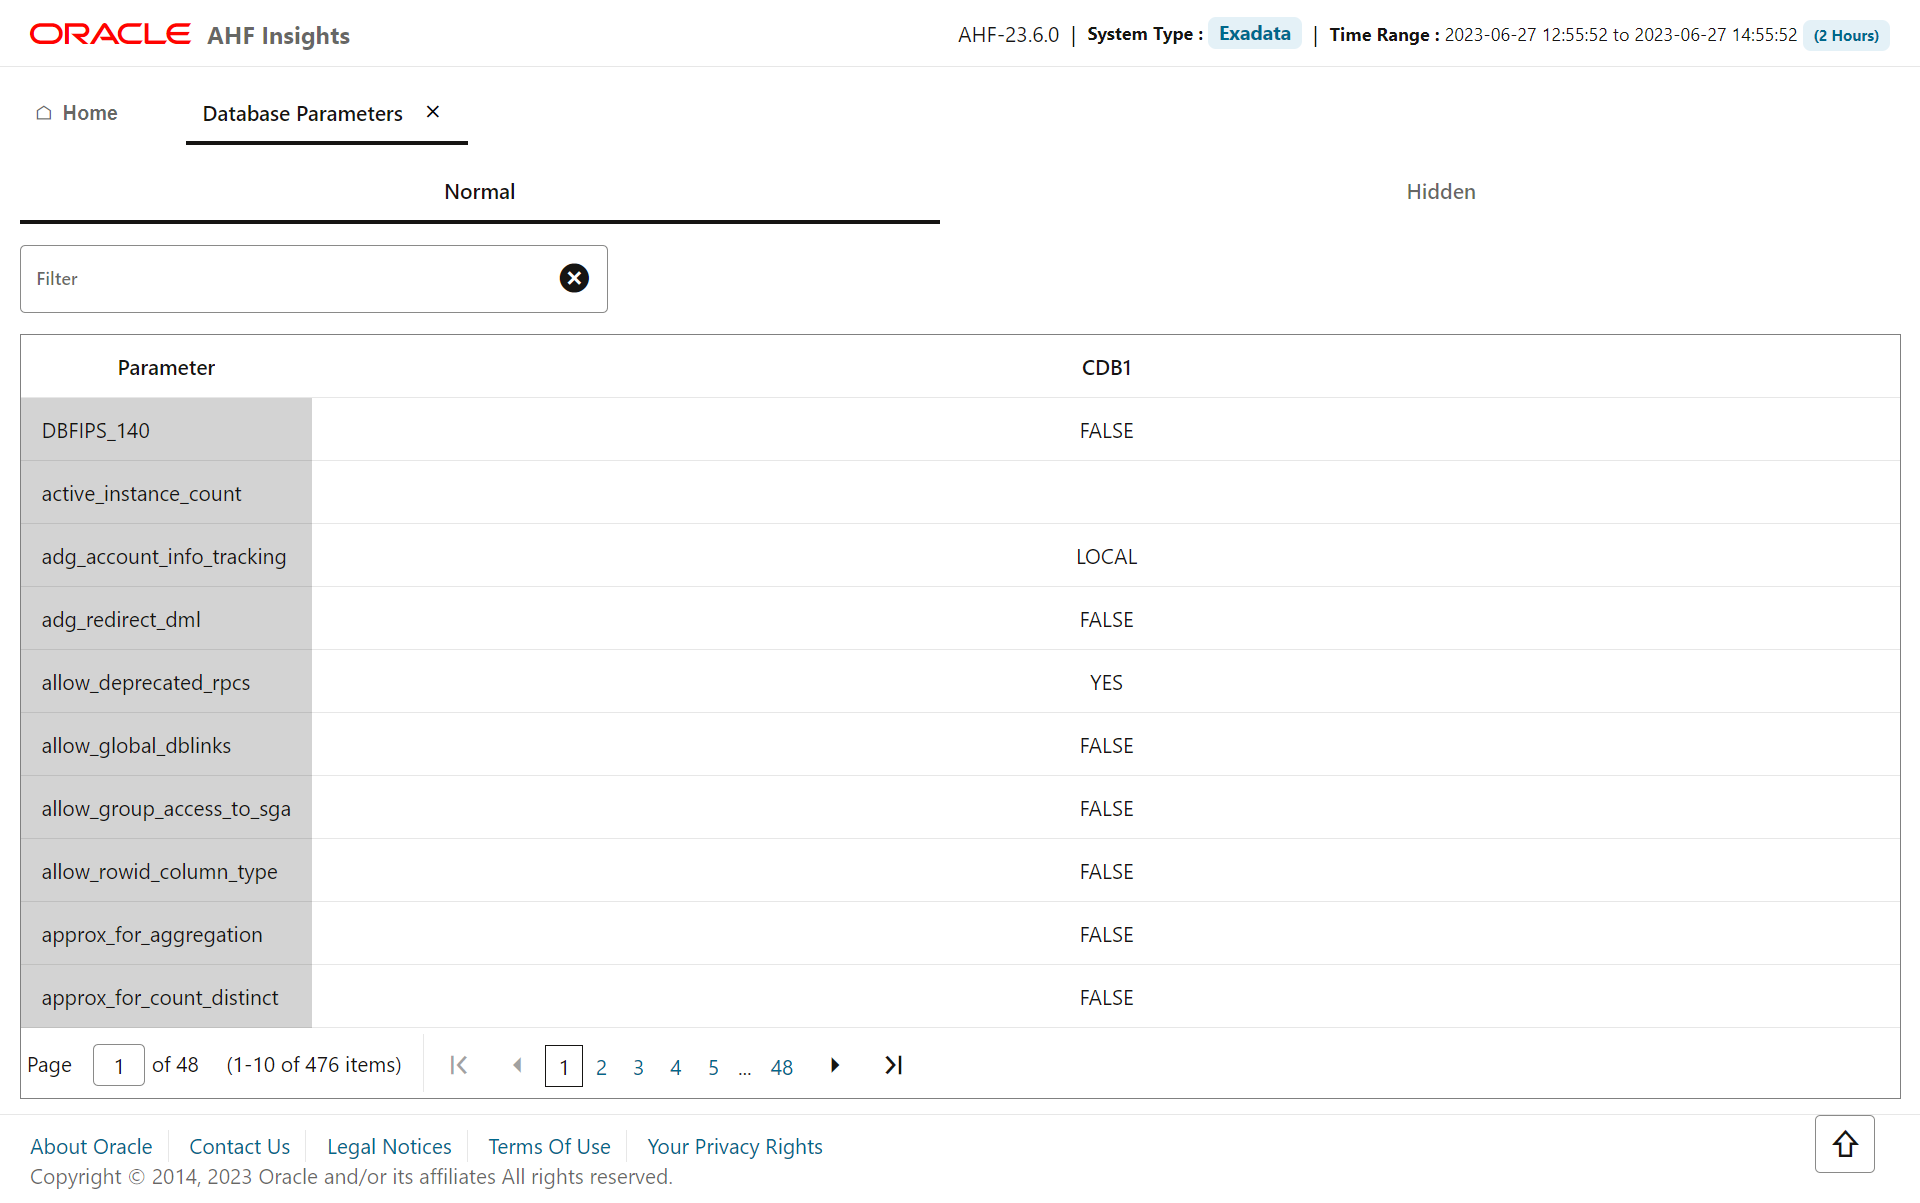
Figure 5-24 Oracle Database Parameters - Hidden
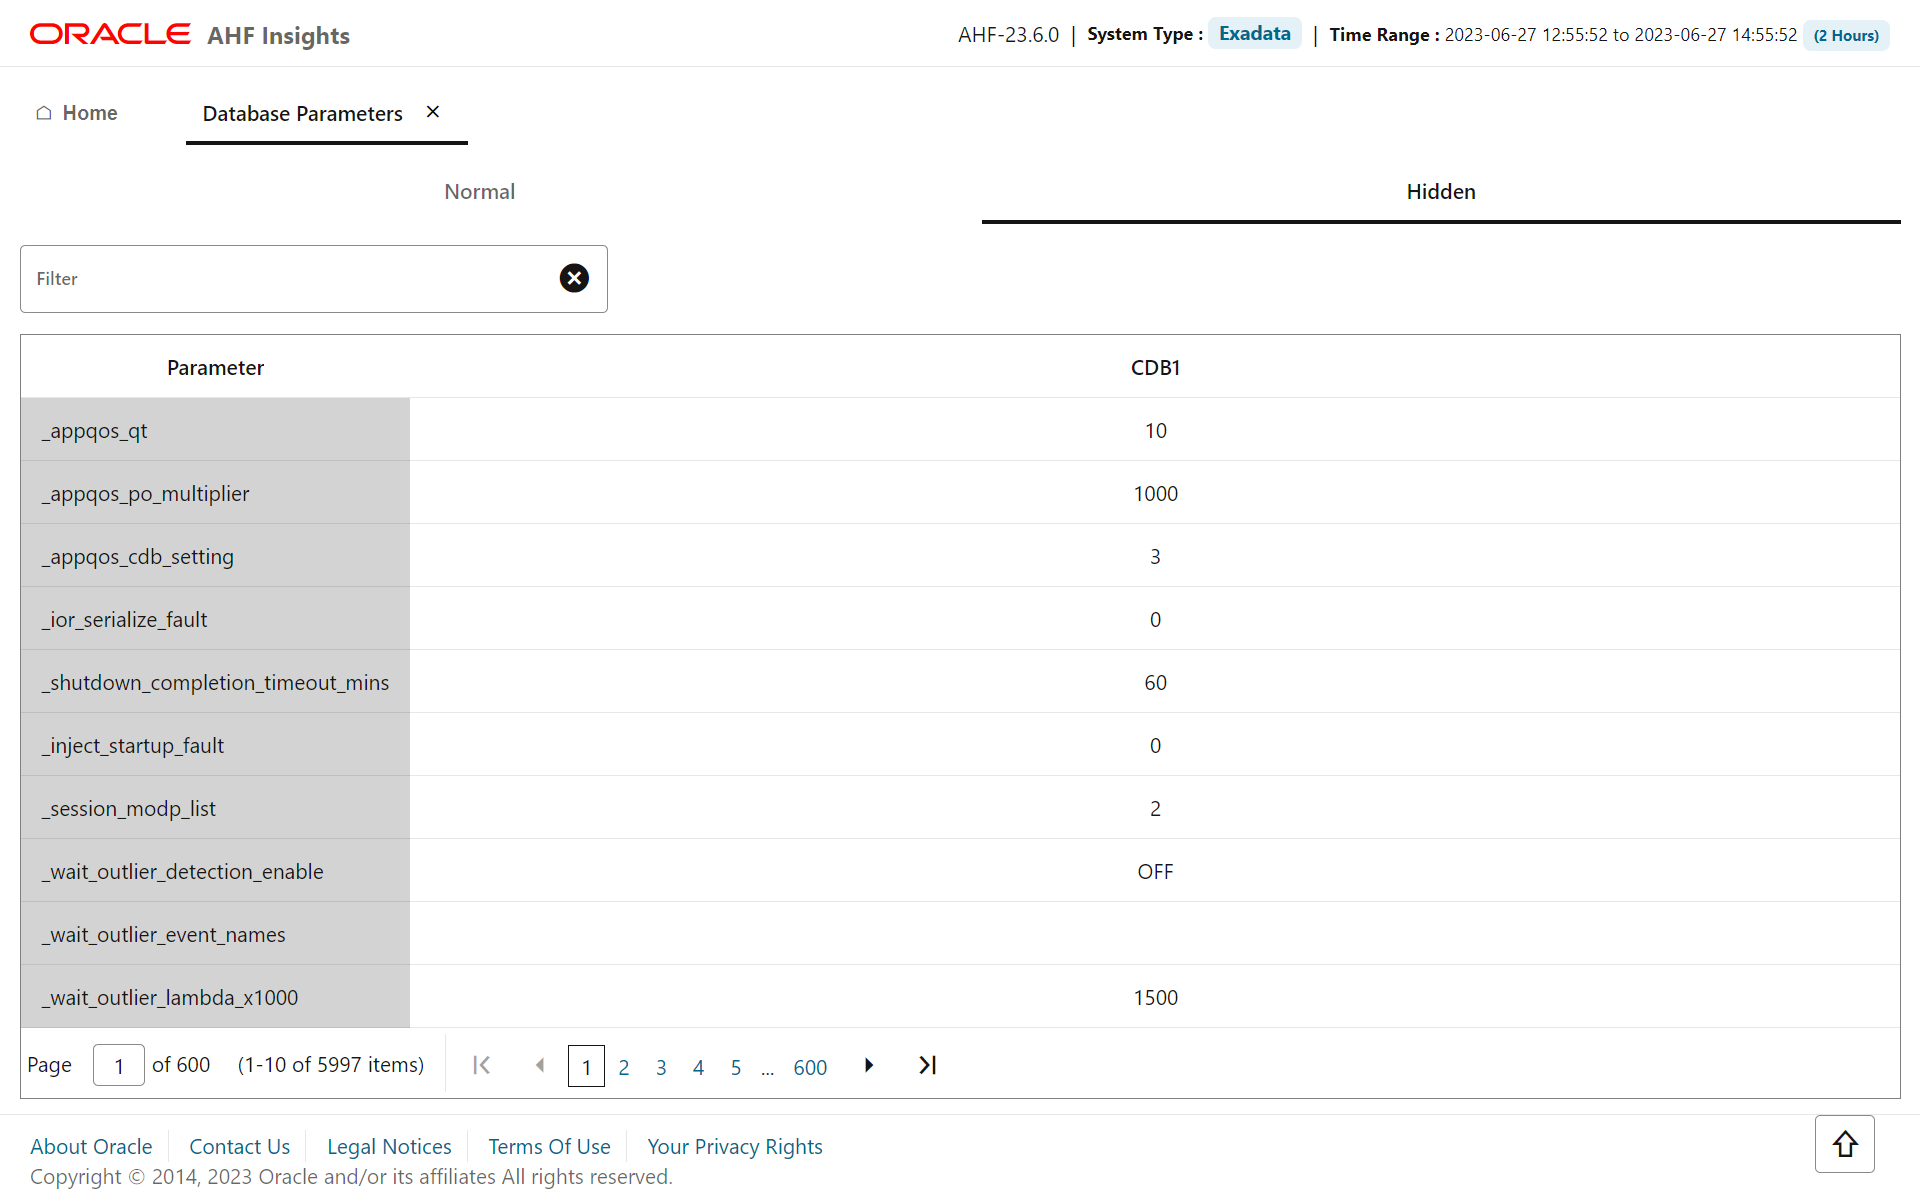
Lists normal and hidden Oracle Database parameters, paginated. This page also provides two views, Normal and Hidden. Normal view is displayed by default.
- Enter the name of the parameter in the filter field to filter the parameters.
- The Parameter column remains fixed and you can view the properties of each parameter across multiple databases.
- Click the Show different properties across databases toggle button to view different properties across databases.
- Click Hidden to view the hidden parameter.
Parent topic: Insights
5.3.2.9 Kernel Parameters
How does AHF Insights UI render this information
Figure 5-25 Kernel Parameters
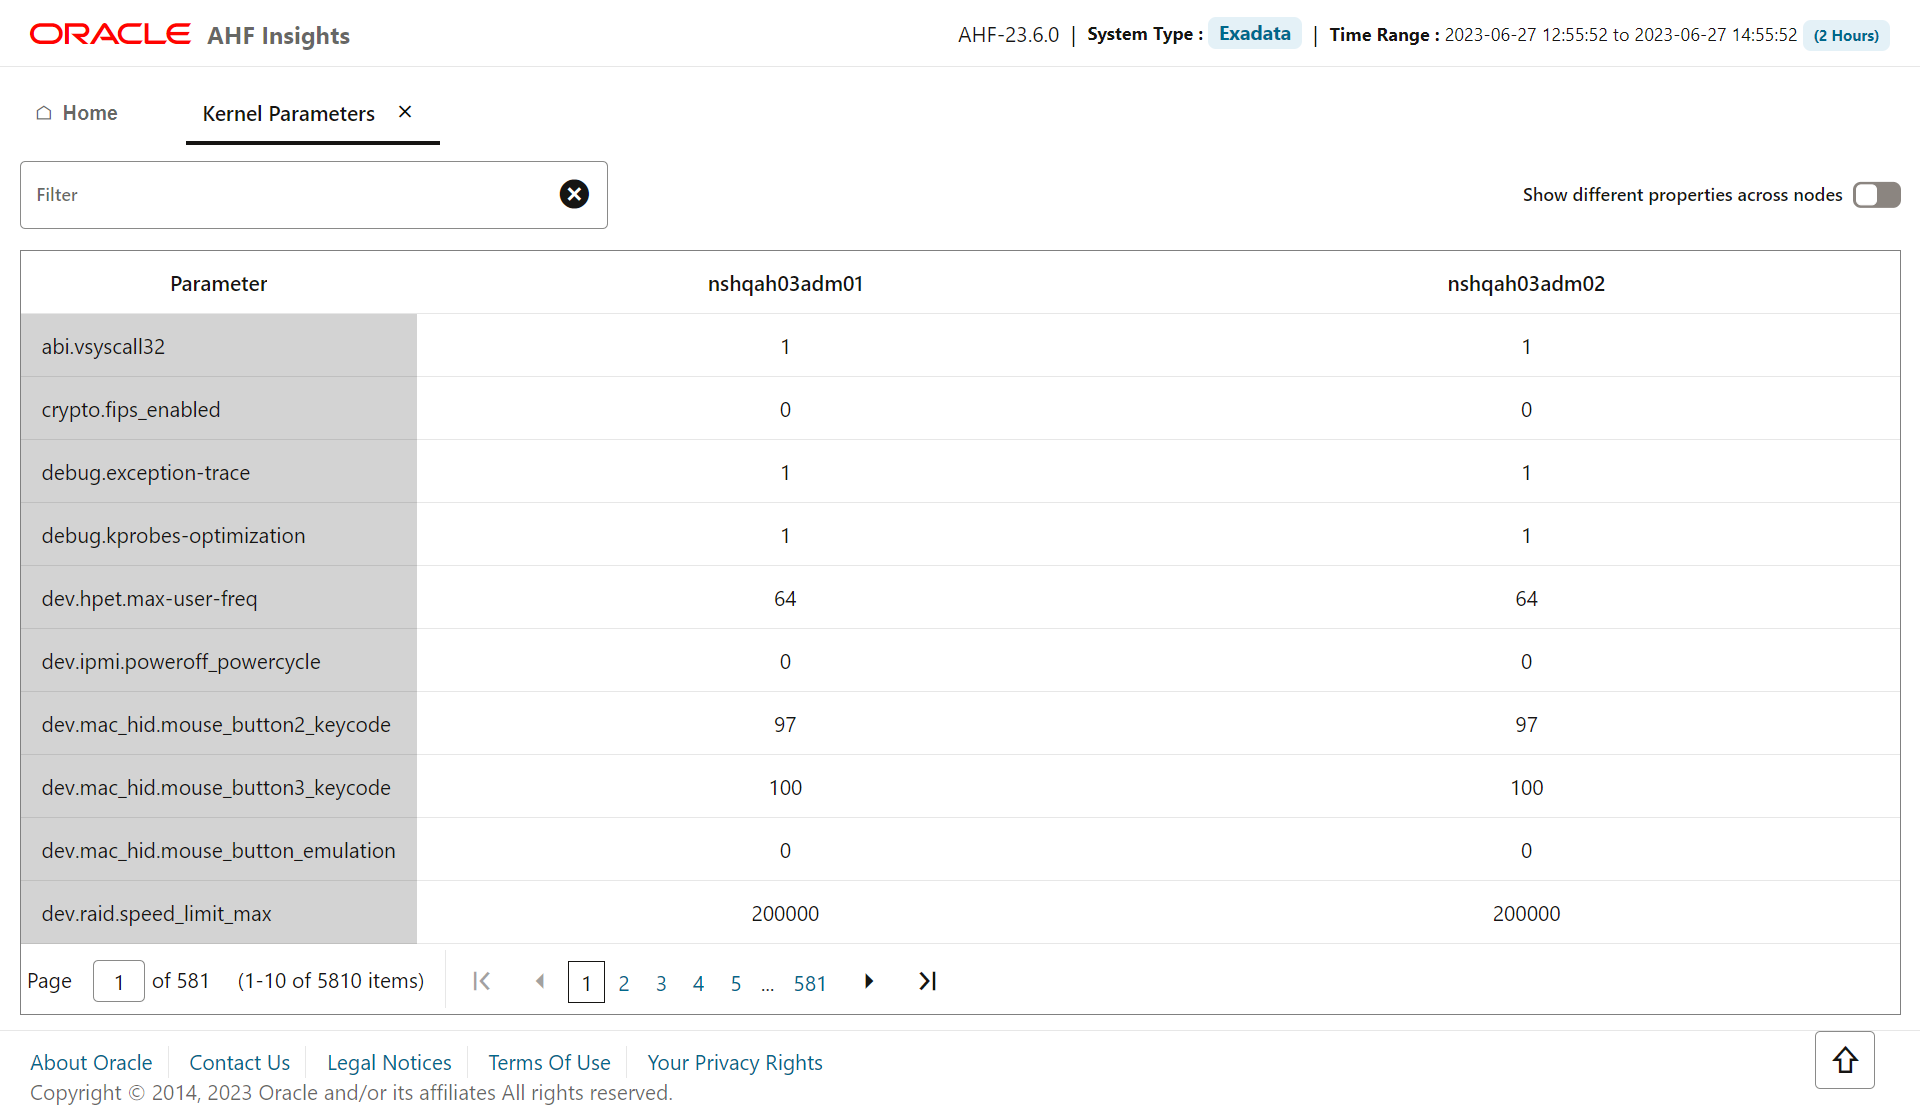
Lists the kernel parameters, paginated.
- Enter the name of the parameter in the filter field to filter the parameters.
- The Parameter column remains fixed and you can view the properties of each parameter across multiple hosts/nodes.
- Click the Show different properties across nodes toggle button to view different properties across hosts/nodes.
Parent topic: Insights
5.3.2.10 Patch Information
How does AHF Insights UI render this information
Figure 5-26 Patch Information - Timeline
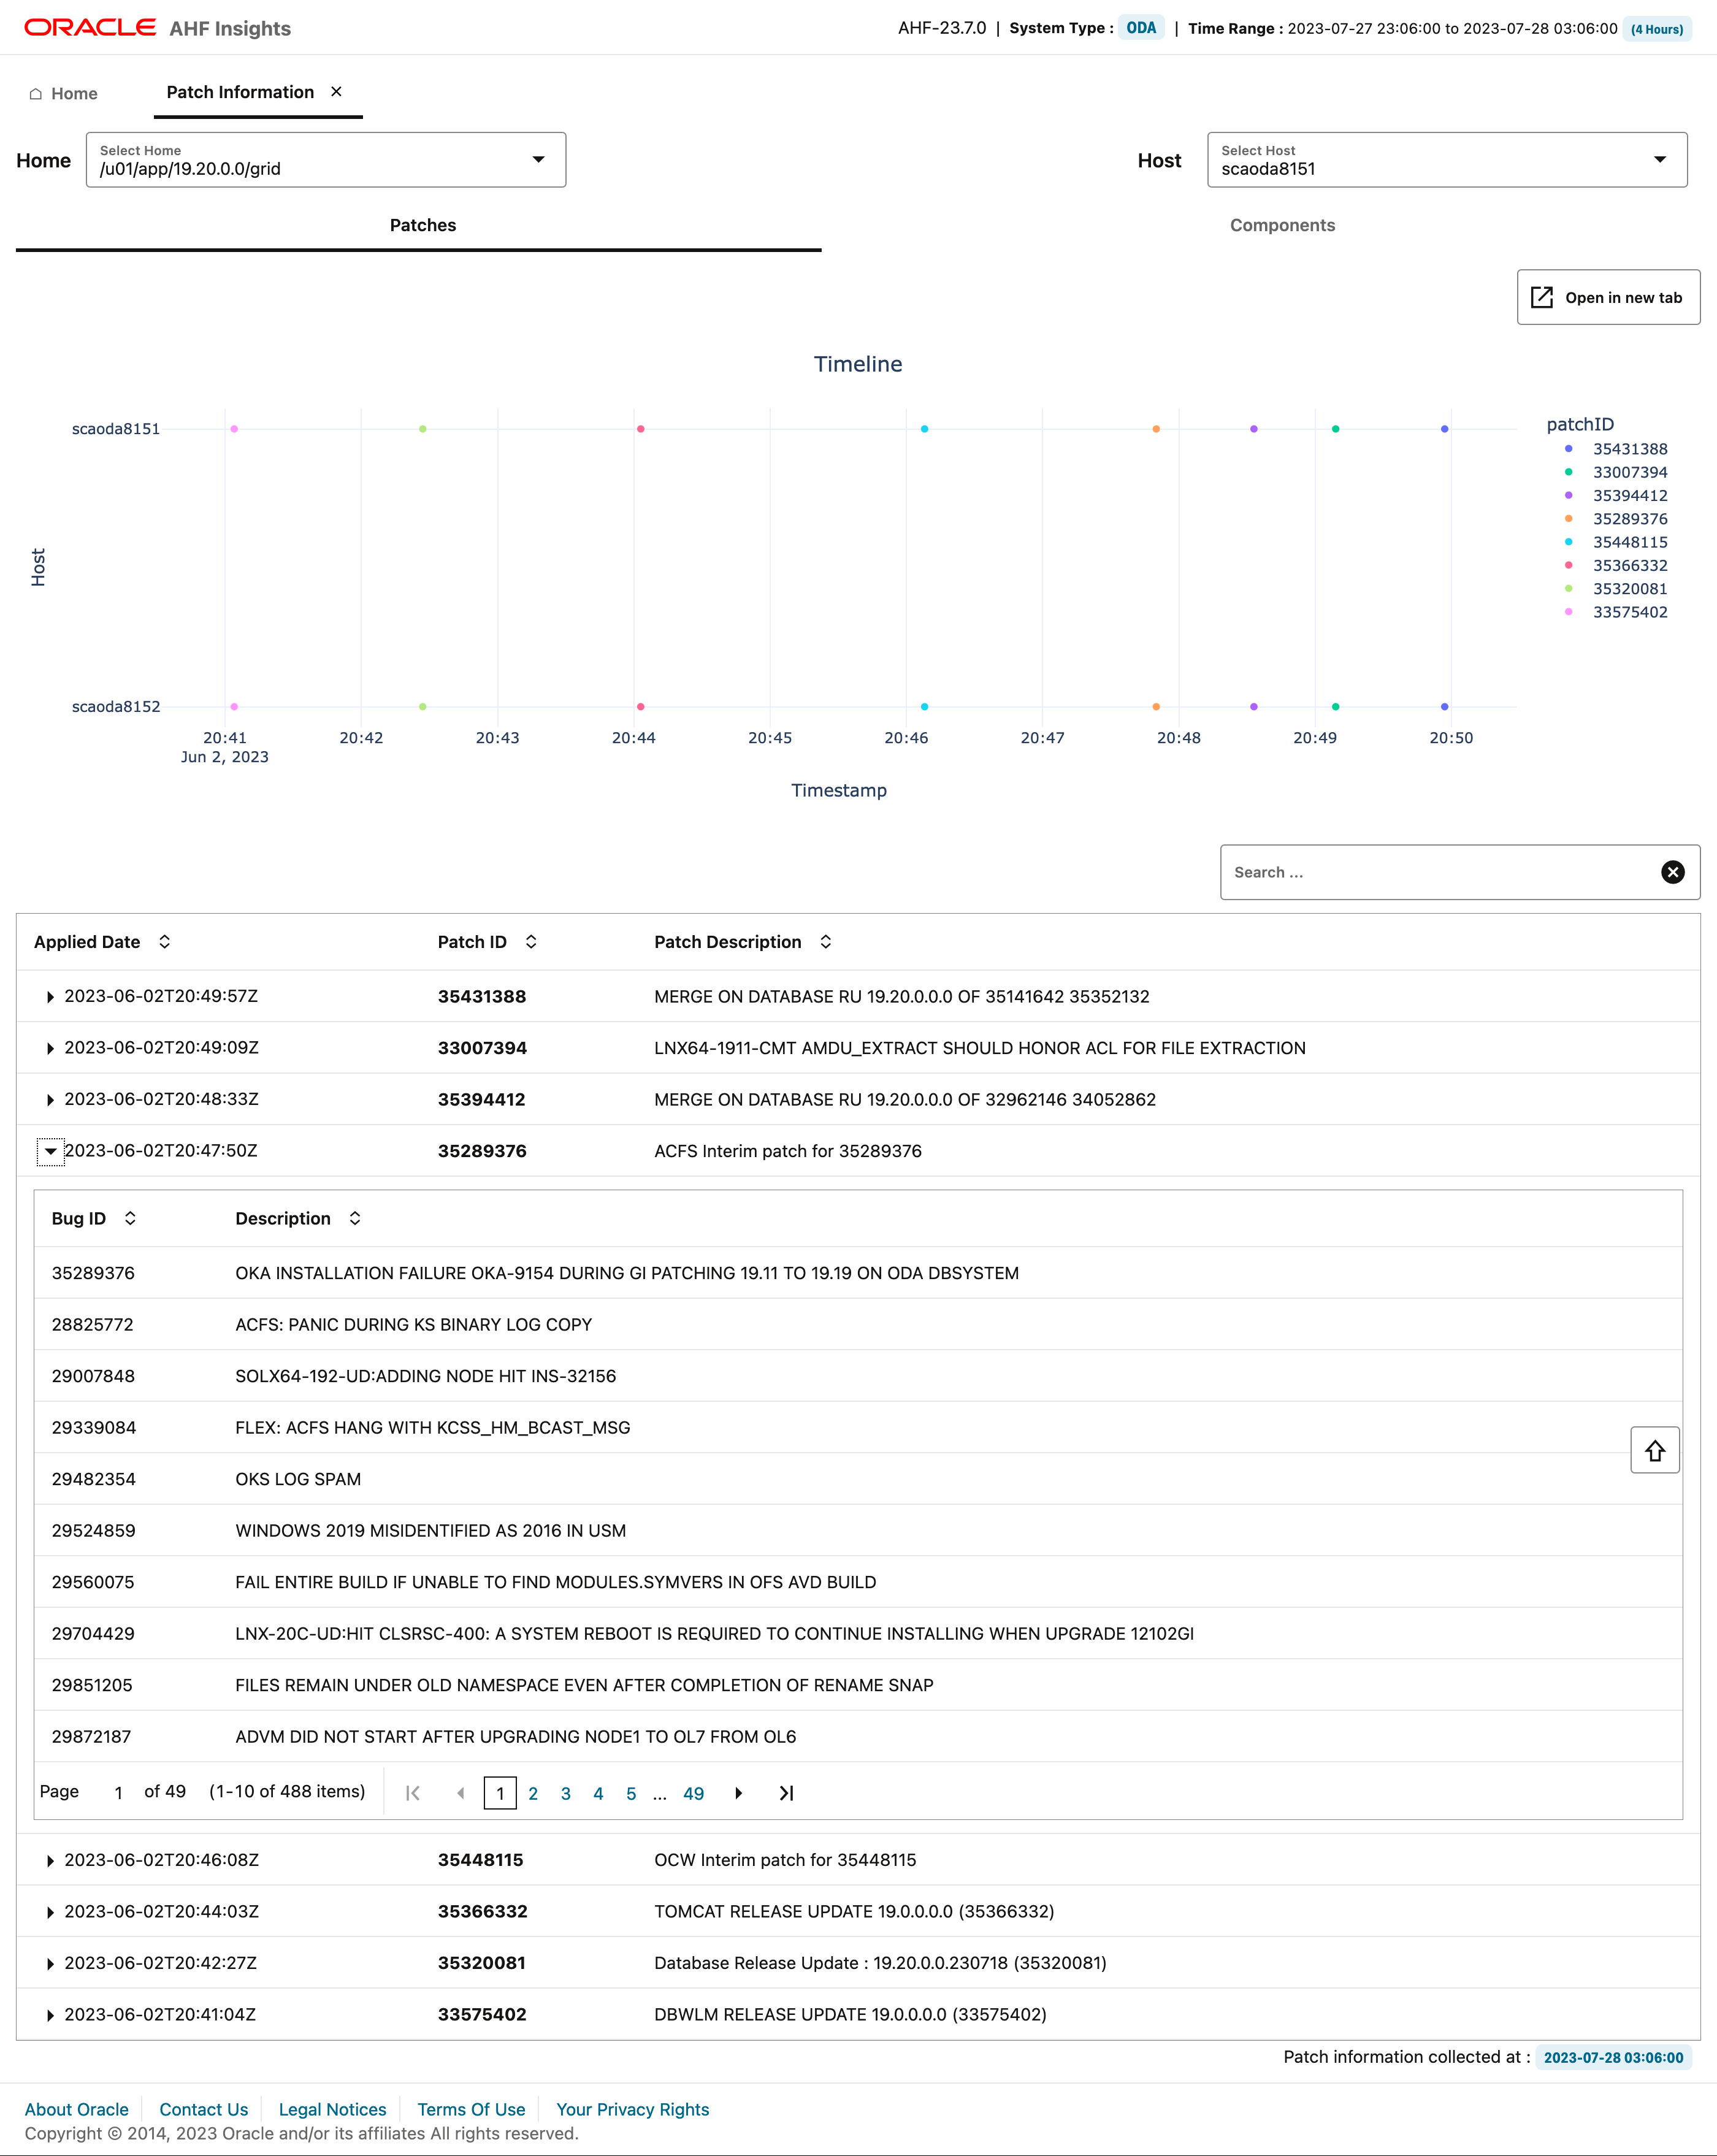
Figure 5-27 Patch Information - Components
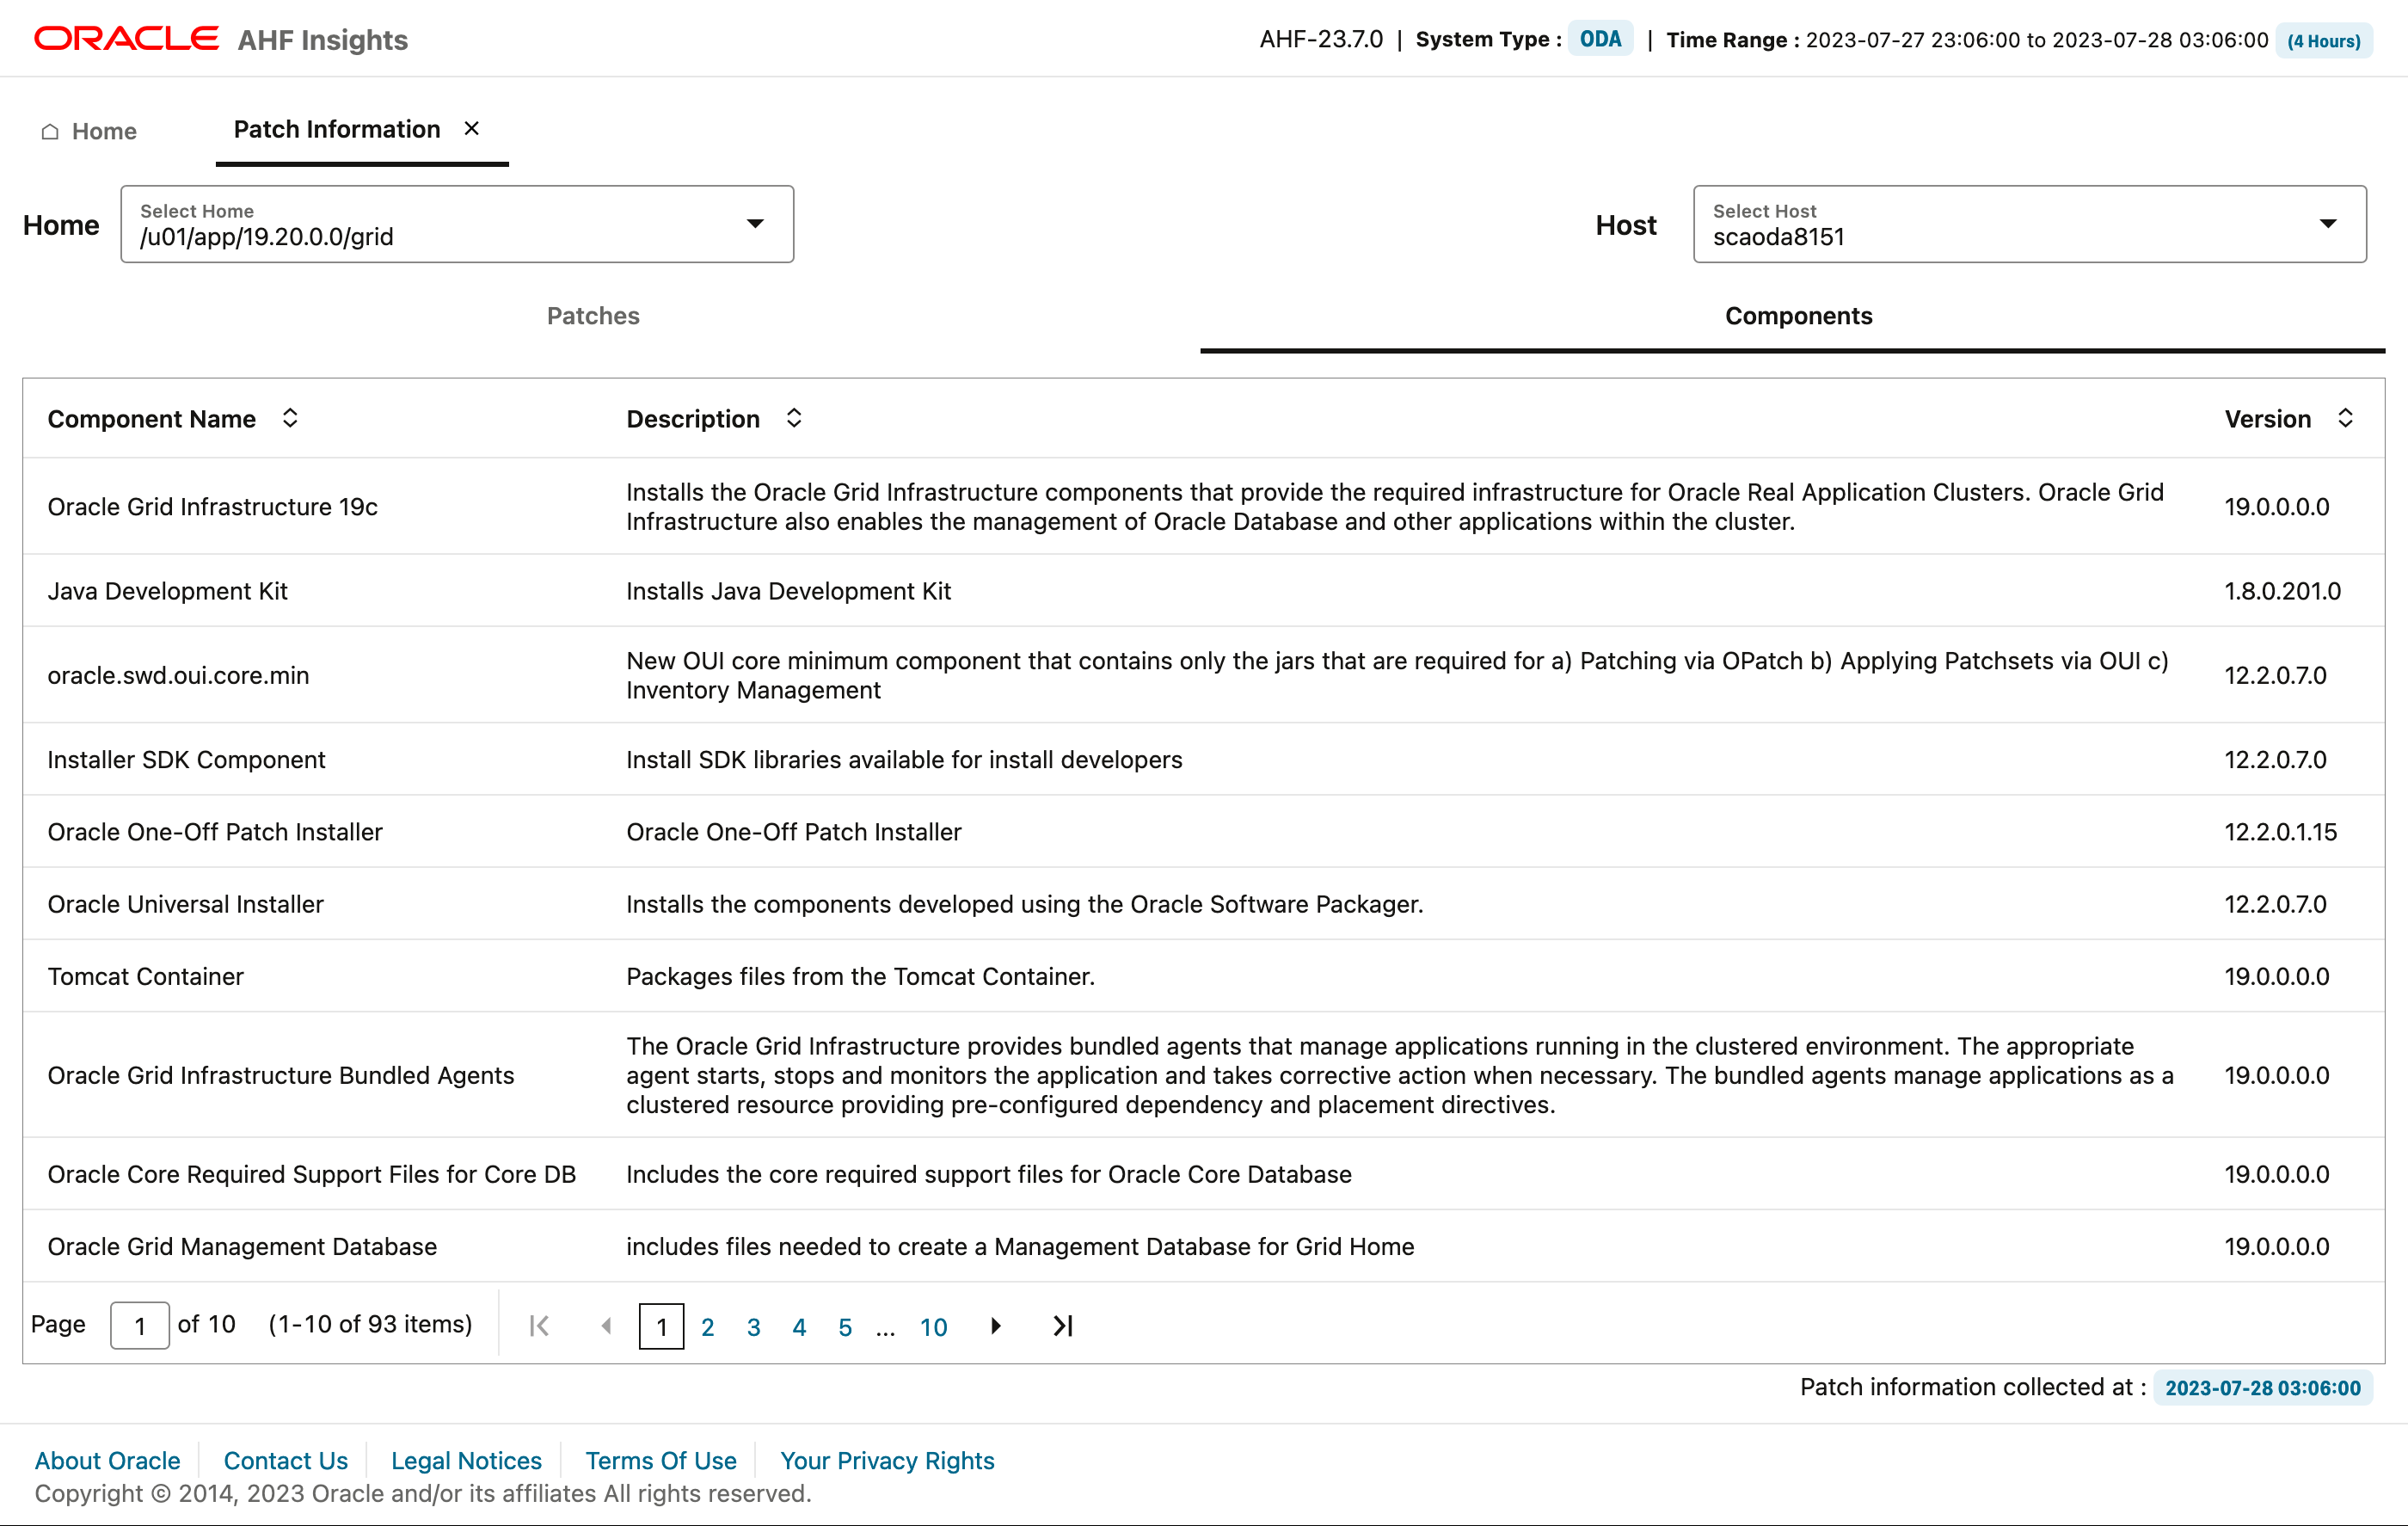
Provides a list of patches to keep track of which patch was applied to which hosts, where (Oracle Database home or Grid home), and when (timeline). Gaps or inconsistencies in patching are highlighted across nodes for the same home. Lists bugs that a particular patch provides the fixes for. Bugs and relevant patch information can be quickly searched and viewed via interactive reports.
Patches tab:
- In the Timeline section, double-click a patch ID to view on which host and when the patch was applied.
- Enter the patch ID in the filter field to filter and view the patch details.
- Click Show to display the Patch Analysis details in a side panel.
- Click the X mark to clear the filter.
Components tab: Provides a paginated list components and their version affected by applying the patches.
Parent topic: Insights
5.3.2.11 Space Analysis
How does AHF Insights UI render this information
Figure 5-28 Disk Utilization
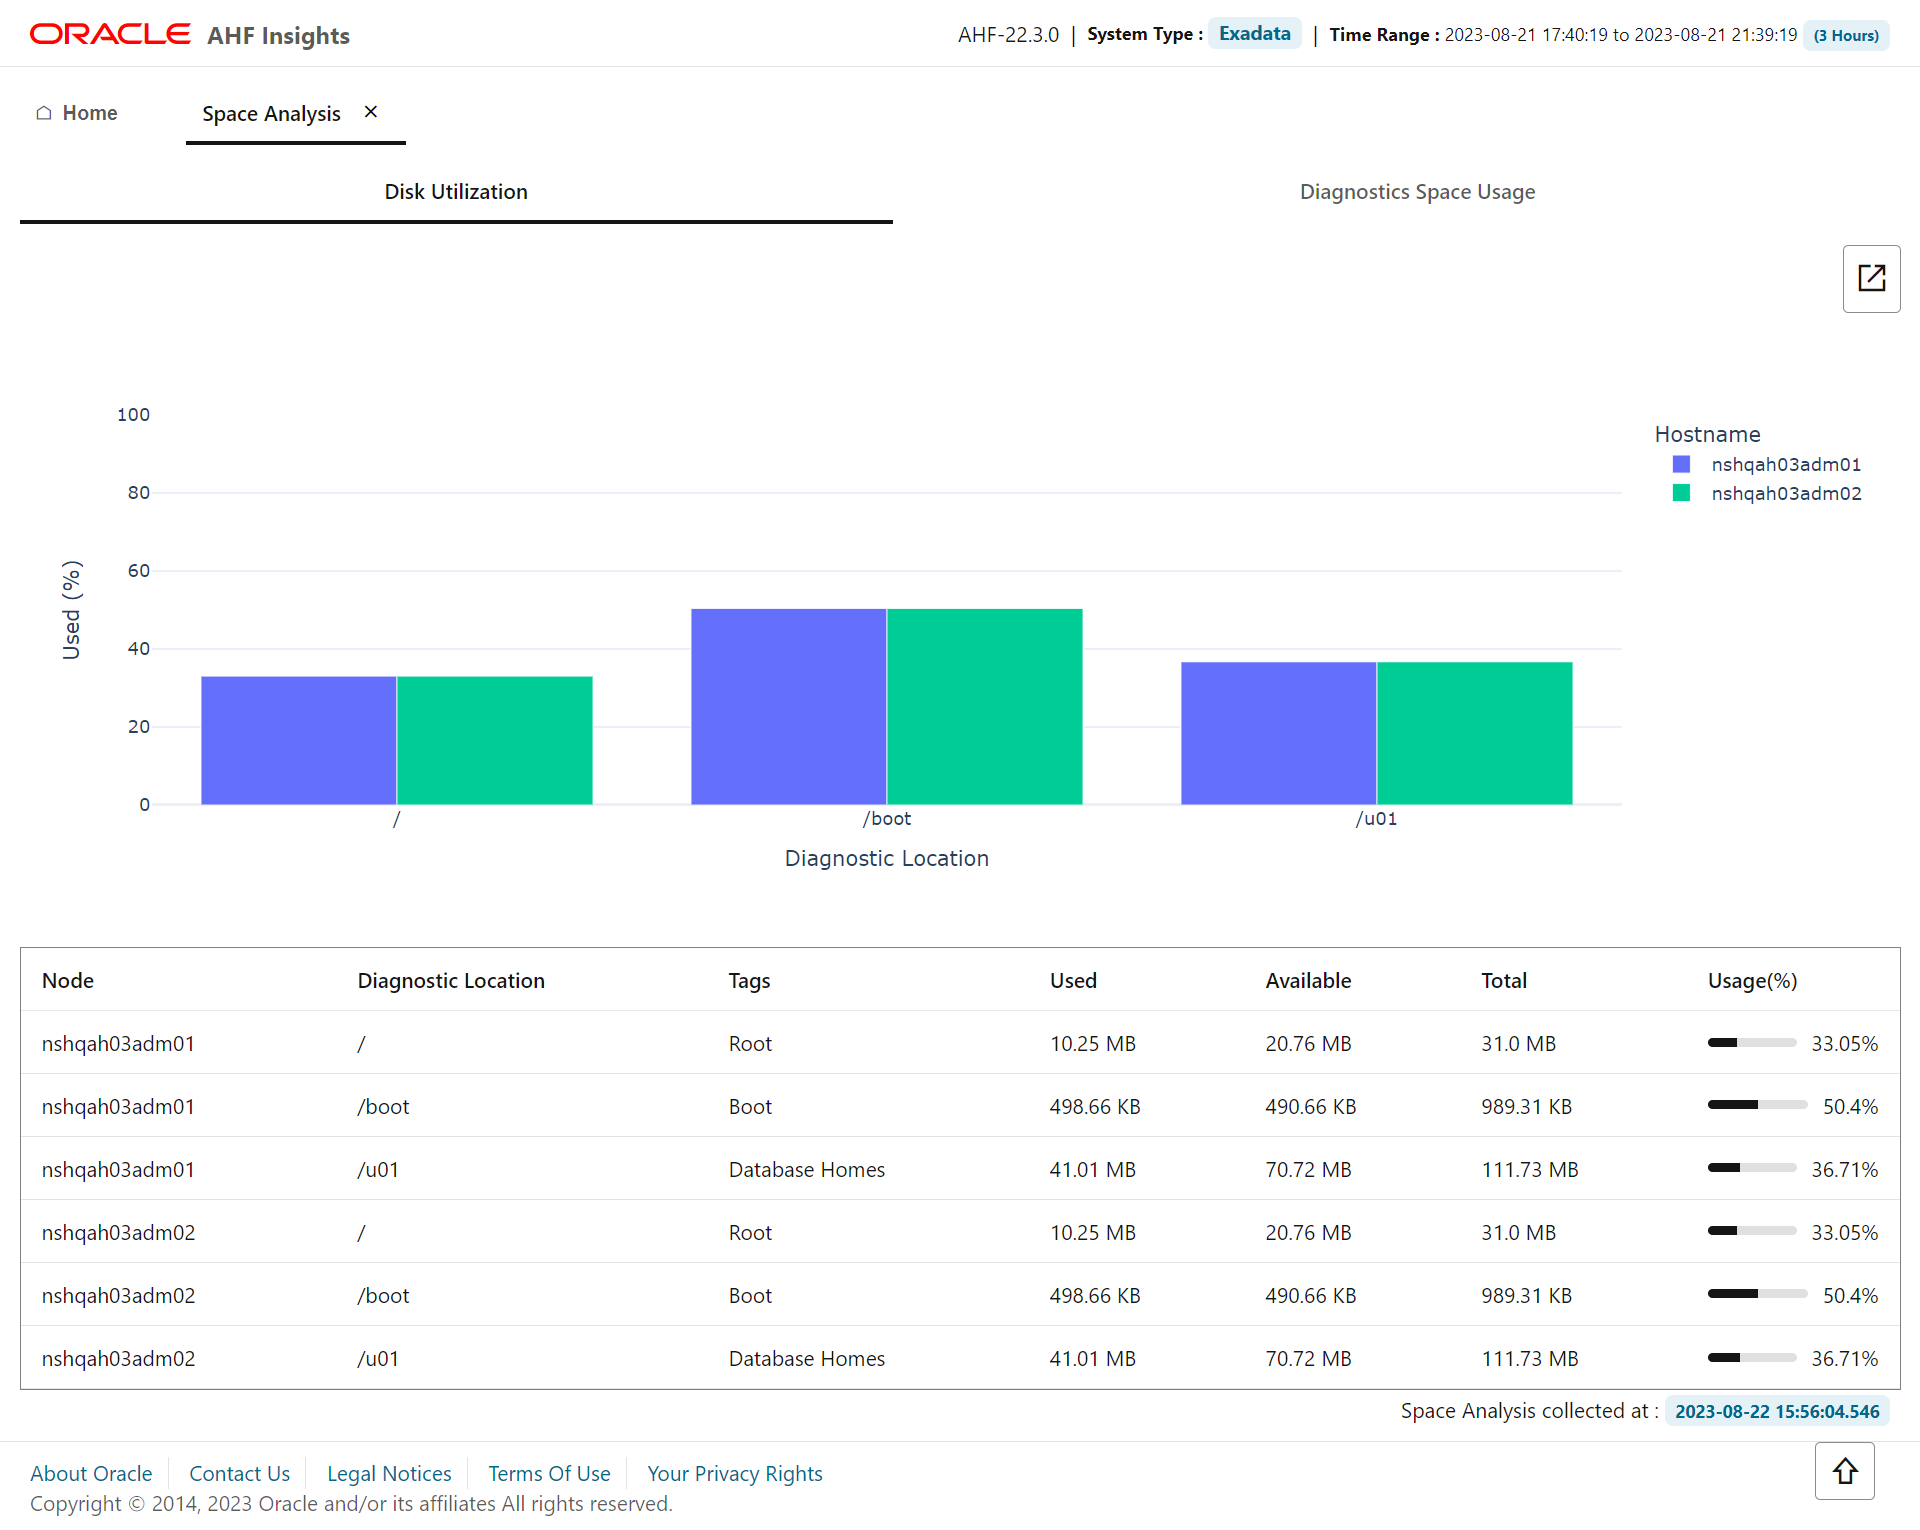
Figure 5-29 Diagnostic Space Usage
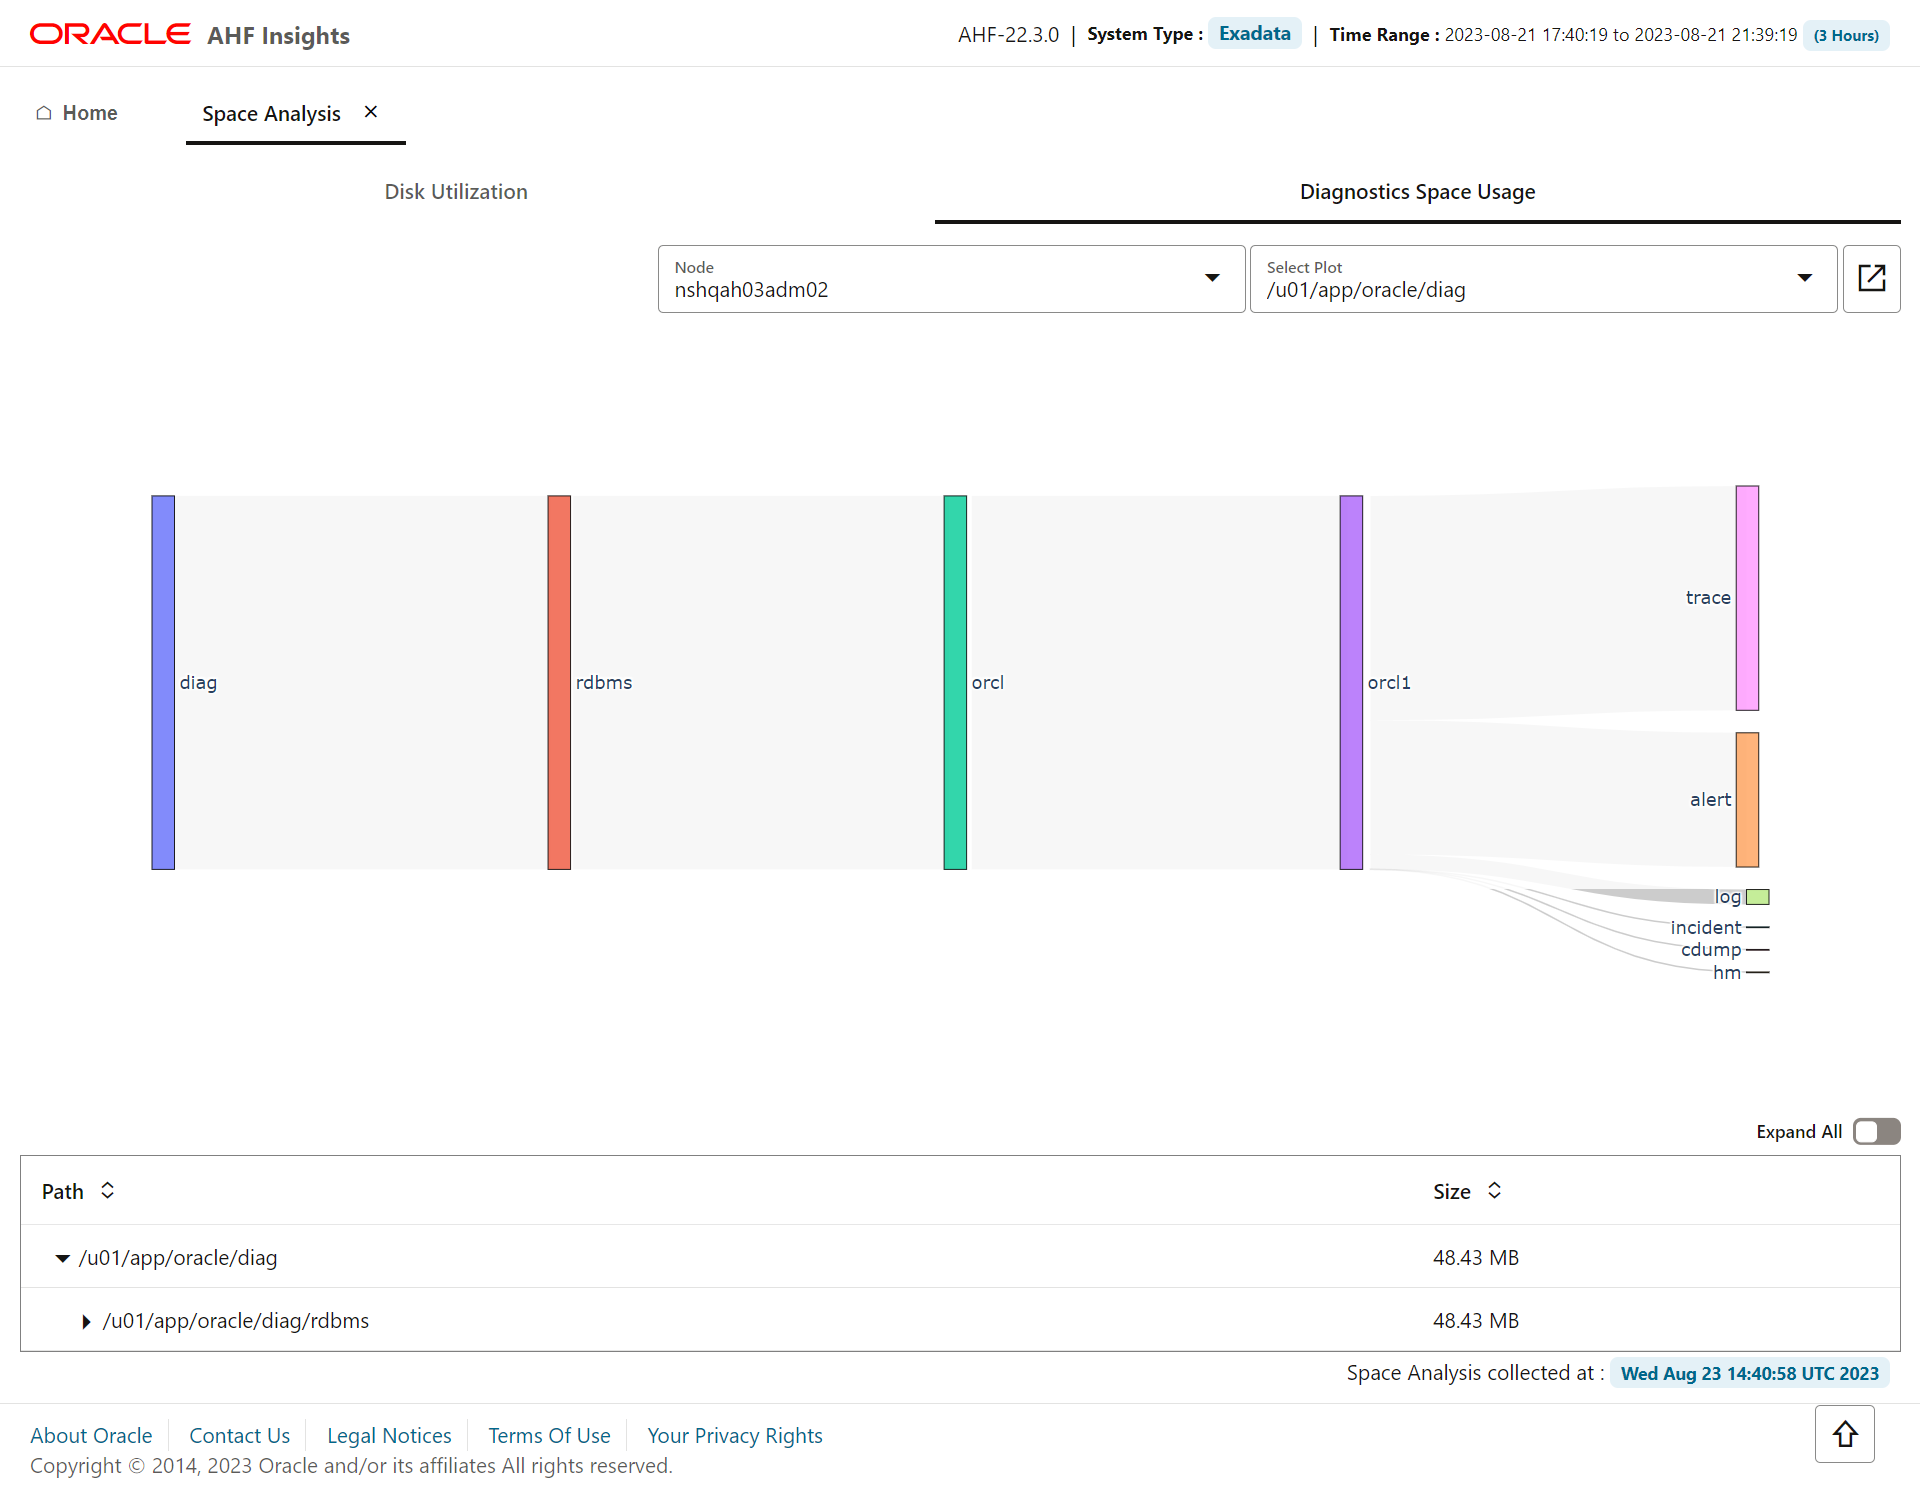
Disk Utilization tab: Provides a paginated view of host-wise directory structure, space consumed by directories and files, and available space.
Diagnostic Space Usage tab: Provides a paginated view of disk space consumed by diagnostics. Use the drop-down lists to filter by nodes and diagnostics collected.
Related Topics
Parent topic: Insights
5.3.2.12 Database Anomalies Advisor
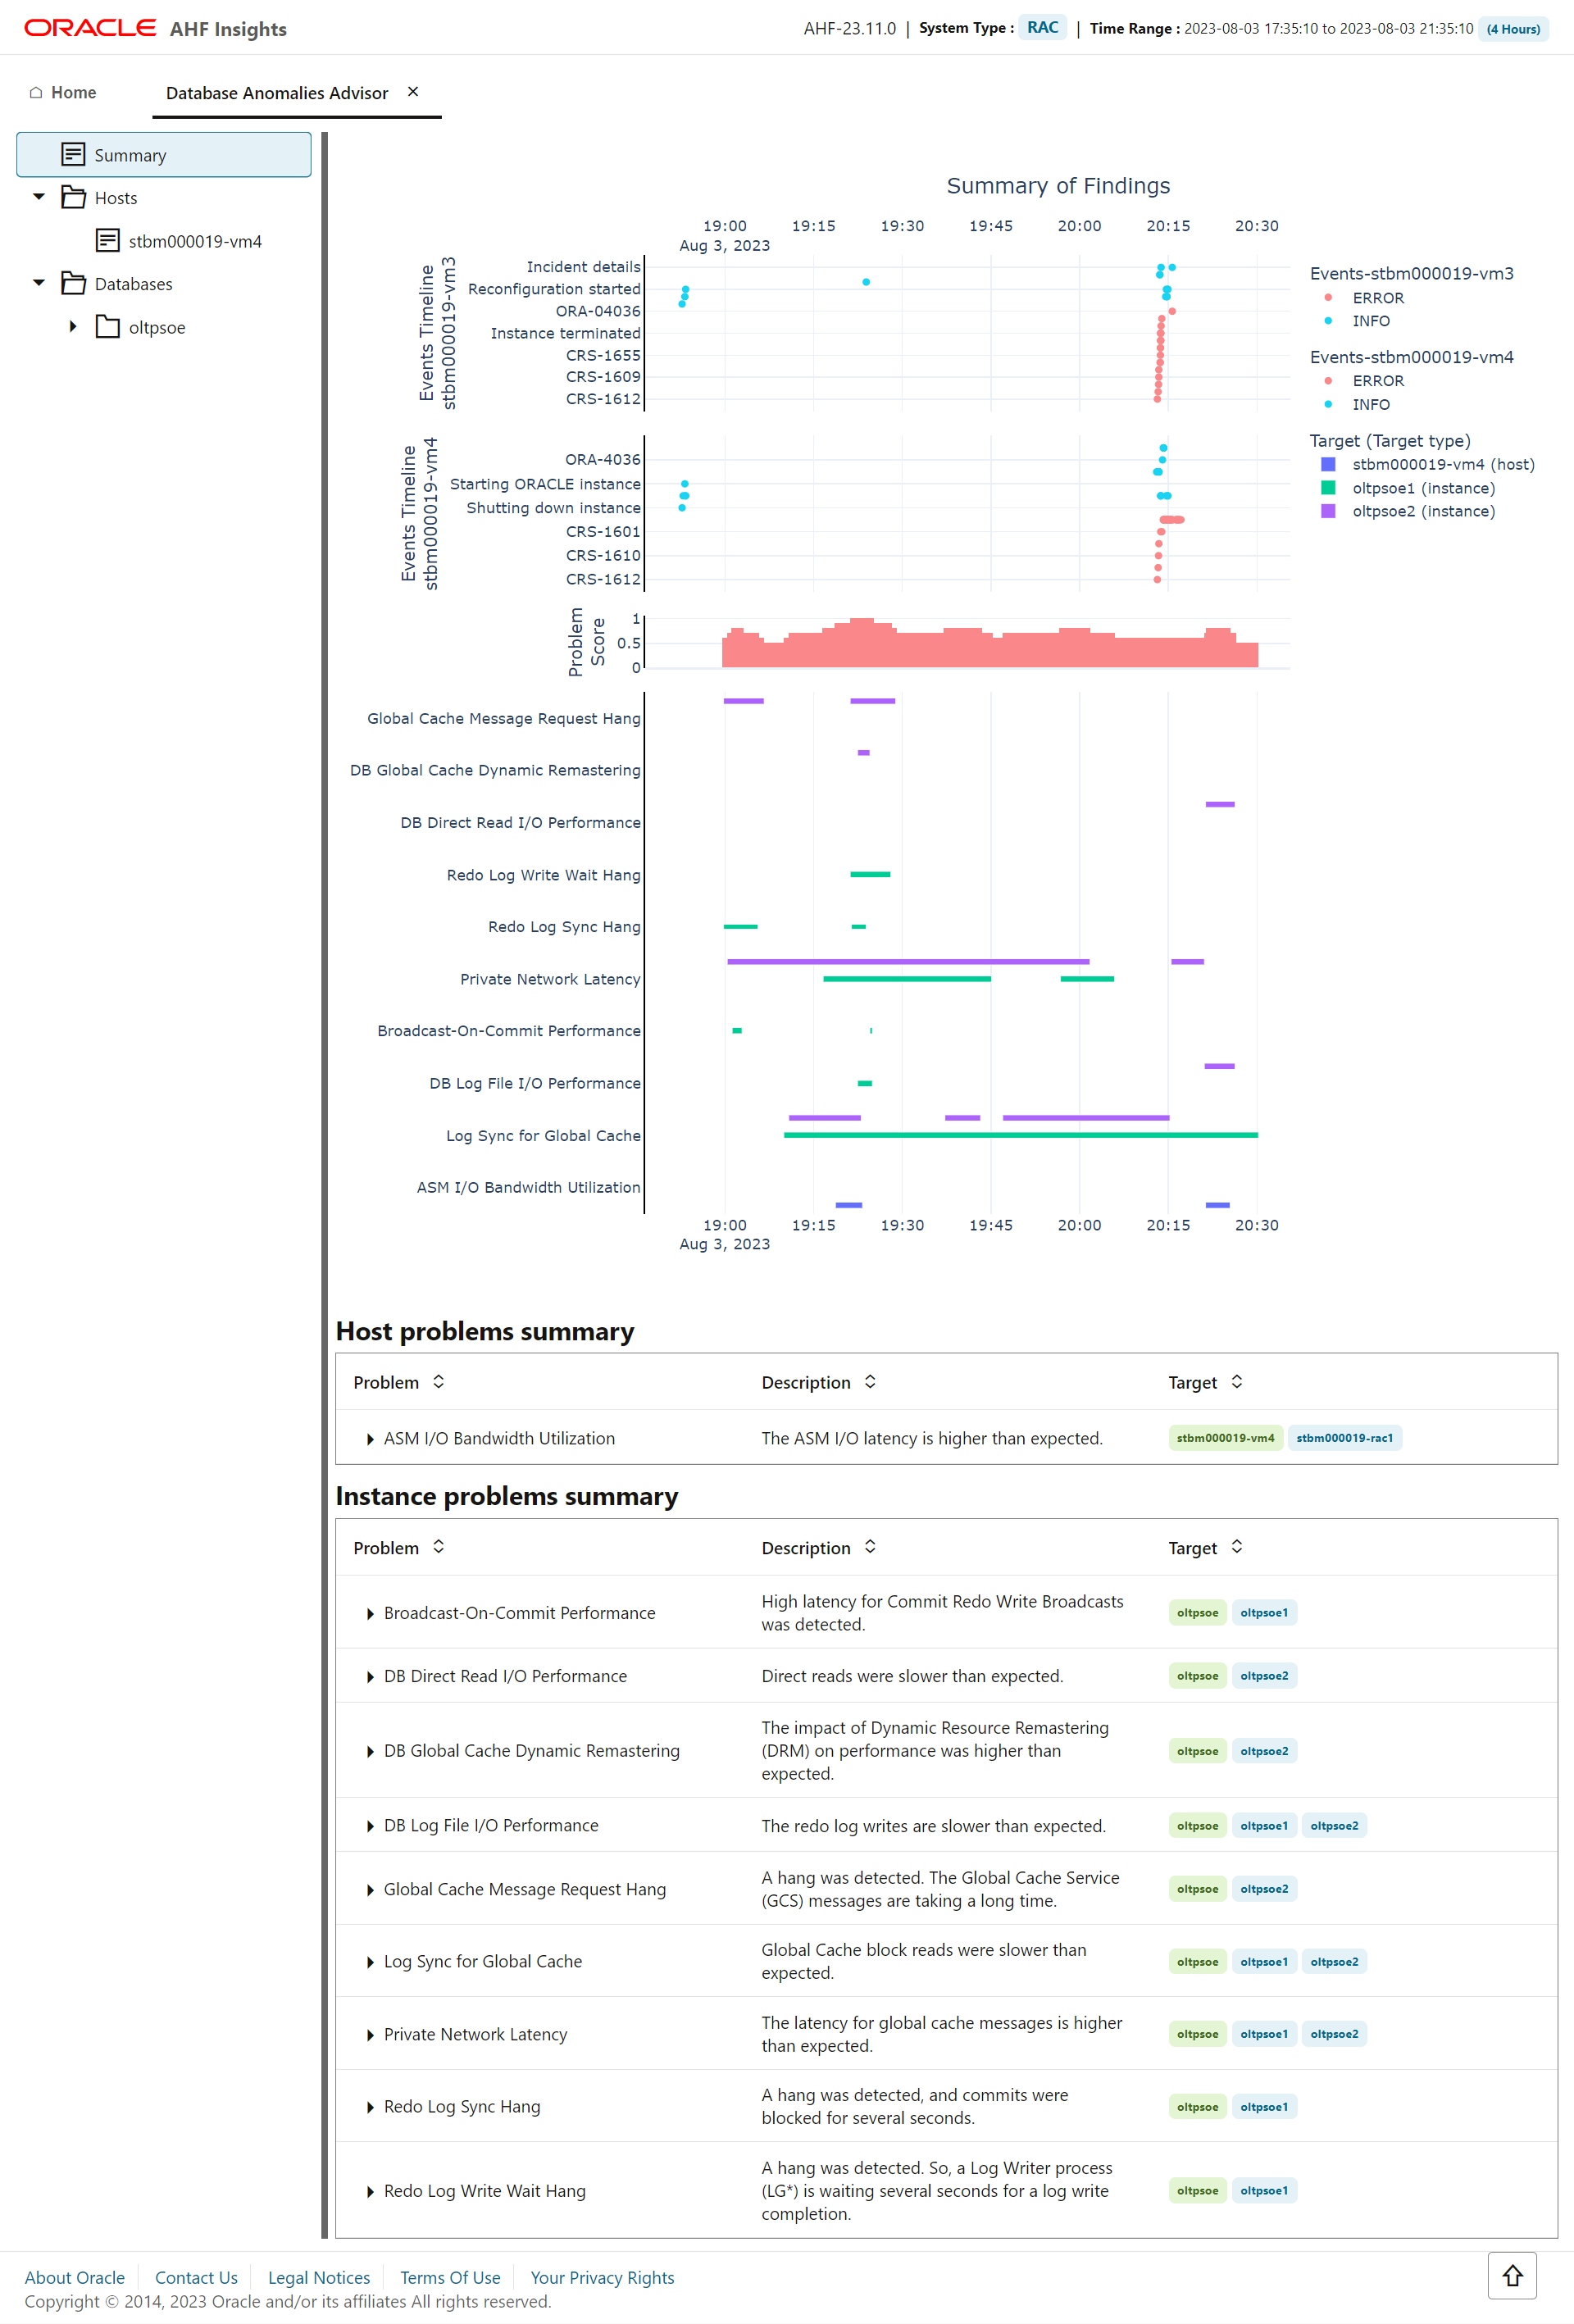
AHF detects database anomalies and identifies the cause and corrective action.
The Database Anomalies Advisor shows a summary timeline of anomalies for hosts and database instances. Findings can be drilled into to understand the cause and recommendation action.
To view the Database Anomalies Advisor and it’s recommendations, run ahf analysis create --type insights, open the resulting report, and click Database Anomalies Advisor.
Figure 5-30 Database Anomalies Advisor
Related Topics
Parent topic: Insights
5.3.2.13 Performance Reports
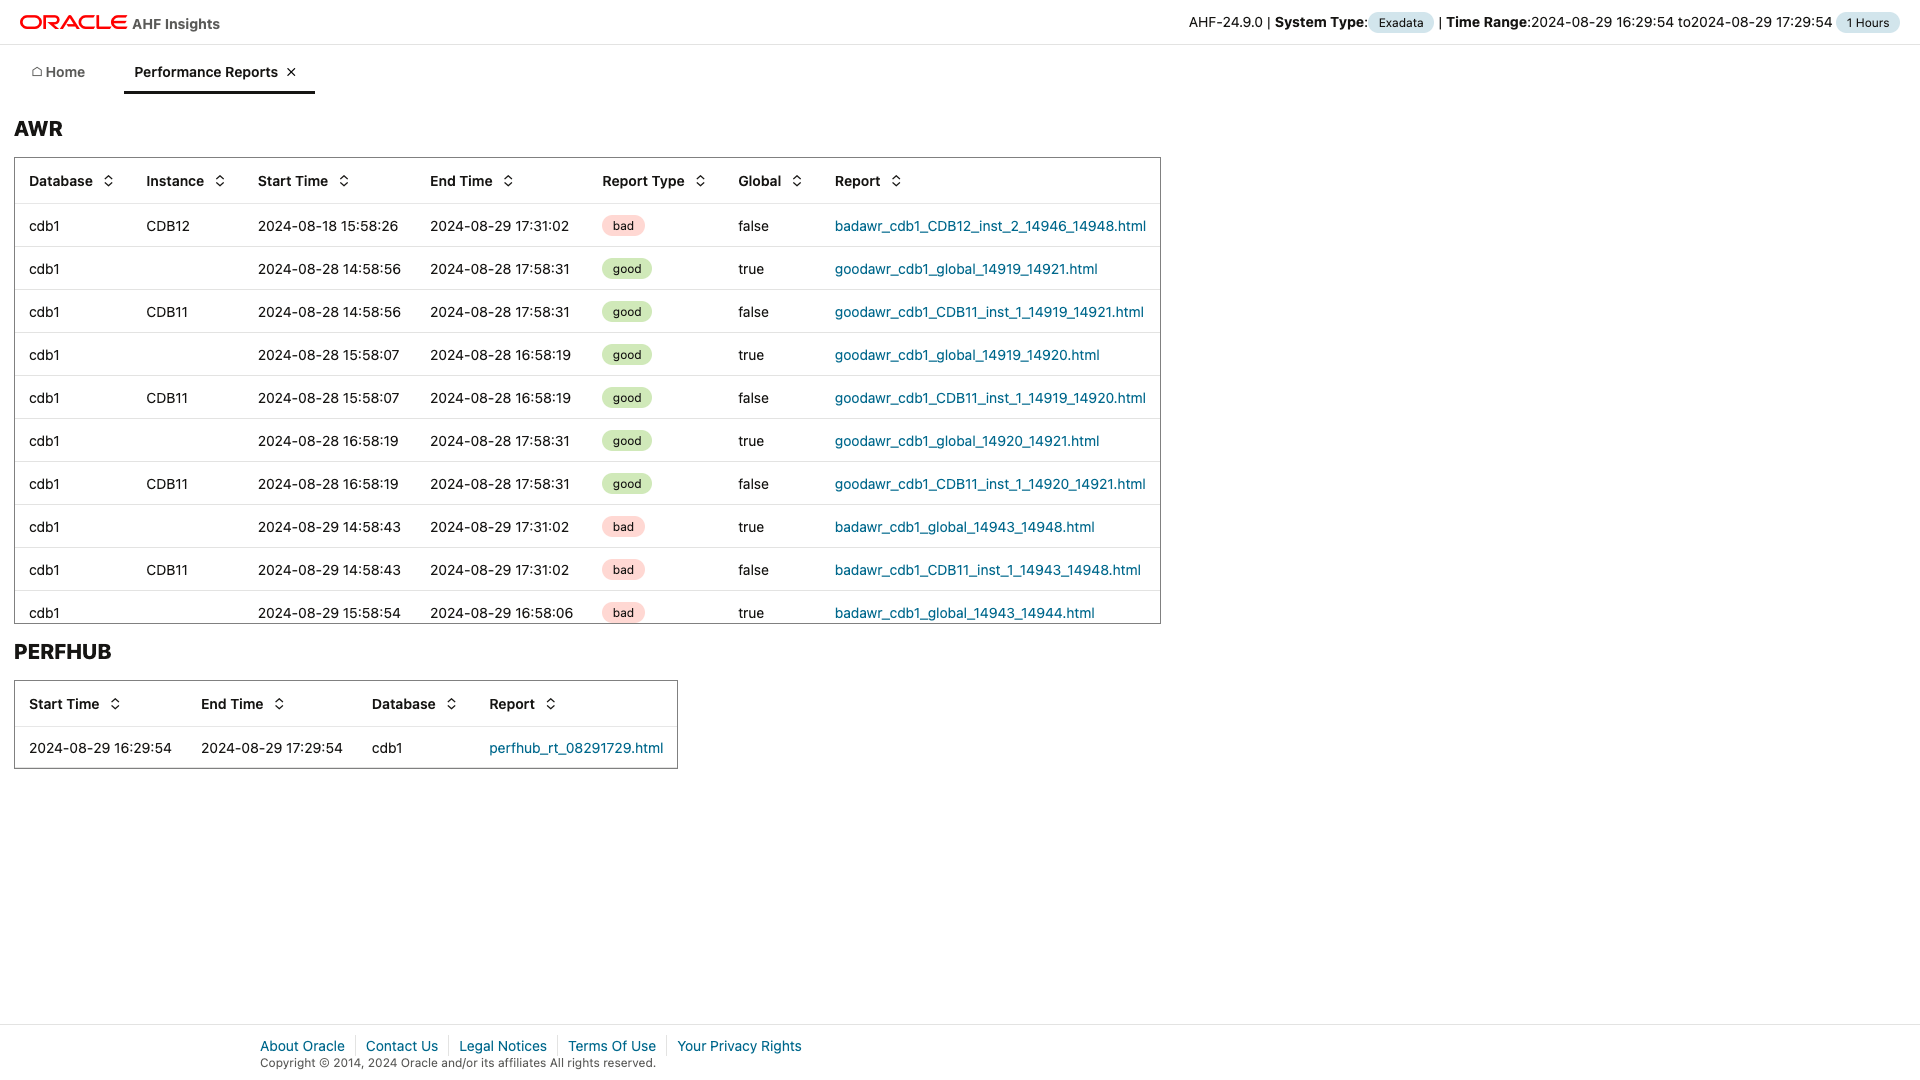
Performance Reports in the context of Oracle Database are diagnostic tools used to monitor and analyze database performance. These reports help database administrators (DBAs) to identify inefficiencies, bottlenecks, and other performance issues.
dbperf SRDC, using the command:tfactl diagcollect -srdc dbperf -database db_nameFigure 5-31 Performance Reports
How These Reports Are Helpful
- Diagnosing performance bottlenecks
- Identifying resource-hungry SQL queries
- Monitoring system workload and usage trends
- Aiding in database performance tuning and optimization
System and Platform Compatibility
These performance reports can be generated across various Oracle systems, such as Exadata, Oracle Database Appliance (ODA), Real Application Clusters (RAC), and Single Instance Databases (SIDB). They are also supported on multiple platforms, including Linux and Solaris.
AWR Reports (Automatic Workload Repository)
AWR is a built-in Oracle feature that collects, processes, and stores database performance statistics. These statistics are used to generate a detailed report of the database's performance over a specified time frame.
- CPU, memory, and I/O usage statistics
- Database wait events (where time is spent in the system)
- Top SQL queries consuming the most resources
- Instance activity and overall workload data
- Object-level statistics, such as index usage and table scans
AWR reports help in diagnosing performance bottlenecks, resource-intensive SQL queries, and identifying areas for optimization. They are valuable in tuning the database and ensuring it runs efficiently.
AWR Compare Reports
AWR Compare Reports allow users to compare database performance between two specific time periods, providing insights into how performance metrics have changed over time.
- Comparison of key metrics such as wait events, resource usage (CPU, memory, and I/O), and SQL performance
- Highlights differences in system performance between the two snapshots
These reports are particularly useful for identifying the impact of a system event, such as an upgrade or configuration change, and comparing performance under different workloads.
PerfHub Reports
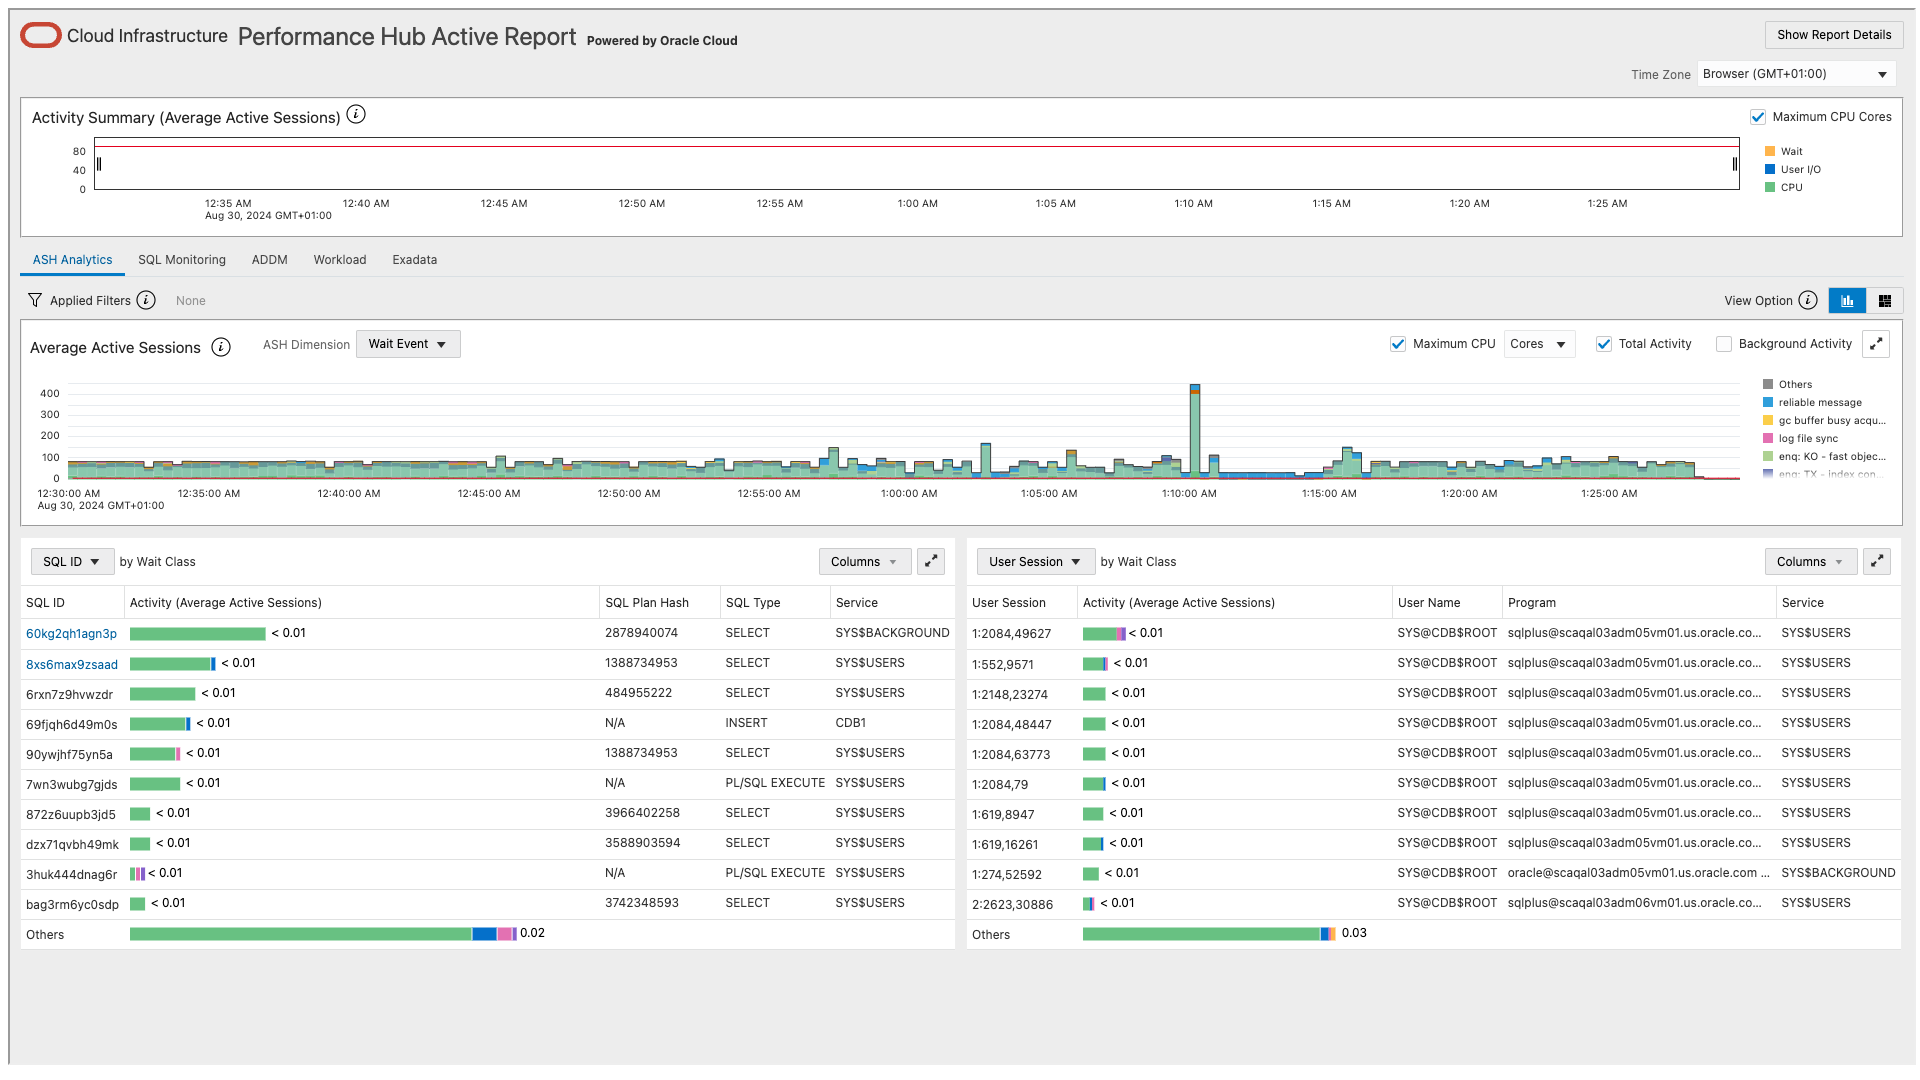
PerfHub is part of Oracle Cloud (Autonomous Database) and provides an interactive, graphical interface for real-time performance diagnostics. It allows users to visualize performance data through a dashboard, offering a modern approach to performance reporting.
Figure 5-32 Performance Hub Reports
- CPU and memory usage trends
- SQL performance data
- I/O metrics
- Top waits and system bottlenecks
PerfHub reports are especially beneficial in cloud environments, providing real-time insights and helping administrators quickly pinpoint performance issues and bottlenecks.
Parent topic: Insights