4.6 Adding Interactions to a Map Visualization
You can enhance your map interaction by configuring tooltips and info windows for the map layers used in the map visualization.

Spatial Studio supports the following interactive features:

  • Tooltip: A tooltip is shown when you hover over a location on your map and displays the specified attribute information.
  • Info Window An info window (popup window) displays the configured information for one or more map layers at a given location or shape on your map.

4.6.1 Configuring and Viewing an Info Window

You can configure an info window to display selected attributes of a map layer at a given location on your map visualization.

Perform the following steps to configure an info window.

The instructions assume that you have a map layer displayed on your Active Project page.
  1. Click Menu Icon against the map layer in the Layers tab of the Layers List.
  2. Select Settings in the context menu.
  3. Select the Interaction option from the Configure drop-down list.
  4. Enable Show info window under Info window.
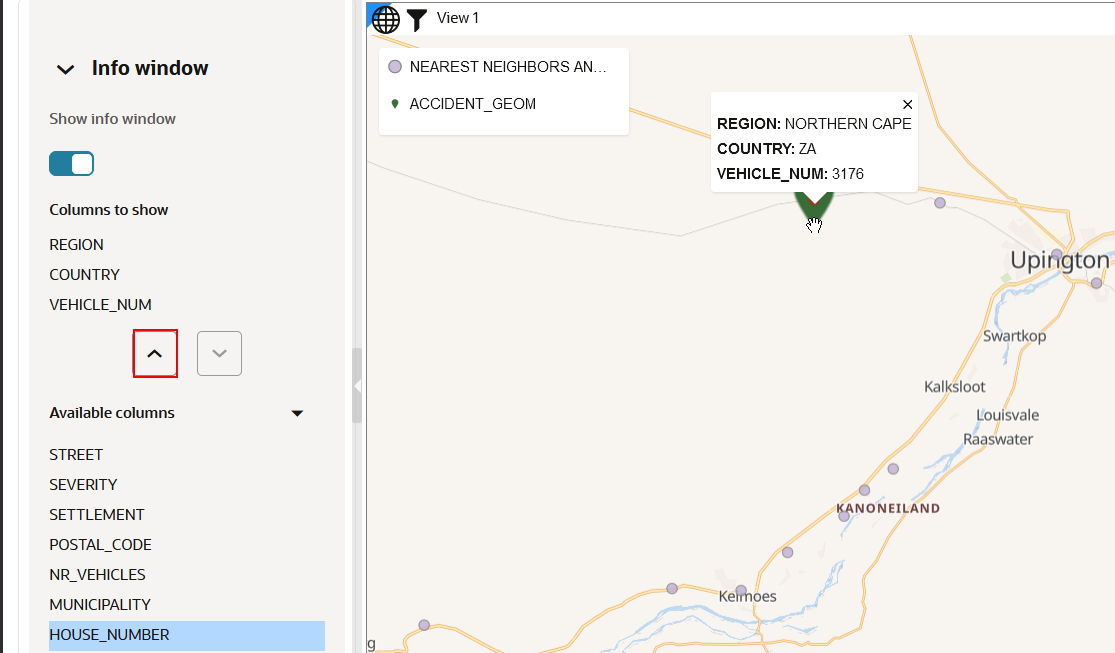
  5. Select one or more Columns to show as shown in the following steps.
    1. Select the desired dataset column from the list under Available Columns, and click the up arrow (shown highlighted in the following figure) to add the column.
      The selected column appears under Columns to show.

      Alternatively, you can click the down arrow to remove a previously selected column.

    2. Optionally, rearrange the columns using drag and drop.
      This affects the display order of the selected columns inside the info window on the map.
  6. Optionally, repeat the above steps for all the required map layers used in your map visualization.
  7. Click on a specific location on your map to view the info window.

    Figure 4-45 Viewing Info Window on a Map Visualization

    Description of Figure 4-45 follows
    Description of "Figure 4-45 Viewing Info Window on a Map Visualization"

    The map visualization shown in the preceding figure contains two map layers. The info window displays data values for both the map layers as the data points for these map layers overlap at the specified location.

4.6.2 Configuring and Viewing a Tooltip

Perform the following steps to configure a tooltip.
The instructions assume that you have a map layer displayed on your Active Project page.
  1. Click Menu Icon against the map layer in the Layers tab of the Layers List.
  2. Select Settings in the context menu.
  3. Select the Interaction option from the Configure drop-down list.
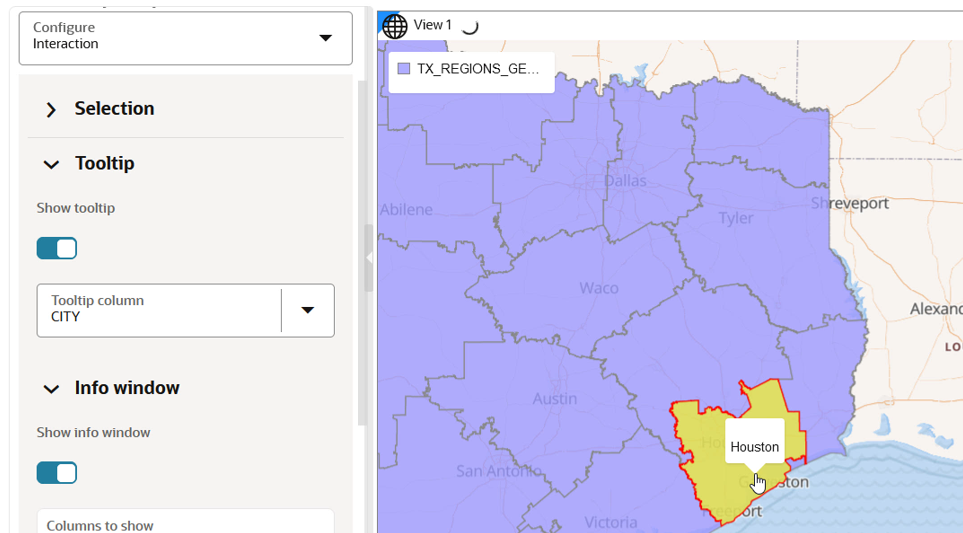
  4. Enable Show tooltip under Tooltip.
  5. Select a Tooltip column.
  6. Hover over a specific data point or shape on your map to view the tooltip information.

    Figure 4-46 Viewing a Tooltip on Map Visualization

    Description of Figure 4-46 follows
    Description of "Figure 4-46 Viewing a Tooltip on Map Visualization"